. 2021 Feb 5;7(1):veab007.
doi: 10.1093/ve/veab007. eCollection 2021 Jan.

The evolutionary history of ACE2 usage within the coronavirus subgenus Sarbecovirus

Affiliations

The evolutionary history of ACE2 usage within the coronavirus subgenus Sarbecovirus

H L Wells et al. Virus Evol. .

Abstract

Severe acute respiratory syndrome coronavirus 1 (SARS-CoV-1) and SARS-CoV-2 are not phylogenetically closely related; however, both use the angiotensin-converting enzyme 2 (ACE2) receptor in humans for cell entry. This is not a universal sarbecovirus trait; for example, many known sarbecoviruses related to SARS-CoV-1 have two deletions in the receptor binding domain of the spike protein that render them incapable of using human ACE2. Here, we report three sequences of a novel sarbecovirus from Rwanda and Uganda that are phylogenetically intermediate to SARS-CoV-1 and SARS-CoV-2 and demonstrate via in vitro studies that they are also unable to utilize human ACE2. Furthermore, we show that the observed pattern of ACE2 usage among sarbecoviruses is best explained by recombination not of SARS-CoV-2, but of SARS-CoV-1 and its relatives. We show that the lineage that includes SARS-CoV-2 is most likely the ancestral ACE2-using lineage, and that recombination with at least one virus from this group conferred ACE2 usage to the lineage including SARS-CoV-1 at some time in the past. We argue that alternative scenarios such as convergent evolution are much less parsimonious; we show that biogeography and patterns of host tropism support the plausibility of a recombination scenario, and we propose a competitive release hypothesis to explain how this recombination event could have occurred and why it is evolutionarily advantageous. The findings provide important insights into the natural history of ACE2 usage for both SARS-CoV-1 and SARS-CoV-2 and a greater understanding of the evolutionary mechanisms that shape zoonotic potential of coronaviruses. This study also underscores the need for increased surveillance for sarbecoviruses in southwestern China, where most ACE2-using viruses have been found to date, as well as other regions such as Africa, where these viruses have only recently been discovered.

Keywords: coronavirus; recombination; viral ecology; virus evolution.


Figures

Figure 1.
Figure 1.
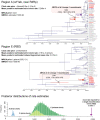
Phylogenetic tree of the RNA-dependent RNA polymerase (RdRp) gene (nsp12) and associated geographic origin and host species. Colors of clade bars represent the different geographic lineages. Lineage 1 is shown in blue, Lineage 2 in green, and Lineage 3 in orange. The clade of viruses from Africa and Europe is putatively named ‘Lineage 4’ and is shown in purple. The phylogeny shows strong posterior support for the branching order presented; however, different models or genes have produced trees with different branching orders placing Lineage 4 outside Lineage 5, so the branch to Lineage 4 is dashed to represent this uncertainty (Supplementary Fig. S1). The putative ‘Lineage 5’ containing SARS-CoV-2 is also shown in blue at the bottom of the tree to demonstrate that the sequences are from the same regions as Lineage 1 viruses. The geographic origin of each virus is indicated by the lines that terminate in the respective country or province with the same color code. The full province and country names for all two- and three-letter codes can be found in Table 1. As human, civet, and pangolin viruses cannot be certain to have naturally originated in the province in which they were first found, their locations are not illustrated, but the natural range of the pangolin (Manis javanica) is denoted with dashed shading and the origins of the SARS-CoV-1 and SARS-CoV-2 human outbreaks are designated with red stars in Guangdong and Hubei, respectively. Hosts are also shown with colored symbols according to the key on the left. The host phylogeny in the key was adapted from Agnarsson et al. (2011). The root of the tree was shortened for clarity.
Figure 2.
Figure 2.
Phylogenetic trees of RdRp (left) and the RBD (right) demonstrating recombination events between ACE2-users and non-ACE2-users. Names of viruses that have been confirmed to use hACE2 are shown in red font, and those that have been shown to not use hACE2 are shown in blue font (citations can be found in Table 1). Viruses in black font have not yet been tested. The red and blue highlighted clade bars separate viruses with the structure associated with ACE2 usage (highly similar to viruses confirmed to use hACE2 specifically) and the structure with deletions that cannot use ACE2, respectively. Connecting lines indicate recombination events that resulted in a gain of ACE2 usage (red) or a loss of ACE2 usage (blue). The two different groups of RBD sequence within the Lineage 1 recombinants that gained ACE2 usage are distinguished in red (Type 1) and purple (Type 2) highlighting. The distances of the roots have been shortened for clarity. The branch leading to Lineage 4 is dashed to demonstrate uncertainty in its positioning.
Figure 3.
Figure 3.
hACE2 usage of bat sarbecoviruses investigated using a surrogate VSV-psuedotyping system. (A) Schematic showing the structure of chimeric spike proteins. The SARS-CoV-1 spike backbone is used in conjunction with the RBD from the Uganda and Rwanda strains. (B) Incorporation of chimeric SARS-CoV-1 spike proteins into VSV. Western blots show successful expression of chimeric spikes (lysates) and their incorporation into VSV (particles). (C) hACE2 entry assays. Left, wildtype SARS-CoV spike protein is able to mediate entry into BHK cells expressing hACE2. In contrast, recombinant spike proteins containing either the Uganda or Rwanda RBD were unable to mediate entry. Entry is expressed relative to VSV particles with no spike protein. Right, control experiment for entry assay. BHK cells do not express hACE2 and therefore do not permit entry of hACE2-dependent VSV pseudotypes.
Figure 4.
Figure 4.
Structural modeling of sarbecovirus RBDs found in Uganda and Rwanda. (A) Structural superposition of the X-ray structures for the RBDs in SARS-CoV-1 (PDB 2ajf, red) (Li et al. 2005) and SARS-CoV-2 (PDB 6m0j, cyan) (Lan et al. 2020) and homology models for SARS-CoV found in Uganda (PDF2370 and PDF-2386, magenta) and Rwanda (PRD-0038, yellow). (B) Overview of the X-ray structure of SAR-CoV-1 RBD (red) bound to hACE2 (blue) (PDB 2ajf, red) (F. Li et al. 2005). (C) Close-up view of the interface between hACE2 (blue) and RBDs in SARS-CoV-1 (PDB 2ajf, top left) (Li et al. 2005) and SARSCoV-2 (PDB 6m0j, top right) (Lan et al. 2020) and homology models for viruses found in Uganda (PDF-2370 and PDF-2386, bottom, left) and Rwanda (PRD-0038, bottom, right). The color of the RBD loops corresponds to the colors of the labeled sequence regions in Fig. 5: region 1 in cyan, region 2 in orange, the receptor binding ridge in purple, and region 3 in green. Labeled RBD residues correspond to interfacial residues whose identity differ in African sarbecoviruses and SARS-CoV-1 or SARS-CoV-2 (labels are included in all four panels to facilitate the identification of counterpart residues in each virus). Asterisks denote residues whose identity is not shared by any ACE-2 binding SARS-CoV as dictated by Fig. 5. Labeled hACE2 residues correspond to residues within 5 Å of RBD residues depicted.
Figure 5.
Figure 5.
The phylogenetic backbone of the RdRp gene alongside the amino acid sequences of the RBM. Amino acid numbering is relative to SARS-CoV-1. Virus names in red font are known hACE2 users, those in blue are known non-users, and those in black have not been tested. Residues within 10 Å of the interface with hACE2 are considered interfacial, and exact distances between each interfacial residue and the closest hACE2 residue (based on structural modeling of SARS-CoV-1 bound with hACE2) are shown along the bottom. Residues that are closer to the interface (3 Å or less) and thus make strong interactions with hACE2 are shown in red, and as distance increases this color transitions to purple, blue, and finally to white. The receptor binding ridge sequences are highlighted in purple and the remaining interfacial segments have been numbered regions 1, 2, and 3 for clarity within the main text. The colors of these regions correspond with the colors in the structural models of Fig. 4. The branch leading to Lineage 4 is dashed to demonstrate uncertainty in its positioning.
Figure 6.
Figure 6.
Recombination breakpoints detected in Lineage 1 ACE2-using sequences. The top of this figure illustrates that the recombination suggested by the change in topology in Fig. 2 for 13 Lineage 1 viruses is supported by formal breakpoint analysis. The breakpoints detected for each of the 13 recombinant Lineage 1 sequences with ACE2-using structure (no deletions) are shown. Sequences that are nearly identical are colored the same for simplicity. The bars represent the sequence of genome beginning 750 bp before RdRp spanning through the end of S2 (SARS-CoV-2 nucleotides 12,681 through 25,176) and each box within represents a recombinant section within the sequence. The breakpoints correspond to those identified in Table 2. Numbering is relative to the alignment. The parental sequence is shown within each box. Sequences identified as the minor parent by 3SEQ were labeled within the breakpoint margins and the major parent outside. Six regions where these sequences appear to be free of recombination are labeled A–F and a corresponding phylogeny for each region is shown below. Regions A and E were further tested for recombination breakpoints in all sequences, not just the 13 Lineage 1 viruses, and were found to be breakpoint-free. The topology of regions A and E is not different enough from Fig. 2 to suggest that recombination within RdRp or RBD significantly changed the interpretation of our results. For each region, sequences were tracked with connecting lines of corresponding color to identify where recombination may have occurred between Lineage 1 and Lineage 5 and hypothesized events are specifically marked with dotted lines. This highlights the secondary recombination of Rs4084 and RsSHC014 in region E on top of the primary recombination in regions B through E. Sequence names of Lineage 2 and 3 viruses are greyed out and Lineages 4 and 5 are collapsed and highlighted in darker grey to make the changes in topology between the trees more visible.
Figure 7.
Figure 7.
Time-calibrated phylogenies for recombination-free regions of the genome. Breakpoint-free regions A and E from Fig. 6 were chosen for time calibration since evidence of recombination was found in both RdRp and RBD. Both regions A and E were free of recombination for all sequences included in the tree, ensuring the best possible dating estimates. The MRCA of all Lineage 1 recombinants and its corresponding divergence date are labeled on each tree, demonstrating that the MRCA in region E (within the RBD) is much older than the MRCA in region A (proxy for RdRp, see Fig. 6). This suggests that there would not have been enough time for the RBDs of the recombinants to diversify to the extent shown here if only a single recombination event occurred between Lineage 5 and Lineage 1. The MRCAs of each type are labeled in red (Type 1) and purple (Type 2). Posterior distributions of rate estimates are also shown for each model as well as for a relaxed clock model of region E. For the observed sequence divergence in region E to have accumulated since the MRCA of the 13 recombinants in region A (1852), a clock rate of 5.899e-3 would be required, which is well outside the posterior distributions estimated by both our strict and relaxed clock models.
Figure 8.
Figure 8.
Proposed timeline of deletion and recombination events. The timeline demonstrates the sequence of events that led to loss of ACE2 usage in Lineages 2, 3, and 4 and gain of ACE2 usage within Lineage 1, leading to the emergence of SARS-CoV-1. Events are dated with MRCA age estimates; however, the exact intention is less to provide exact dates and more to suggest a particular order of events, which is strongly supported by the posterior probabilities of the time-calibrated phylogenies. The arrow for the Lineage 4 event is again dashed to demonstrate uncertainty in its positioning. We illustrate two hypotheses for the acquisition and subsequent spread of ACE2 usage in Lineage 1: recombination and persistence. The recombination hypothesis is much more parsimonious, as persistence would require multiple independent deletion events to generate the observed pattern of ACE2 usage.

Update of

Similar articles

Cited by

References

    1. Agnarsson I. et al. (2011) ‘ A Time-Calibrated Species-Level Phylogeny of Bats (Chiroptera, Mammalia)’, PLoS Currents, 3: RRN1212. - PMC - PubMed
    1. Anthony S. J. et al. (2017a) ‘Further Evidence for Bats as the Evolutionary Source of Middle East Respiratory Syndrome Coronavirus’. MBio, 8: e00373–17. - PMC - PubMed
    1. Anthony S. J., PREDICT Consortium et al. (2017b) ‘ Global Patterns in Coronavirus Diversity’, Virus Evolution, 3: vex012. - PMC - PubMed
    1. Ar Gouilh M. et al. (2018) ‘ SARS-CoV Related Betacoronavirus and Diverse Alphacoronavirus Members Found in Western Old-World’, Virology, 517: 88–97. - PMC - PubMed
    1. Boni M. F. et al. (2020) ‘ Evolutionary Origins of the SARS-CoV-2 Sarbecovirus Lineage Responsible for the COVID-19 Pandemic’, Nature Microbiology, 5: 1408–17. - PubMed