. 2021 Mar 4;11(9):4483-4501.
doi: 10.7150/thno.54473. eCollection 2021.

The subcellular redistribution of NLRC5 promotes angiogenesis via interacting with STAT3 in endothelial cells

Affiliations

The subcellular redistribution of NLRC5 promotes angiogenesis via interacting with STAT3 in endothelial cells

Xu Xu et al. Theranostics. .

Abstract

Angiogenesis is a critical step in repair of tissue injury. The pattern recognition receptors (PRRs) recognize pathogen and damage associated molecular patterns (DAMPs) during injury and achieve host defense directly. However, the role of NLR family CARD domain containing 5 (NLRC5), an important member of PPRs, beyond host defense in angiogenesis during tissue repair remains unknown. Methods:In vitro, western blot and real-time PCR (RT-PCR) were used to detect the expression of NLRC5 in endothelial cells (ECs). Immunofluorescence microscopy was used to reveal the subcellular location of NLRC5 in ECs. Cell proliferation, wound healing, tube formation assays of ECs were performed to study the role of NLRC5 in angiogenesis. By using Tie2Cre-NLRC5flox/flox mice and bone marrow transplantation studies, we defined an EC-specific role for NLRC5 in angiogenesis. Mechanistically, co-immunoprecipitation studies and RNA sequencing indicated that signal transducer and activator of transcription 3 (STAT3) was the target of NLRC5 in the nucleus. And Co-IP was used to verify the specific domain of NLRC5 binding with STAT3. ChIP assay determined the genes regulated by interaction of STAT3 and NLRC5. Results: Knockdown of NLRC5 in vitro or in vivo inhibited pathological angiogenesis, but had no effect on physiological angiogenesis. NLRC5 was also identified to bind to STAT3 in the nucleus required the integrated death-domain and nucleotide-binding domain (DD+NACHT domain) of NLRC5. And the interaction of STAT3 and NLRC5 could enhance the transcription of angiopoietin-2 (Ang2) and cyclin D1 (CCND1) to participate in angiogenesis. Conclusions: In the ischemic microenvironment, NLRC5 protein accumulates in the nucleus of ECs and enhances STAT3 transcriptional activity for angiogenesis. These findings establish NLRC5 as a novel modulator of VEGFA signaling, providing a new target for angiogenic therapy to foster tissue regeneration.

Keywords: NLRC5; STAT3; angiogenesis; endothelial cell; signal transduction.


Conflict of interest statement

Competing Interests: The authors have declared that no competing interest exists.

Figures
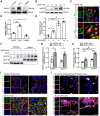
Figure 1
Figure 1
NLR family CARD domain containing 5 (NLRC5) was increased by VEGFA-165 in human umbilical vein endothelial cells (HUVECs) and translocated into the nucleus. (A) NLRC5 expression was moderately expressed in HUVECs compared to human myeloid leukemia mononuclear cells (THP-1) and human aortic smooth muscle cells (HASMCs). The protein level of NLRC5 was detected by western blot analysis. (B) HUVECs were stimulated with VEGFA-165 (50 ng/mL) for different time points. The protein level of NLRC5 was detected by western blot analysis. (C) HUVECs were treated with VEGFA-165 (50 ng/mL) for 0 and 12 h. Representative confocal microscopy images of immunofluorescence staining for NLRC5 (green), CD31 (red), 4'-6-diamidino-2 -phenylindole (DAPI, blue). Scar bar, 20 µm. (D) Quantification of A. Data are mean ± SEM, n = 3 independent experiments. One-way ANOVA with Bonferroni post-test, * P < 0.05, *** P < 0.005. (E) Quantification of B. Data are mean ± SEM, n = 4 independent experiments. One-way ANOVA with Bonferroni post-test, ** P < 0.01, # P < 0.001. (F) HUVECs were treated with VEGFA-165 (50 ng/mL) for 12 h with or without leptomycin B (100 µM) pretreated for 6 h. Nuclear and cytoplasmic fractions were extracted from HUVECs. The protein level of NLRC5 was detected by western blot analysis. (G) Quantification of NLRC5 expression in the cytoplasmic fraction. (H) Quantification of NLRC5 expression in the nuclear fraction. Data are mean ± SEM, n = 3 independent experiments. Two-way ANOVA with Bonferroni post-test, * P < 0.05, *** P < 0.005, # P < 0.001. (I) NLRC5 was localized in the cytoplasm of vascular endothelial cells in static mouse vessels. Representative confocal microscopy images of immunofluorescence staining for NLRC5 (green), CD31 (red), Ki67 (magenta), DAPI (blue). Scar bar, 50 µm. (J) NLRC5 was localized in the nucleus of proliferative vascular endothelial cells in ischemic legs and melanoma tumors of mice. Representative confocal microscopy images of immunofluorescence staining for NLRC5 (green), CD31 (red), Ki67 (magenta), DAPI (blue). Scar bar, 50 µm.
Figure 2
Figure 2
siRNA knockdown of NLRC5 in HUVECs inhibited tube formation, migration, and proliferation and markedly decreased the phosphorylation of eNOS and AKT. (A) siRNA knockdown decreased NLRC5 protein level in HUVECs. The expression of NLRC5 was detected by western blot analysis. (B) Quantification of A. Data are mean ± SEM, n = 4 independent experiments. Unpaired Student's t-test, # P < 0.001. (C) Tube formation of NLRC5 decreased HUVECs. Scar bar, 100 µm. (D) Quantification of total tube length and branch points. Data are mean ± SEM, n = 4 each group. Unpaired Student's t-test, # P < 0.001. (E) Migration of NLRC5 decreased HUVECs. Scar bar, 100 µm. (F) Proliferation of NLRC5 decreased HUVECs, 5-ethynyl-2'-deoxyuridine (Edu, green), DAPI (blue). Bar, 100 µm. (G) Quantification of C. Data are mean ± SEM, n = 4 each group. Two-way ANOVA with Bonferroni post-test, * P < 0.05, # P < 0.001. (H) Quantification of F. Data are mean ± SEM, n = 5 each group. Unpaired Student's t-test, *** P < 0.005. (I) p-AKT, p-eNOS decreased in NLRC5 knockdown HUVECs. (J-M), Quantification of I. Data are mean ± SEM, n = 5, independent experiments. Two-way ANOVA with Bonferroni post-test, # P < 0.001.
Figure 3
Figure 3
Decreased angiogenesis of Tie2Cre-NLRC5flox/flox mice resulted in severe necrosis and fibrosis of ischemic legs. (A) The blood flow recovery in Tie2Cre-NLRC5flox/flox (CKO) and NLRC5flox/flox (Ctrl) mice. Blood flow was measured by tissue Doppler analysis. (B) The necrosis was quantified in Tie2Cre-NLRC5flox/flox mice and NLRC5flox/flox mice (28 days). (C) Quantification of A. n = 5 mice/group. Two-way ANOVA with Bonferroni post-test, ** P < 0.01, # P < 0.001. (D) Quantification of B. The average necrotic severity score. n = 5 mice/group. Unpaired Student's t-test, # P < 0.001. (E) Hematoxylin-eosin (HE) staining for necrotic cells in the cross section of ligated musculus gastrocnemius muscle (3 days). Scar bar, 50 µm. (F) Masson staining for collagen deposition in the cross section of musculus gastrocnemius muscle after femoral artery ligation (28 days). Scar bar, 100 µm. (G) Quantification of F. n = 5 mice /group, 4 scopes/mice. Data are mean ± SEM, two-way ANOVA with Bonferroni post-test, ** P < 0.01, # P < 0.001. (H) CD31-positive cells in the cross section of musculus gastrocnemius muscles after femoral artery ligation (14 days). Representative confocal microscopy images of immunofluorescence staining for CD31 (red), DAPI (blue). Scar bar, 100 µm. (I) Quantification of H. n = 4 mice/group, 3 scopes/mice. Two-way ANOVA with Bonferroni post-test, * P < 0.05, *** P < 0.005, # P < 0.001. (J) CD45-positive cells in the cross section of musculus gastrocnemius muscles after femoral artery ligation (14 days). Representative confocal microscopy images of immunofluorescence staining for CD45 (green), DAPI (blue). Scar bar, 100 µm. (K) Quantification of J. n = 5 mice/group, 3 scopes/mice. Two-way ANOVA with Bonferroni post-test, * P < 0.05.
Figure 4
Figure 4
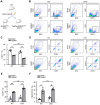
Tie2Cre-NLRC5flox/flox mice exhibited severe inflammation and decreased angiogenesis without the contribution of myeloid cells. (A) Schematic of bone marrow transplantation studies. WT mice were the donors. NLRC5flox/flox (Ctrl) mice and Tie2Cre-NLRC5flox/flox (CKO) mice were the recipients. (B) The CD31+ cells were measured by fluorescence activated cell sorter (FACS). (C) Quantification of B. n = 4 mice/group. Data are mean ± SEM, two-way ANOVA with Bonferroni post-test, ** P < 0.01, # P < 0.001. (D) The CD45+CD11b+ cells were measured by fluorescence activated cell sorter (FACS). (E-F) Quantification of D. n = 4 mice/group. Data are mean ± SEM, two-way ANOVA with Bonferroni post-test, ** P < 0.01, *** P < 0.005, # P < 0.001.
Figure 5
Figure 5
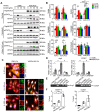
Signal transducer and activator of transcription 3 (STAT3) bound with NLRC5 in VEGFA-165 stimulated ECs. (A) Flow chart of sample preparation for RNA sequencing. (B) Heat maps of related genes based on RNA-seq. (C) Gene set enrichment analysis (GSEA) was performed using the gene in the IL-6-JAK-STAT3 pathway generated from RNA-seq. (D) Identification of STAT3 as a binding partner of NLRC5 in VEGFA-165 treated HUVECs. HUVECs were stimulated with VEGFA-165 for 0 or 12 h. The lysate was immunoprecipitated with anti-STAT3 antibody and then immunoblotted with the indicated antibodies. (E) Co-immunoprecipitation of myc-NLRC5 overexpressed HEK293T cells. The lysate was immunoprecipitated with anti-myc antibody and then immunoblotted with the indicated antibodies. The protein expression was detected by western blot analysis. (F) Co-immunoprecipitation of myc-NLRC5 in combination with Flag-STAT3 in HEK293T cells. The lysate was immunoprecipitated with anti-Flag antibody and then immunoblotted with the indicated antibodies. The protein expression was detected by western blot analysis. (G) Identification of STAT1 as a binding partner of NLRC5 in IFN-γ-treated HUVECs, but not in VEGFA-165-treated HUVECs. HUVECs were stimulated with IFN-γ and VEGFA-165 for 12 h. The lysate was immunoprecipitated with anti-STAT1 antibody and then immunoblotted with the indicated antibodies. (H) Co-immunoprecipitation of myc-NLRC5 overexpressed HEK293T cells. The lysate was immunoprecipitated with anti-myc antibody and then immunoblotted with the indicated antibodies. The protein level was detected by western blot analysis.
Figure 6
Figure 6
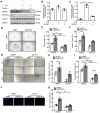
The integrity of the DD+NACHT domain of NLRC5 was critical for NLRC5 transcriptional activity. (A) Flag-STAT3 was co-transfected with myc-DD, myc-NACHT, myc-DD+NACHT, myc-ΔDD, and myc-NLRC5 full length plasmids, respectively, in HEK293T cells. The lysates were immunoprecipitated and then immunoblotted with antibodies against the indicated proteins. (B) Representative confocal microscopy images of immunofluorescence staining for myc (green), Flag (red), DAPI (blue). Scar bar, 20 µm. (C) myc-NLRC5 was transfected in HEK293T cells and the efficiency was detected by western blot analysis. (D) Endogenous NLRC5 was knockdown by siRNA. (E) Quantification of C. Data are mean ± SEM, n = 3 independent experiments. One-way ANOVA with Bonferroni post-test, ** P < 0.01. (F) Quantification of D. Data are mean ± SEM, n = 3 independent experiments. Unpaired Student's t-test, *** P < 0.005. (G) Sis induce element (SIE) promoter luciferase reporter plasmid was respectively transfected with myc-NLRC5, myc-DD, or myc-ΔDD into HEK293T cells for 24 h. Cells were treated with PBS or IL-6 (20 ng/mL) for another 18 h. Promoter activities were normalized to renilla luciferase. The results were expressed as relative luciferase activity. Data are mean ± SEM, n = 3 independent experiments. One-way ANOVA with Bonferroni post-test, ** P < 0.01, *** P < 0.005. (H) After transfection, the cells were stimulated with IL-6 (20 ng/mL) for 18 h. Promoter activities were normalized to renilla luciferase. Data are mean ± SEM, n = 3 independent experiments. Two-way ANOVA with Bonferroni post-test, # P < 0.001.
Figure 7
Figure 7
Overexpressed NLRC5 prolonged the accumulation of STAT3 in the nucleus after interleukin 6 (IL-6) stimulation in HUVECs. (A) HUVECs were transfected with AdNC or AdNLRC5 for 48 h and then treated with IL-6 (20 ng/mL) for the indicated time points over 60 min. Nuclear and cytoplasmic fractions were extracted from HUVECs. The protein expression of Flag-NLRC5, t-STAT3, p-STAT3(Tyr705), Lamin B, and GAPDH were measured by western blot analysis. (B) Quantification of A. Data are mean ± SEM. n = 4 independent experiments, two-way ANOVA with Bonferroni post-test, * P < 0.05, ** P < 0.01, *** P < 0.005, # P < 0.001. (C) Representative confocal microscopy images of immunofluorescence staining for Flag-NLRC5 (green), STAT3 (red) and DAPI (blue). Scar bar, 20 µm. (D) NLRC5 overexpression increased mRNA expression of angiopoietin-2 and cyclin D1 in IL-6 induced HUVECs, and the enhancement was inhibited by the STAT3 specific inhibitor S3I-201. Data are mean ± SEM, n = 3 independent experiments. Two-way ANOVA with Bonferroni post-test, * P < 0.05, # P < 0.001. (E-F) ChIP assay for the promoter of angiopoietin-2 and cyclin D1. HUVECs were transfected with AdNLRC5 and the sonicated nuclear lysates were incubated with anti-STAT3 or anti-Flag antibodies. The purified DNA was amplificated by qPCR and confirmed by southern blot. Data are mean ± SEM, n = 3 independent experiments. Two-way ANOVA with Bonferroni post-test, * P < 0.05, ** P < 0.01, *** P < 0.005.
Figure 8
Figure 8
STAT3 specific inhibitor S3I-201 impaired the induced enhancement of EC tube formation, migration, and proliferation mediated by NLRC5 overexpression. (A) The efficiency of S3I-201 to bind with STAT3 and to decrease the phosphorylation of STAT3. (B-C) Quantification of A. Data are mean ± SEM, n = 3 independent experiments. Two-way ANOVA with Bonferroni post-test, * P < 0.05. (D) S3I-201 inhibited the tube formation in NLRC5 overexpressed in HUVECs. Scar bar, 100 µm. (E-F) Quantification of D. Data are mean ± SEM, n = 3 independent experiments. Two-way ANOVA with Bonferroni post-test, * P < 0.05, ** P < 0.01, *** P < 0.005. (G) S3I-201 inhibited the migration in NLRC5 overexpressed in HUVECs. Scar bar, 100 µm. (H-I) Quantification of G. Data are mean ± SEM, n = 3 independent experiments. Two-way ANOVA with Bonferroni post-test, * P < 0.05, *** P < 0.005. (J) S3I-201 inhibited the proliferation in NLRC5 overexpressed in HUVECs. 5-ethynyl-2'-deoxyuridine (Edu, red), DAPI (blue). Scar bar, 100 µm. (K) Quantification of J. Data are mean ± SEM, n = 4 independent experiments. Two-way ANOVA with Bonferroni post-test, ** P < 0.01.

Similar articles

Cited by

References

    1. Kaczmarek A, Vandenabeele P, Krysko DV. Necroptosis: the release of damage-associated molecular patterns and its physiological relevance. Immunity. 2013;38:209–23. - PubMed
    1. Akira S, Hemmi H. Recognition of pathogen-associated molecular patterns by TLR family. Immunol Lett. 2003;85:85–95. - PubMed
    1. Sadeghi K, Wessner B, Laggner U, Ploder M, Tamandl D, Friedl J. et al. Vitamin D3 down-regulates monocyte TLR expression and triggers hyporesponsiveness to pathogen-associated molecular patterns. Eur J Immunol. 2006;36:361–70. - PubMed
    1. Takeuchi O, Akira S. Pattern recognition receptors and inflammation. Cell. 2010;140:805–20. - PubMed
    1. Grote K, Schütt H, Schieffer B. Toll-like receptors in angiogenesis. ScientificWorldJournal. 2011;11:981–91. - PMC - PubMed

Publication types