. 2021 Feb 19;11(9):4103-4121.
doi: 10.7150/thno.53418. eCollection 2021.

MicroRNA-146a switches microglial phenotypes to resist the pathological processes and cognitive degradation of Alzheimer's disease

Affiliations

MicroRNA-146a switches microglial phenotypes to resist the pathological processes and cognitive degradation of Alzheimer's disease

Chunmei Liang et al. Theranostics. .

Abstract

Alzheimer's disease (AD) is the most prevalent neurodegenerative disease and currently has no effective treatment. Mainstream research on the mechanisms and therapeutic targets of AD is focused on the two most important hallmarks, Aβ and Tau, but the results from clinical studies are not encouraging. Abnormal microglial polarization is a clear typical pathological feature in the progression of AD. Microglia can be neuroprotective by degrading and removing Aβ and Tau. However, under AD conditions, microglia transform into a pro-inflammatory phenotype that decreases the phagocytic activity of microglia, damages neurons and promotes the pathology of AD. We previously reported that a miR-146a polymorphism is associated with sporadic AD risk, and the nasal administration of miR-146a mimics reduced cognitive impairment and the main pathological features of AD. However, it is not clear by what mechanism miR-146a resists the pathological process of AD. In this study, we discovered that microglia-specific miR-146a overexpression reduced cognitive deficits in learning and memory, attenuated neuroinflammation, reduced Aβ levels, ameliorated plaque-associated neuritic pathology, and prevented neuronal loss in APP/PS1 transgenic mice. In addition, we found that miR-146a switched the microglial phenotype, reduced pro-inflammatory cytokines and enhanced phagocytic function to protect neurons in vitro and in vivo. Moreover, transcriptional analysis confirmed that miR-146a opposed the pathological process of AD mainly through neuroinflammation-related pathways. In summary, our results provide sufficient evidence for the mechanism by which miR-146a opposes AD and strengthen the conclusion that miR-146a is a promising target for AD and other microglia-related diseases.

Keywords: Alzheimer's disease; microRNA-146a; microglial polarization, neuroinfammation, phagocytic activity..


Conflict of interest statement

Competing Interests: The authors have declared that no competing interest exists.

Figures
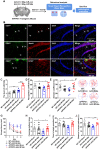
Figure 1
Figure 1
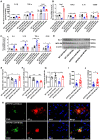
Microglia-specific miR-146a overexpression improved cognitive deficits in learning and memory in APP/PS1 Tg mice. A: Workflow for mouse behavioural analysis. B: Representative images of Iba1 (red), NeuN (red), and GFAP (red) surrounding microglia (green) and DAPI (blue) in the hippocampus of APP/PS1-AAV-Mcon mice and APP/PS1-AAV-M146a mice. Objective magnification: 20X, scale bar: 200 μm. C: qRT-PCR quantification of miR-146a-5p expression in microglia of each group (n=6). Statistical analysis was performed using one-way ANOVA followed by post hoc Tukey's test for multiple comparisons. D-E: Quantification of the recognition coefficient (D) and division coefficient (E) in the novel object recognition test of APP/PS1-AAV-M146a mice and APP/PS1-AAV-Mcon mice. One-way ANOVA with Tukey's multiple comparisons test. F: Motion tracking of mice in each group. G: The escape latencies of each group were tested in the Morris water maze for 5 consecutive days. Statistical analysis was performed using two-way ANOVA followed by post hoc Tukey's test for multiple comparisons (Interaction: Time*Treatment, P = 0.6357, no significant effect of two factors). H-J: Probe trials were performed at day 6, and the number of times crossing the platform site (H), the time spent in the target quadrant (I), and the swimming distance in the target quadrant (J) are shown. Statistical analysis was performed using one-way ANOVA followed by post hoc Tukey's test for multiple comparisons (H-J). For each group, n = 8. Data are the means ± S.E.M. *P<0.05, **P<0.01, ***P<0.005, and ****P<0.001.
Figure 2
Figure 2
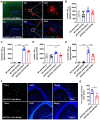
Microglia-specific miR-146a overexpression attenuated neuroinflammation and microglial polarization in APP/PS1 mice. A: The levels of cytokines (IL-6, IL-1β, and TNF-α) were analysed by ELISA with cerebral samples from each group (n=6). Statistical analysis was performed using two-way ANOVA followed by post hoc Tukey's test for multiple comparisons. B-C: Quantification of M2 phenotype microglial markers (Arg1, TGF-β, IL10 and CD206) and M1 phenotype microglia-secreted pro-inflammatory factors (IL-1β, IL-6, TNFα and CD16) in APP/PS1 AAV-M146a mice and APP/PS1-AAV-Mcon mice (n=6). Statistical analysis was performed using two-way ANOVA followed by post hoc Tukey's test for multiple comparisons. D: Total protein was extracted from cerebral tissue and separated by SDS-PAGE, and immunoblotting was performed with anti-Iba1, anti-MFG-E8 and anti-actin antibodies. E-F: Densitometry analysis was performed to quantify Iba1 and MFG-E8 levels in each sample, followed by normalization to actin loading control. Statistical analysis was performed using one-way ANOVA followed by post hoc Tukey's test for multiple comparisons. G: The mRNA levels of MFG-E8 in microglia was analysed by qRT-PCR of each group (n=6). Statistical analysis was performed using two-way ANOVA followed by post hoc Tukey's test for multiple comparisons. H: Representative images of CD68-immunolabelled activated microglia (green) surrounding plaques co-labelled for Aβ42 (red) in the hippocampus of AD mice and AD miR-146a mice. I: The area of CD68 was quantified in the hippocampus of APP/PS1-AAV-M146a mice and APP/PS1-AAV-Mcon mice. J: The area ratio of CD68/Aβ was quantified in the hippocampus of APP/PS1-AAV-M146a mice and APP/PS1-AAV-Mcon mice. Two-tailed unpaired t test with Mann-Whitney test were performed for I and J. Objective magnification: 20X, zoom: X6, scale bar: 20 μm. Data are the means ± S.E.M. and were analysed by one-way ANOVA with Tukey's test. *P<0.05, **P<0.01, ***P<0.005, and ****P<0.001; ns: no significance.
Figure 3
Figure 3
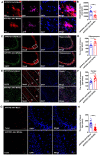
Microglia-specific miR-146a overexpression reduced Aβ levels and amyloid plaques in the APP/PS1 mouse model. A: Representative images of total Aβ42 deposition levels in the hippocampus of 11-month-old mice with Aβ42 (red) staining. Scale bar: 1000 μm. B-E: The expression levels of soluble or insoluble Aβ40 and soluble or insoluble Aβ42 in each group were detected by ELISA (n=6). Statistical analysis was performed using one-way ANOVA followed by post hoc Tukey's test for multiple comparisons. F: Representative images of amyloid plaque staining with Thios (green) and DAPI-immunolabelled nuclei in APP/PS1-AAV-M146a mice and APP/PS1-AAV-Mcon mice. Objective magnification: 4X, scale bar: 1000 μm. G: The number of Thios staining was quantified in APP/PS1-AAV-M146a mice and APP/PS1-AAV-Mcon mice. Data are shown as the means ± S.E.M. and were analysed by two-tailed unpaired t test with the Mann-Whitney test. *P<0.05, **P<0.01, ***P<0.005, and ****P<0.001.
Figure 4
Figure 4
Microglia-specific miR-146a overexpression reduced plaque-associated neuritic pathology and neuronal loss in an AD mouse model. A: Representative images of APP-immunolabelled dystrophic neurites (purple) surrounding plaques co-labelled for Aβ42 (red) in the hippocampus of APP/PS1-AAV-M146a mice and APP/PS1-AAV-Mcon mice. Scale bar: 20 μm. B: The total area of dystrophic neurites was quantified in the hippocampus of APP/PS1-AAV-M146a mice and APP/PS1-AAV-Mcon mice. C: Representative images of NeuN-immunolabelled neurons (red) surrounding microglia and DAPI-immunolabelled nuclei in the hippocampus of APP/PS1-AAV-M146a mice and APP/PS1-AAV-Mcon mice. Scale bar: 50 μm. D: Quantification of neurons in the hippocampus of APP/PS1-AAV-M146a mice and APP/PS1-AAV-Mcon mice using ImageJ software. E: Representative images of NeuN-immunolabelled neurons (red) surrounding microglia and DAPI-immunolabelled nuclei in the cortex of APP/PS1-AAV-M146a mice and APP/PS1-AAV-Mcon mice. Scale bar: 20 μm. F: Quantification of neurons in the cortex of APP/PS1-AAV-M146a mice versus APP/PS1-AAV-Mcon mice using ImageJ. G: Representative images of neural apoptosis with TUNEL staining and DAPI-immunolabelled nuclei in the hippocampus of APP/PS1-AAV-M146a mice and APP/PS1-AAV-Mcon mice. Objective magnification: 40X, scale bar: 50 μm. H: Quantification of apoptotic cells in the hippocampus of APP/PS1-AAV-M146a mice and APP/PS1-AAV-Mcon mice using ImageJ software. Data are shown as the means ± S.E.M. and were analysed by two-tailed unpaired t test with the Mann-Whitney test for B, D, F and H. *P<0.05, **P<0.01, ***P<0.005, and ****P<0.001.
Figure 5
Figure 5
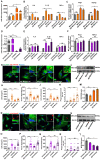
Increased miR-146a triggered microglial phenotype switching and enhanced phagocytosis in Aβ42-treated cells. HMC3 cells were transfected with 10 μM miR-146a mimics/100 μM inhibitor and given 5 μM Aβ42 for 12 h. A: The level of miR-146a was increased by overexpressing exogenous miR-146a-5p. Statistical analysis was performed using one-way ANOVA followed by post hoc Tukey's test for multiple comparisons. B: The mRNA levels of pro-inflammatory factors (IL-6, IL-1β and TNF-α) secreted by M1 phenotype microglia were detected by qRT-PCR. Statistical analysis was performed using two-way ANOVA followed by post hoc Tukey's test for multiple comparisons. C: Quantification of the mRNA levels of M2 phenotype microglia markers (Arg1 and TGF-β) was performed by qRT-PCR. Statistical analysis was performed using two-way ANOVA followed by post hoc Tukey's test for multiple comparisons. D: The level of miR-146a decreased upon the expression of exogenous miR-146a-5p inhibitor. Statistical analysis was performed using one-way ANOVA followed by post hoc Tukey's test for multiple comparisons. E: The mRNA levels of IL-6, IL-1β and TNF-α were detected by qRT-PCR. F: Quantification of the mRNA levels of Arg1 and TGF-β was performed by qRT-PCR. Two-way ANOVA with Tukey's multiple comparisons test was used for E and F. ns: no significance. G and N: HMC3 cells were treated as described above and stained with α-tubulin (green) to visualize the cytoskeleton. After a 3 h incubation, phagocytosed microspheres appeared red, and DAPI-stained nuclei appeared blue. Objective magnification: 20X, zoom: X4, scale bar: 30 μm. H-K and O-R: The cell area, 'Feret diameter, circumference and phagocytosis of fluorescent beads were measured by ImageJ in the miR-146a mimic group (H-K) and inhibitor group (O-R). Statistical analysis was performed using one-way ANOVA followed by post hoc Tukey's test for multiple comparisons. L and S: The level of MFG-E8 measured by Western blot analysis in the miR-146a mimic group (L) and inhibitor group (S). M and T: Quantification of the MFG-E8 levels in the miR-146a mimic group (M) and inhibitor group (T) was performed with ImageJ. Statistical analysis was performed using one-way ANOVA followed by post hoc Tukey's test for multiple comparisons. The data shown are the means ± S.E.M. from three independent experiments. *P<0.05, ** P<0.01, *** P<0.005, and **** P< 0.001.
Figure 6
Figure 6
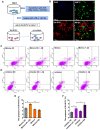
Increased miR-146a in microglia prevented neuronal apoptosis in Aβ42-treated cells. A: HMC3 cells were transfected with 10 μM miR-146a mimics/100 μM inhibitor and treated with 5 μM Aβ42 for 12 h. SH-SY5Y cells were then added to the HMC3 cells at a 1:1 ratio, and apoptosis was detected by flow cytometry after 24 h. B: HMC3 cells were infected with GFP-adenovirus, and SH-SY5Y cells were stained with CellTrace Far Red. C-D: The apoptosis of SH-SY5Y cells was analysed by flow cytometry in the miR-146a mimics group (C) and inhibitor group (D). E-F: Aβ42 treatment of HMC3 cells increased the apoptosis of SH-SY5Y cells, an effect that was reduced by miR-146a mimics (E) but increased in the presence of miR-146a inhibitor (F). Statistical analysis was performed using one-way ANOVA followed by post hoc Tukey's test for multiple comparisons. Data are shown as the means ± S.E.M from four independent experiments. *P<0.05, ** P<0.01, *** P<0.005, and **** P<0.001.
Figure 7
Figure 7
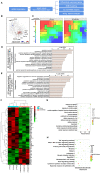
Neuroinflammatory gene signatures were identified by transcriptional analysis in the brains of the microglial miR-146a-overexpressing AD mouse model. A: Workflow for neuroinflammatory gene analysis. B: Gene network analysis of regulated genes in the APP/PS1-AAV-Mcon group and APP/PS1-AAV-M146a group identified by transcriptional analysis. C: SOM clustering of the APP/PS1-AAV-Mcon group and APP/PS1-AAV-M146a group with the definition of gene sequences. D-E: Gene signatures in APP/PS1-AAV-Mcon mice defined by cluster (i) and in APP/PS1-AAV-M146a mice defined by cluster (ii). Fisher's exact test followed by a correction for multiple testing. F: Heatmap of differential genes. The differentially expressed genes between the APP/PS1-AAV-Mcon group and the APP/PS1-AAV-M146a group were obtained by transcriptional analysis. G: The differentially expressed genes were analysed by GO gene ontology enrichment to obtain the biological processes. H: The pathway enrichment analysis of differential genes was performed using the KEGG database (https://www.kegg.jp/).

Similar articles

Cited by

References

    1. Solito E, Sastre M. Microglia function in Alzheimer's disease. Front Pharmacol. 2012;3:14. - PMC - PubMed
    1. Bar E, Barak B. Microglia roles in synaptic plasticity and myelination in homeostatic conditions and neurodevelopmental disorders. Glia. 2019;67:2125–41. - PubMed
    1. Stewart CR, Stuart LM, Wilkinson K, van Gils JM, Deng J, Halle A. et al. CD36 ligands promote sterile inflammation through assembly of a Toll-like receptor 4 and 6 heterodimer. Nat Immunol. 2010;11:155–61. - PMC - PubMed
    1. Liu HC, Zheng MH, Du YL, Wang L, Kuang F, Qin HY. et al. N9 microglial cells polarized by LPS and IL4 show differential responses to secondary environmental stimuli. Cell Immunol. 2012;278:84–90. - PubMed
    1. Wirz KT, Bossers K, Stargardt A, Kamphuis W, Swaab DF, Hol EM. et al. Cortical beta amyloid protein triggers an immune response, but no synaptic changes in the APPswe/PS1dE9 Alzheimer's disease mouse model. Neurobiol Aging. 2013;34:1328–42. - PubMed

Publication types

MeSH terms