. 2021 Mar 9;20(1):51.
doi: 10.1186/s12943-021-01333-7.

CircNEIL3 regulatory loop promotes pancreatic ductal adenocarcinoma progression via miRNA sponging and A-to-I RNA-editing

Affiliations

CircNEIL3 regulatory loop promotes pancreatic ductal adenocarcinoma progression via miRNA sponging and A-to-I RNA-editing

Peng Shen et al. Mol Cancer. .

Erratum in

Abstract

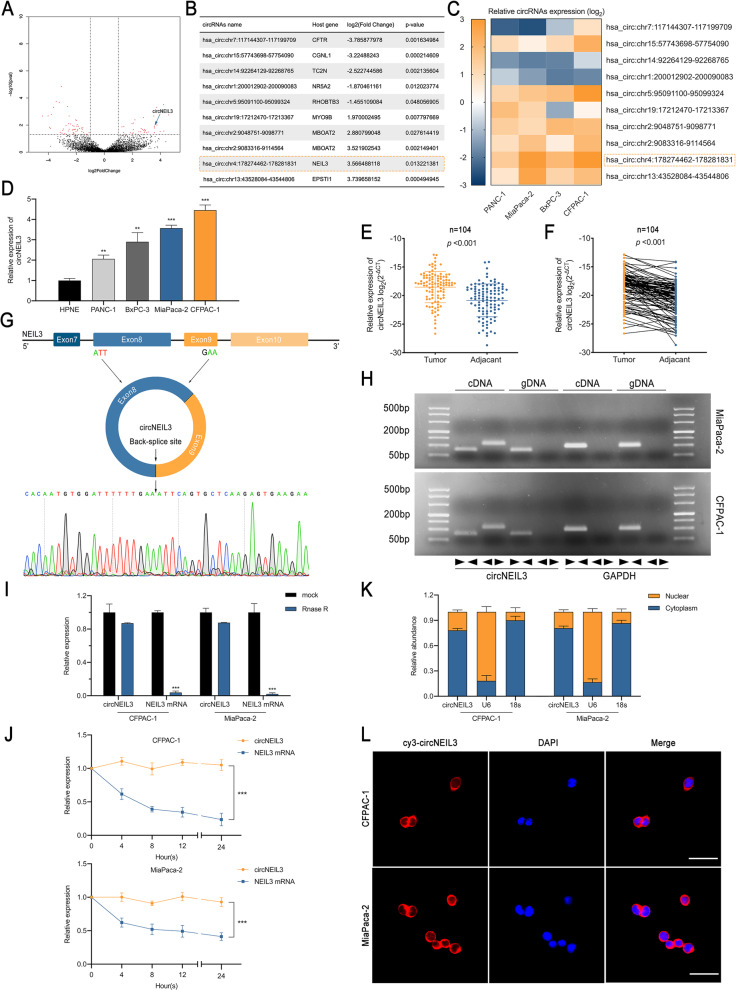
Background: A growing number of studies have focused on investigating circRNAs as crucial regulators in the progression of multiple cancer types. Nevertheless, the biological effects and underlying mechanisms of circRNAs in pancreatic ductal adenocarcinoma (PDAC) remain unclear.

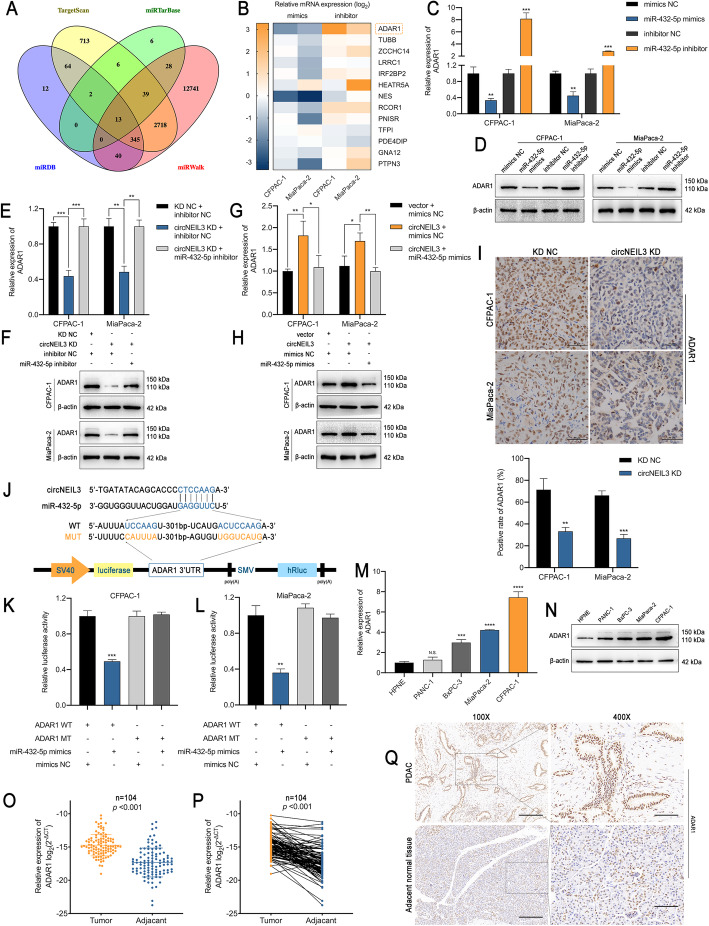
Methods: Differentially expressed circRNAs between cancerous tissue and adjacent normal tissues were identified by RNA sequencing in PDAC. Subsequently, in vitro and in vivo functional experiments were performed to investigate the functional roles of circNEIL3 in PDAC tumour growth and metastasis. Furthermore, RNA pull-down, dual-luciferase reporter assays, RNA immunoprecipitation (RIP) assays, fluorescent in situ hybridization (FISH) and Sanger sequencing assays were performed to examine the circular interaction among circNEIL3, miR-432-5p and adenosine deaminases acting on RNA 1 (ADAR1).

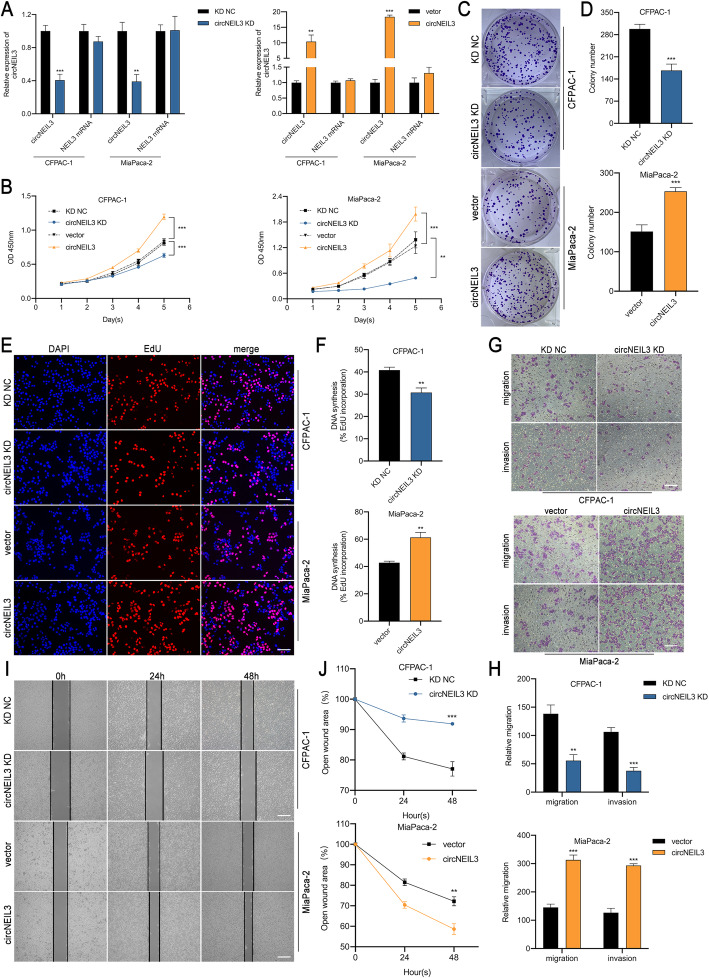
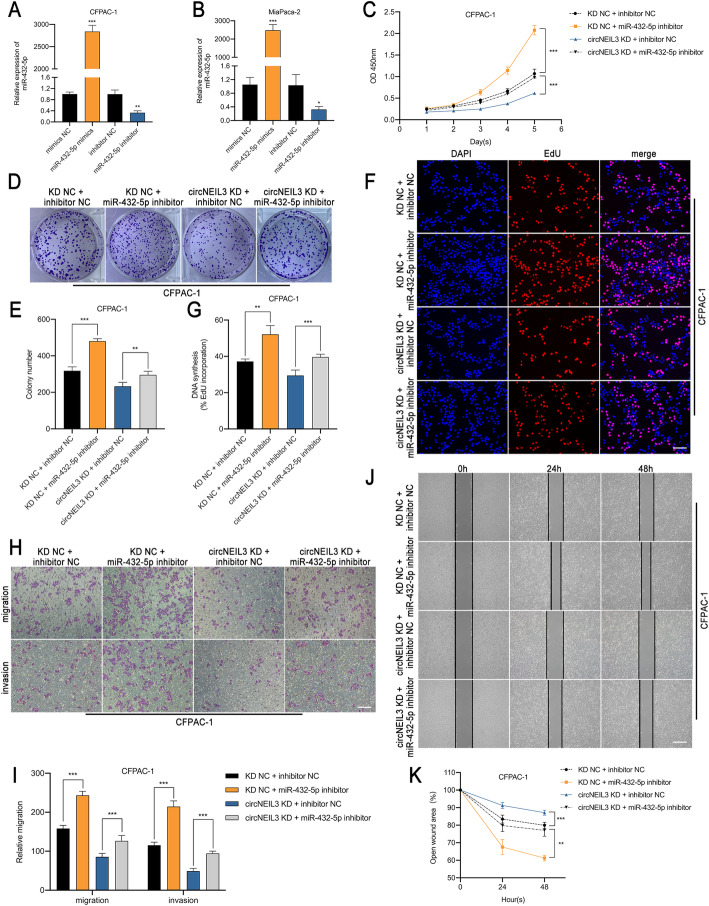
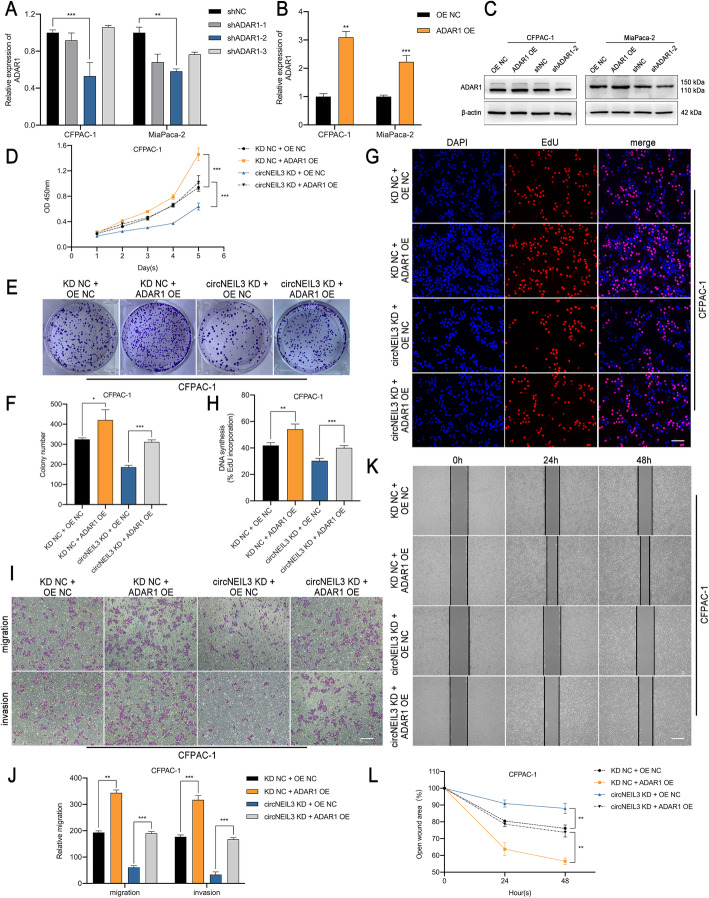
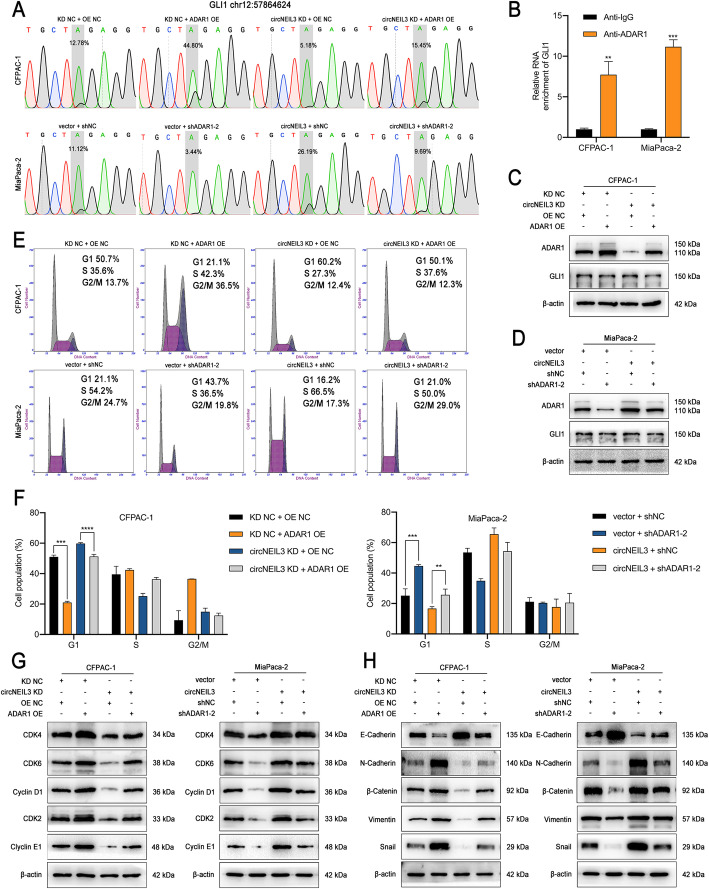
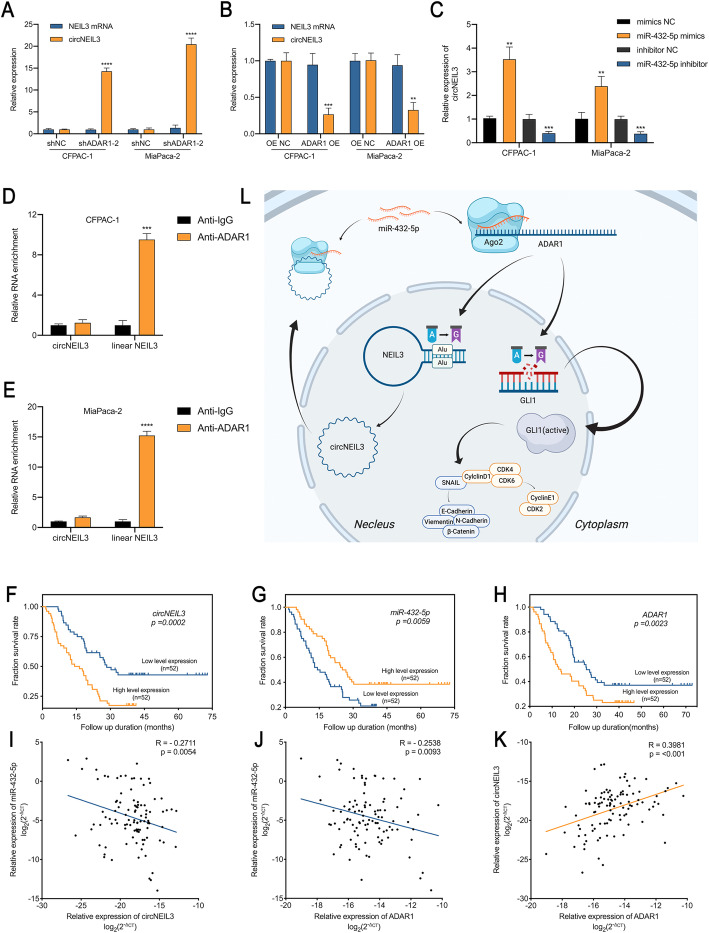
Results: CircNEIL3 was upregulated in PDAC and promoted the progression of PDAC cells both in vitro and in vivo. Mechanistically, circNEIL3 was shown to regulate the expression of ADAR1 by sponging miR-432-5p to induce RNA editing of glioma-associated oncogene 1 (GLI1), ultimately influencing cell cycle progression and promoting epithelial-to-mesenchymal transition (EMT) in PDAC cells. Moreover, we discovered that the circNEIL3/miR-432-5p/ADAR1 axis was correlated with the PDAC clinical stage and overall survival of PDAC patients, while ADAR1 may reduce the biogenesis of circNEIL3.

Conclusions: Our findings reveal that circNEIL3 facilitates the proliferation and metastasis of PDAC through the circNEIL3/miR-432-5p/ADAR1/GLI1/cell cycle and EMT axis and that its expression is regulated by ADAR1 through a negative feedback loop. Therefore, circNEIL3 may serve as a prognostic marker and a therapeutic target for PDAC.

Keywords: ADAR1; Cell cycle; EMT; GLI1; Pancreatic ductal adenocarcinoma; RNA editing; circNEIL3; miR-432-5p.


Conflict of interest statement

The authors declare that they have no competing interests.

Figures

Fig. 1
Fig. 1
Identification and characterization of circNEIL3 in PDAC cells and tissues. a. Volcano plots showing 79 upregulated and 124 downregulated circRNAs in PDAC tissue relative to matched normal tissue. b. Basic information for the ten most dysregulated circRNAs. c. RT-qPCR analysis of the ten most dysregulated circRNAs in PANC-1, MiaPaca-2, BxPC-3 and CFPAC-1 cells compared to HPNE cells. d. Relative circNEIL3 expression in cell lines was determined by RT-qPCR. e-f. Relative circNEIL3 expression in PDAC tissues (tumour) and adjacent nontumour tissues (adjacent) was detected by RT-qPCR (n = 104). g. Schematic illustration of the genomic location and back splicing of circNEIL3, with the splicing site validated by Sanger sequencing. h. PCR and agarose gel electrophoresis analysis were performed to detect the presence of circNEIL3 and NEIL3 in cDNA and gDNA samples from PDAC cells using divergent and convergent primers. i. CircNEIL3 and linear NEIL3 expression in PDAC cells was detected after RNase treatment R compared to the mock treatment. j. Actinomycin D treatment was used to evaluate the stability of circNEIL3 and NEIL3 mRNA in PDAC cells. k. Nuclear-cytoplasmic fractionation assay results indicated that circNEIL3 was primarily localized in the cytoplasm of PDAC cells. The 18S rRNA and U6 genes were used as cytoplasmic and nuclear controls, respectively. l. FISH results showed the cellular localization of circNIEL3. The circNIEL3 probe was labeled with Cy3 (red), while nuclei were stained with DAPI (blue). The samples were imaged at 1000× magnification. Scale bar = 10 μm. All data are presented as the means ± SD of three independent experiments. *p < 0.05, **p < 0.01, ***p < 0.001
Fig. 2
Fig. 2
CircNEIL3 promotes the proliferation, migration and invasion of PDAC cells in vitro. a RT-qPCR analysis of circNEIL3 and NEIL3 mRNA expression in CFPAC-1 and MiaPaca-2 cells transfected with a lentivirus and circNEIL3 plasmid. b. The growth curves of cells were evaluated by CCK-8 assays after knocking down and overexpressing circNEIL3 in CFPAC-1 and MiaPaca-2 cells. c-d. Colony formation assays were performed to evaluate cell proliferation. e-f. EdU assays of PDAC cells was performed to evaluate cell proliferation. The samples were imaged at 200× magnification. Scale bar = 50 μm. g-h. Transwell assays were performed to assess the migration and invasion abilities of PDAC cells. The samples were imaged at 100× magnification. Scale bar = 100 μm. i-j. Cell migration was assessed using a wound healing assay. The samples were imaged at 100× magnification. Scale bar = 100 μm. All data are presented as the means ± SD of three independent experiments. *p < 0.05, **p < 0.01, ***p < 0.001
Fig. 3
Fig. 3
CircNEIL3 facilitates the tumorigenesis and metastasis of PDAC cells in vivo. a. Representative images of subcutaneous xenograft tumours (n = 10 for each group). b. Growth curves of tumour volumes, which were measured every five days. c. Tumour weights were analyzed. d. HE and IHC staining of xenograft tumours. The protein levels of Ki67 were analyzed based on IHC staining. The samples were imaged at 400× magnification. Scale bar = 50 μm. e. Representative images and analysis of luminescence intensity in tail vein-injected mouse models (n = 6 for each group). f. Representative images and HE staining of metastatic tumours in the lungs and livers of mice. The HE staining samples were imaged at 100× magnification. Scale bar = 100 μm. g. The number of lung and liver metastatic tumours were determined. All data are presented as the means ± SD. *p < 0.05, **p < 0.01, ***p < 0.001
Fig. 4
Fig. 4
CircNEIL3 serves as a sponge for miR-432-5p. a. Venn diagram showing the overlap of the target miRNAs of circNEIL3 predicted by miRanda, TargetScan and RNAhybrid. b. The efficiency of the circNEIL3 probe in PDAC cells was validated using RT-qPCR after the RNA pull-down assay. A random sequence NC probe served as a negative control. c. The relative levels of 11 miRNA candidates in CFPAC-1 and MiaPaca-2 lysates were detected by RT-qPCR. d. Biotinylated miRNA pull-down in PDAC cells, and RT-qPCR results showing circNEIL3 expression levels. A random sequence NC probe served as a negative control. e. A schematic of the wild-type (WT) and mutant (MUT) circNEIL3 luciferase reporter vectors. f. The luciferase activities of the circNEIL3 luciferase reporter vector (WT or MUT) in CFPAC-1 and MiaPaca-2 cells transfected with miR-432-5p mimics or mimic NC. g. Anti-Ago2 RIP was performed using PDAC cells followed by RT-qPCR to detect circNEIL3 and miR-432-5p. h. The colocalization of circNIEL3 and miR-432-5p in PDAC cells was detected using a FISH assay. The circNIEL3 probe was labeled with Cy3 (red), miR-432-5p probes were labeled with FAM (green), and nuclei were stained with DAPI (blue). The samples were imaged at 1000× magnification. Scale bar = 10 μm. i. RT-qPCR analysis of the relative expression levels of miR-432-5p in pancreatic epithelial cells (HPNE) and PDAC cell lines. j-k. The relative expression of miR-432-5p was detected in 104 paired PDAC tissues and adjacent normal tissues by RT-qPCR. l. FISH results showing the colocalization of circNIEL3 and miR-432-5p in PDAC and adjacent normal tissues from patients. The samples were imaged at 400× magnification. Scale bar = 25 μm. m. The relative expression of miR-432-5p in cells was detected by RT-qPCR after transfection with indicated vectors. All data are presented as the means ± SD of three independent experiments. *p < 0.05, **p < 0.01, ***p < 0.001
Fig. 5
Fig. 5
MiR-432-5p reverses the oncogenic effects of circNEIL3 in CFPAC-1 cells. a-b. The expression of miR-432-5p in CFPAC-1 and MiaPaca-2 cells transfected with the miR-432-5p mimics, inhibitor and corresponding NC was detected by RT-qPCR. c-k. CFPAC-1 cells were divided into four groups (circNEIL3 KD NC + miR-432-5p inhibitor NC, KD NC + miR-432-5p inhibitor, circNEIL3 KD + inhibitor NC and circNEIL3 KD + miR-432-5p inhibitor). The proliferation, migration and invasion ability of CFPAC-1 was analyzed through CCK-8, colony formation, EdU, transwell and wound healing assays. The EdU samples were imaged at 200× magnification. Scale bar = 50 μm. The transwell and wound healing images taken at 100× magnification. Scale bar = 100 μm. All data are presented as the means ± SD of three independent experiments. *p < 0.05, **p < 0.01, ***p < 0.001, ****p < 0.0001
Fig. 6
Fig. 6
ADAR1 is a direct target of miR-432-5p and is indirectly regulated by circNEIL3 a. Venn diagram showing 13 genes that are putative miR-432-5p targets predicted by four algorithms (Targetscan, miRTarBase, miRDB and miRWalk). b. A heat map was used to visualize the expression of the predicted target genes in CFPAC-1 and MiaPaca-2 cells transfected with the miR-432-5p mimics, inhibitor and corresponding NC. c-d. ADAR1 expression in CFPAC-1 and MiaPaca-2 cells was analyzed by RT-qPCR and western blot analyses after transfection with the miR-432-5p mimics or inhibitor. e-h. ADAR1 expression was analyzed by RT-qPCR and western blot analyses. CFPAC-1 and MiaPaca-2 cells were transfected with the miR-432-5p mimic or cotransfected with the indicated circNEIL3 vectors. i. IHC staining of xenograft tumours. The protein levels of ADAR1 were analyzed based on IHC staining. The samples were imaged at 400× magnification. Scale bar = 50 μm. j. Schematic of the ADAR1 3’UTR wild-type (WT) and mutant (MUT) luciferase reporter vectors. k-l. The relative luciferase activities were analyzed in CFPAC-1 and MiaPaca-2 cells cotransfected with the miR-432-5p mimics or mimics NC and the ADAR1 3’UTR wild-type (WT) or mutant (MUT) luciferase reporter vectors. m-n. RT-qPCR and western blot analyses of the relative expression levels of ADAR1 in HPNE, PANC-1, BxPC-3, MiaPaca-2 and CFPAC-1. o-p. RT-qPCR analysis of ADAR1 expression in PDAC tissues (n = 104) paired with adjacent normal tissues (n = 104). q. IHC staining of ADAR1 of PDAC and adjacent normal tissues from patients. The samples were imaged at 100× and 400× magnification. Scale bar = 100 and 25 μm. All data are presented as the means ± SD of three independent experiments. n.s., no significance; *p < 0.05, **p < 0.01, ***p < 0.001
Fig. 7
Fig. 7
ADAR1 overexpression reverses the suppression induced by circNEIL3 downregulation a-c. The transfection efficiency of the ADAR1 shRNA and overexpression lentivirus in CFPAC-1 and MiaPaca-2 cells was verified by RT-qPCR and western blot analyses. d-l. CCK-8, colony formation, EdU, transwell and wound healing assay results demonstrated that transfection with the ADAR1 overexpression lentivirus increased the proliferation, migration, and invasion abilities of CFPAC-1 cells, which were reduced after cotransfection with the circNEIL3 KD lentivirus. The EdU samples were imaged at 200× magnification. Scale bar = 50 μm. The transwell and hound healing samples were imaged at 100× magnification. Scale bar = 100 μm. All data are presented as the means ± SD of three independent experiments. *p < 0.05, **p < 0.01, ***p < 0.001
Fig. 8
Fig. 8
ADAR1 enhances GLI1 RNA editing and functions via the cell cycle and EMT pathway a. Representative Sanger sequencing chromatograms for GLI1 in the indicated cells. The gray box highlights the double A/G peak, labeled with the percentage of edited transcripts assessed as the edited allele burden (G/(G + A) %). b. RIP analyses for GLI1 in CFPAC-1 and MiaPaca-2 cells using an ADAR1 antibody. c-d. Western blot results revealed the expression of ADAR1 and GLI1 in cells transfected with the indicated shRNA vector. e-f. The cell cycle progression was analyzed by flow cytometry after cells were transfected with the indicated plasmids. g. The relative expression of cyclin D1 and downstream cell cycle-related molecules at the protein level in cells transfected with the indicated vectors and shRNAs was determined by western blot analysis. h. The expression of EMT protein markers in the indicated cells was detected by western blot analysis. All data are presented as the means ± SD of three independent experiments. *p < 0.05, **p < 0.01, ***p < 0.001
Fig. 9
Fig. 9
An Alu-dependent feedback loop involving circNEIL3/miR-432-5p/ADAR1 is correlated with the prognosis of PDAC patients. a-b. The expression levels of circNEIL3 and NEIL3 mRNA in CFPAC-1 and MiaPaca-2 cells transfected with indicated vectors or shRNA were determined by RT-qPCR. c. The level of circNEIL3 expression was analyzed by RT-qPCR. CFPAC-1 and MiaPaca-2 cells were transfected with the miR-432-5p mimics or inhibitor. d-e. RIP assays using an ADAR1 antibody were performed to capture circNEIL3 or NEIL3 mRNA. f-h. Kaplan-Meier survival curves showed the OS of PDAC patients with low vs. high circNEIL3, miR-432-5p or ADAR1 expression. The cutoff value was the median expression of these genes. i-k. Correlation analysis between circNEIL3, miR-432-5p and ADAR1 expression analyzed by RT-qPCR in PDAC tissues (n = 104). l. Schematic diagram illustrating the mechanism by which circNEIL3 promotes PDAC proliferation and metastasis through the circNEIL3/miR-432-5p/ADAR1/GLI1/cell cycle & EMT axis and is regulated by ADAR1 through a negative feedback loop. All data are presented as the means ± SD of three independent experiments. *p < 0.05, **p < 0.01, ***p < 0.001

Similar articles

Cited by

References

    1. Siegel RL, Miller KD, Jemal A. Cancer statistics, 2020. CA Cancer J Clin. 2020;70:7–30. - PubMed
    1. Cives M, Strosberg JR. Gastroenteropancreatic neuroendocrine Tumours. CA Cancer J Clin. 2018;68:471–487. doi: 10.3322/caac.21493. - DOI - PubMed
    1. Mizrahi JD, Surana R, Valle JW, Shroff RT. Pancreatic cancer. Lancet. 2020;395:2008–2020. doi: 10.1016/S0140-6736(20)30974-0. - DOI - PubMed
    1. Vo JN, Cieslik M, Zhang Y, Shukla S, Xiao L, Zhang Y, et al. The landscape of circular RNA in cancer. Cell. 2019;176:869–881. doi: 10.1016/j.cell.2018.12.021. - DOI - PMC - PubMed
    1. Chen LL. The expanding regulatory mechanisms and cellular functions of circular RNAs. Nat Rev Mol Cell Biol. 2020;21:475–490. doi: 10.1038/s41580-020-0243-y. - DOI - PubMed

Publication types

MeSH terms

LinkOut - more resources