

Learning from HIV-1 to predict the immunogenicity of T cell epitopes in SARS-CoV-2
- PMID: 33748696
- PMCID: PMC7956900
- DOI: 10.1016/j.isci.2021.102311
Learning from HIV-1 to predict the immunogenicity of T cell epitopes in SARS-CoV-2
Abstract
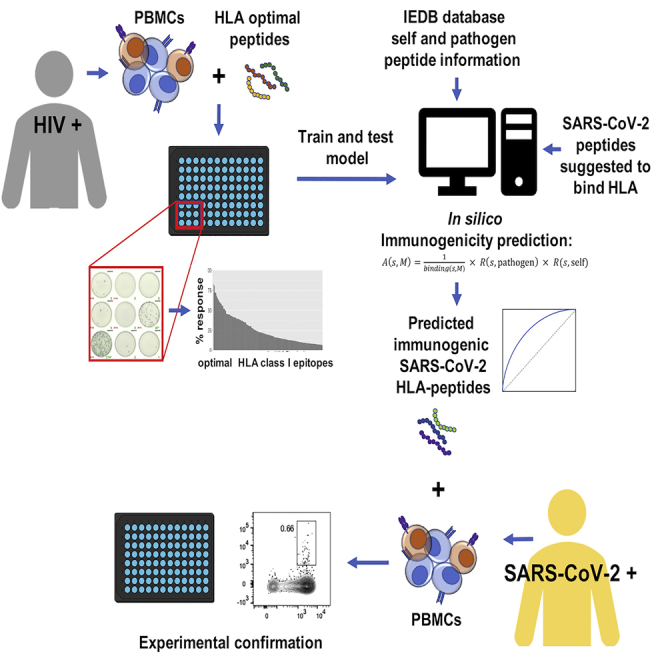
We describe a physics-based learning model for predicting the immunogenicity of cytotoxic T lymphocyte (CTL) epitopes derived from diverse pathogens including SARS-CoV-2. The model was trained and optimized on the relative immunodominance of CTL epitopes in human immunodeficiency virus infection. Its accuracy was tested against experimental data from patients with COVID-19. Our model predicts that only some SARS-CoV-2 epitopes predicted to bind to HLA molecules are immunogenic. The immunogenic CTL epitopes across all SARS-CoV-2 proteins are predicted to provide broad population coverage, but those from the SARS-CoV-2 spike protein alone are unlikely to do so. Our model also predicts that several immunogenic SARS-CoV-2 CTL epitopes are identical to seasonal coronaviruses circulating in the population and such cross-reactive CD8+ T cells can indeed be detected in prepandemic blood donors, suggesting that some level of CTL immunity against COVID-19 may be present in some individuals before SARS-CoV-2 infection.
Keywords: Artificial Intelligence; Immune Respons; Immunology; In Silico Biology.
© 2021 The Author(s).
Conflict of interest statement
The authors declare no competing interests.
Figures

Update of
-
Predicting the Immunogenicity of T cell epitopes: From HIV to SARS-CoV-2.bioRxiv [Preprint]. 2020 May 15:2020.05.14.095885. doi: 10.1101/2020.05.14.095885. bioRxiv. 2020. Update in: iScience. 2021 Apr 23;24(4):102311. doi: 10.1016/j.isci.2021.102311. PMID: 32511339 Free PMC article. Updated. Preprint.
Similar articles
-
Predicting the Immunogenicity of T cell epitopes: From HIV to SARS-CoV-2.bioRxiv [Preprint]. 2020 May 15:2020.05.14.095885. doi: 10.1101/2020.05.14.095885. bioRxiv. 2020. Update in: iScience. 2021 Apr 23;24(4):102311. doi: 10.1016/j.isci.2021.102311. PMID: 32511339 Free PMC article. Updated. Preprint.
-
Sequence-based prediction of SARS-CoV-2 vaccine targets using a mass spectrometry-based bioinformatics predictor identifies immunogenic T cell epitopes.Genome Med. 2020 Aug 13;12(1):70. doi: 10.1186/s13073-020-00767-w. Genome Med. 2020. PMID: 32791978 Free PMC article.
-
Identification of SARS-CoV-2 Nucleocapsid and Spike T-Cell Epitopes for Assessing T-Cell Immunity.J Virol. 2021 Feb 24;95(6):e02002-20. doi: 10.1128/JVI.02002-20. Print 2021 Feb 24. J Virol. 2021. PMID: 33443088 Free PMC article.
-
COVID-19 coronavirus vaccine T cell epitope prediction analysis based on distributions of HLA class I loci (HLA-A, -B, -C) across global populations.Hum Vaccin Immunother. 2021 Apr 3;17(4):1097-1108. doi: 10.1080/21645515.2020.1823777. Epub 2020 Nov 11. Hum Vaccin Immunother. 2021. PMID: 33175614 Free PMC article.
-
Degenerate CD8 Epitopes Mapping to Structurally Constrained Regions of the Spike Protein: A T Cell-Based Way-Out From the SARS-CoV-2 Variants Storm.Front Immunol. 2021 Sep 8;12:730051. doi: 10.3389/fimmu.2021.730051. eCollection 2021. Front Immunol. 2021. PMID: 34566990 Free PMC article. Review.
Cited by
-
T-Cell Epitope Mapping of SARS-CoV-2 Reveals Coordinated IFN-γ Production and Clonal Expansion of T Cells Facilitates Recovery from COVID-19.Viruses. 2024 Jun 22;16(7):1006. doi: 10.3390/v16071006. Viruses. 2024. PMID: 39066169 Free PMC article.
-
Advanced Vaccine Design Strategies against SARS-CoV-2 and Emerging Variants.Bioengineering (Basel). 2023 Jan 22;10(2):148. doi: 10.3390/bioengineering10020148. Bioengineering (Basel). 2023. PMID: 36829642 Free PMC article. Review.
-
SARS-CoV-2 spike L452R variant evades cellular immunity and increases infectivity.Cell Host Microbe. 2021 Jul 14;29(7):1124-1136.e11. doi: 10.1016/j.chom.2021.06.006. Epub 2021 Jun 15. Cell Host Microbe. 2021. PMID: 34171266 Free PMC article.
-
The biological and clinical significance of emerging SARS-CoV-2 variants.Nat Rev Genet. 2021 Dec;22(12):757-773. doi: 10.1038/s41576-021-00408-x. Epub 2021 Sep 17. Nat Rev Genet. 2021. PMID: 34535792 Free PMC article. Review.
-
Transfer learning improves pMHC kinetic stability and immunogenicity predictions.Immunoinformatics (Amst). 2024 Mar;13:100030. doi: 10.1016/j.immuno.2023.100030. Epub 2023 Dec 21. Immunoinformatics (Amst). 2024. PMID: 38577265 Free PMC article.
References
-
- Ahmed S.F., Quadeer A.A., Morales-Jimenez D., McKay M.R. Sub-dominant principal components inform new vaccine targets for HIV Gag. Bioinformatics. 2019;35:3884–3889. - PubMed
-
- Akst J. TheScientist; 2020. COVID-19 Vaccine Frontrunners.
Grants and funding
LinkOut - more resources
Full Text Sources
Other Literature Sources
Research Materials
Miscellaneous
