. 2021 Mar 19;4(1):374.
doi: 10.1038/s42003-021-01898-5.

Cooperation between oncogenic Ras and wild-type p53 stimulates STAT non-cell autonomously to promote tumor radioresistance

Affiliations

Cooperation between oncogenic Ras and wild-type p53 stimulates STAT non-cell autonomously to promote tumor radioresistance

Yong-Li Dong et al. Commun Biol. .

Abstract

Oncogenic RAS mutations are associated with tumor resistance to radiation therapy. Cell-cell interactions in the tumor microenvironment (TME) profoundly influence therapy outcomes. However, the nature of these interactions and their role in Ras tumor radioresistance remain unclear. Here we use Drosophila oncogenic Ras tissues and human Ras cancer cell radiation models to address these questions. We discover that cellular response to genotoxic stress cooperates with oncogenic Ras to activate JAK/STAT non-cell autonomously in the TME. Specifically, p53 is heterogeneously activated in Ras tumor tissues in response to irradiation. This mosaicism allows high p53-expressing Ras clones to stimulate JAK/STAT cytokines, which activate JAK/STAT in the nearby low p53-expressing surviving Ras clones, leading to robust tumor re-establishment. Blocking any part of this cell-cell communication loop re-sensitizes Ras tumor cells to irradiation. These findings suggest that coupling STAT inhibitors to radiotherapy might improve clinical outcomes for Ras cancer patients.


Conflict of interest statement

The authors declare no competing interests.

Figures

Fig. 1
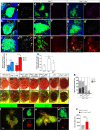
Fig. 1. Ptip−/− cooperates with oncogenic Ras to induce nonautonomous tissue overgrowth.
(ad) Mutation 3804 suppresses RasV12-mediated tumor overgrowth. (a, b) Images of third-instar larvae cephalic complexes showing GFP-marked RasV12 (a) or RasV123804 (b) clones. Images of eye imaginal discs dissected from third-instar larvae cephalic complexes and containing RasV12 or RasV12 3804 GFP-positive clones are shown in (c) and (d), respectively. Scale bars are 150 µm. (el) Side and frontal images of adult fly eyes. The nonautonomous overgrowth phenotype was categorized into three grades based on the severity of the phenotype (+: weak; ++: moderate; +++: strong). (e) and (f) represent adult eyes from wild-type animals. The adult eye tissues bearing RasV12 3804 double mutant clones showed varying grades of tissue folding (gl). (mo) Mosaic adult eyes bearing wild-type cells and mutant clones marked by a lack of pigmentation. A schematic of the mosaic adult eye is presented in (m). Wild-type cells (n, white color) contribute ~50% to the eye field, whereas the 3804 mutant clones (o) are barely detectable. (ps) Matched light and fluorescence images of adult eyes containing GFP-positive wild-type (p, q) or RasV12 3804 double mutant clones (r, s). (t) Genetic complementation test of the ptip−/− mutation using overlapping chromosomal deficiency lines. The deficiency line shown in green complements the ptip−/− mutation, while the deficiency lines marked in red fail to complement. (u, v) Sequence results showing a G > A mutation in PTIP, causing a premature stop sequence. (w) Quantification of (gl). All scale bars are 150 µm.
Fig. 2
Fig. 2. ptip−/− and oncogenic Ras cooperatively induce nonautonomous tissue overgrowth via wild-type p53.
(ai′) Representative images of dissected eye imaginal discs containing ptip−/− or RasV12 or RasV12ptip−/− double mutant clones (GFP) stained with DAPI to detect DNA or anti-phosphorylated H2AV antibodies to detect DNA damage (ac’) or anti-p53 (d-e′) or anti-dacapo (dap/p21) (fg′) or anti-phosphorylated JNK (h-i′) antibodies to detect cellular response to DNA damage. Scale bars are 20 µm. (j, k) Quantitative Polymerase Chain Reaction (qPCR) data showing expression of p53 or dap/p21 in wild type versus ptip−/− eye imaginal discs (j) or the expression of p53 in RasV12 or ptip−/− or RasV12ptip−/− eye imaginal discs (k). Expression was normalized to the transcript abundance of the housekeeping gene rp49. Error bars denote standard deviation (SD) values. P values are derived from Student’s t test analyses. (lr) Matched light and fluorescence images of adult eyes containing GFP-labeled clones. The respective clone genotypes are indicated at the top of each panel. The corresponding fluorescent images are shown below in (l′–r′). GPF-negative tissues represent wild-type tissues. Scale bars are 150 µm. (s) Quantification of the nonautonomous growth phenotype of adult eyes containing clones of the indicated genotypes: RasV12ptip−/−, RasV12ptip−/−BskDN, RasV12ptip−/−p53R155H, or RasV12ptip−/−p53RNAi. (tu″) Genetic juxtaposition of GFP-labeled RasV12 clones with RFP-labeled RasV12 clones (t-t, controls) or with RFP-labeled clones of cells coexpressing RasV12 and wild-type p53 (RasV12, p53OE) (u-u). GFP-positive RasV12 clones are surrounded by RFP/GFP double-positive RasV12 clones (t-t) or by RFP/GFP double-positive RasV12, p53OE clones (u-u). Brain cephalic complex images showing the growth of RasV12 clones when juxtaposed to RasV12 or to RasV12, p53OE clones are shown in t and u, respectively. Dotted white lines (t, t, u, u) represent tissue boundaries. Scale bars are 100 µm. (v) Quantification of eye tissue sizes from (tu). Sample size N = 10 tissues per genotype. Error bars denote standard error of the mean (SEM) values. P values are derived from Student’s t test analyses. Effect size (Cohen’s d values) for (j), (k), and (v) is greater than 0.8.
Fig. 3
Fig. 3. Wild-type p53 and oncogenic Ras cooperatively stimulate STAT cytokines to drive nonautonomous tissue overgrowth.
(ac′) Images showing upd-lacZ expression in eye imaginal discs bearing RasV12 (a, a), RasV12p53OE (b, b), and RasV12ptip−/− (c, c) clones. Anti-βgal antibodies were used in immunostaining experiments to detect LacZ. The individual LacZ channel images are shown in a–c. The dotted white lines denote clone boundaries and depict representative examples of upd overexpression (yellow arrowheads). Scale bars are 20 µm. (d, e) qPCR data showing expression of upd, upd2, and upd3 in RasV12 versus RasV12p53OE (d) or RasV12ptip−/− in the absence or presence of p53 inhibition (RasV12ptip−/−p53RNAi or RasV12ptip−/−p53R155H). Expression was normalized to the transcript abundance of rp49, a housekeeping gene. Error bars denote SD values. P values are derived from Student’s t test analyses. (fh) Representative images showing overall tissue size of dissected eye imaginal discs harboring GFP-labeled RasV12 (f) or RasV12p53OE (g) or RasV12p53OEupdRNAiupd2 (h) clones. Blue signal represents DNA (DAPI stain). Scale bar is 100 µm. (i) Quantification of tissue sizes from (fh). Sample size N = 06 tissues per genotype. Error bars denote SEM values. P values are derived from Student’s t test analyses. Effect size (d) values for (f–h) are greater than 0.8.
Fig. 4
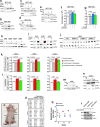
Fig. 4. Wild-type p53 and oncogenic Ras paracrine STAT activation stimulates the growth of human cancer cells.
(aj) In vitro experiments showing that media conditioned with p53-overexpressing or irradiated cancer cells stimulate cell proliferation via STAT signaling. Western blot of protein lysates prepared from MCF-10A cells expressing oncogenic HRas (RasONC) or wild-type p53 (p53OE) alone or together and blotted with anti-p53 (a) or anti-pERK (b) or anti-GAPDH (as loading control). (c) Western blots showing STAT activity in MCF-10A cells cultured in media conditioned with MCF-10A (controls) or with MCF-10A cells expressing RasONC or p53OE alone or together. (d) p53 or GAPDH western blot images from MCF-10A cells expressing oncogenic Ras or not under normal or irradiated conditions. (e) Western blot image showing STAT and GAPDH or phospho-STAT and GAPDH in cells conditioned with media conditioned with irradiated MCF-10A cells or MCF-10A cells expressing RasONC from (d). (f) Conditioned media stimulate cell growth, as determined by cell number under the indicated conditions: MCF-10A cells cultured in media conditioned with MCF-10A control cells or MCF-10A cells overexpressing p53OE or RasONC or coexpressing both. Error bars denote SD values. P values are derived from Student’s t test analyses. (g) The growth of MCF-10A cells in media conditioned with irradiated MCF-10A cells in the presence or absence of p53 overexpression is shown. Ganetespib (25 nm) treatment suppressed cell growth. Error bars denote SD values. P values are derived from Student’s t test analyses. (h) Western blots showing p53 expression in lung cancer cells transfected with p53 expression construct or not. GAPDH represents the loading control. (i, j) Western blot images showing STAT activity (pSTAT) in lung cancer cells cultured in media conditioned with unmodified cells or with cells overexpressing p53. Total STAT and GAPDH protein levels were used as loading controls. These experiments are shown in biological triplicates in (j). (k) Effect of media conditioned with p53 overexpressing lung cancer cells on cell number in the presence or absence of Ganetespib. Ganetespib (25 nm) treatment had no to minimal effect on the growth of control cells but it significantly suppressed the growth of cells growing in conditioned media. (l) Effect of media conditioned with irradiated lung cancer cells on cell number in the presence or absence of Ganetespib (25 nm). (m) Western blot images showing p53 expression in A549 cells under normal and irradiation conditions. GAPDH represents a loading control. (n) Western blot image showing total STAT and pSTAT levels in A549 cells grown in media conditioned with other A549 cells or with irradiated A549 cells. (o) Image of a nude mouse showing the size of tumor xenografts (green circles) 8 weeks after flank injection of 1 × 106 A549 cells. Left flank inoculants consisted of normal A549 cells, while right flank received an equal mixture of normal and irradiated A549 cells. (p) Quantification of tumor size from (o). Sample size N = 06 animals per group. Tumor sizes (0.523 × length × width × height) were calculated with a digital caliper. To the exception of one animal (animal ID:2451) that developed a larger tumor on the left flank (homogenous inoculants), the remaining five animals developed noticeably larger tumors from the heterogenous inoculants. (q) Graphical representation of right to left flank tumor size ratio. At 8 weeks post inoculation, two of the five animals received Ruxolitinib (10 mg/kg) by oral gavage for 3 weeks. The remaining animals were treated with DMSO vehicle control for the same duration. Caliper measurements determined tumor size in treated versus vehicle control animals. Right to left tumor size ratios are shown at 1 and 2 weeks following treatment initiation. (r) Western blot from lysates derived from tumor xenografts harvested from animals treated with Ruxolitinib or DMSO vehicle controls were probed with phospho-STAT or STAT or GAPDH antibodies. All error bars denote SD. P values are derived from Student’s t test analyses. Effect size (d) values for f, g, k and l are greater than 0.8.
Fig. 5
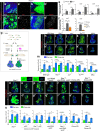
Fig. 5. The Wild-type p53/oncogenic Ras nonautonomous STAT signal relay promotes the radioresistance of Drosophila Ras tumor tissues.
(ad′) Upregulated p53 and dap/p21 within RasV12 clones after irradiation. GFP-labelled RasV12 clones were stained with anti-p53 antibody (a, a′, c, c′) or anti-p21 antibody (b, b′, d, d′) before irradiation (0 h) and 24 h after irradiation. Time was counted from the start of first faction of IR treatment. Scale bar is 20 µm. (e, f) Quantification by qPCR of upd, upd2, and upd3 expression in eye-antennal discs containing wild-type or RasV12 clones after 36 h of first fraction of IR treatment (IR+) or without IR treatment (IR−). Column bars represent the mean of fold changes for the expression level of indicated genes (e). Relative expression of upd2 and upd3 in irradiated eye-antennal discs containing wild type, RasV12 and RasV12p53R155H clones (f). Three independent experiments were carried out. Error bars denote SD. P values are derived from Student’s t test analyses. (g) Diagram of setting Drosophila irradiation models. Larvae after egg laying (48 h) were irradiated with three fractions of 10 Gy and allowed to recover to late third-instar larval stage. All eye-antennal discs were dissected at the late third-instar larval stage to evaluate the irradiation results by measuring the relative size between GFP-labeled clones and whole eye-antennal discs. (hl′) GFP-labeled clones homozygous for RasV12 (i, i′), sav3 (j, j′), Tsc1Q600X (k, k′), or expressing dMyc (l, l′) as well as wild-type controls (h, h′) were induced in the eye-antennal discs of larvae, irradiated at 48 h, and then collected discs on day 5. (hl) the eye-antennal discs without irradiation treatment (IR−). (h′–l′) show irradiated discs (IR+). (m) Quantification of relative eye disc size (blue) and GFP-clone size (green) treated with IR (IR+) or without IR (IR−). For each genotype, eye-antennal disc and GFP-clone were normalized to age-matched eye discs without IR. Column bars represent the mean size of samples (N = 5–10). Scale bar is 50 µm. (nt′) GFP-labeled RasV12, p53−/−, RasV12p53−/−, updRNAiupd2, RasV12UpdRNAiupd2, DomeDN, and RasV12DomeDN clones were induced in the eye-antennal discs and half were then irradiated at the second-instar larval stage. After 3 days of recovery, all eye discs at the late third-instar larval stage were dissected to evaluate the differences in response to irradiation. (nt) Eye-antennal discs without irradiation treatment (IR−) and (n′–t′) eye discs treated with irradiation (IR+). Scale bar is 50 µm. (u) Quantification of clones and eye discs treated with or without irradiation. Eye-antennal disc and GFP-clone areas were measured by ImageJ and normalized to the eye-antennal discs with the same genotype at the same age without IR. Column bars represent the mean size of samples (N = 5–9). Blue columns represent the mean size of the entire eye-antennal tissue for the indicated genotypes; green columns represent the size of GFP-labeled tumors. Error bars denote SEM. P values are derived from Student’s t test analyses. Effect size (d) values for e, f, m, and u are greater than 0.8.

Similar articles

Cited by

References

    1. Cox AD, Fesik SW, Kimmelman AC, Luo J, Der CJ. Drugging the undruggable RAS: Mission Possible? Nat. Publ. Group. 2014;13:828–851. - PMC - PubMed
    1. Hanahan D, et al. The Hallmarks of cancer. Cell. 2014;100:57–70. doi: 10.1016/S0092-8674(00)81683-9. - DOI - PubMed
    1. Zerdoumi Y, et al. A new genotoxicity assay based on p53 target gene induction. Mutat. Res Genet. Toxicol. Environ. Mutagen. 2015;789-790:28–35. doi: 10.1016/j.mrgentox.2015.05.010. - DOI - PubMed
    1. Bernhard EJ, et al. Direct evidence for the contribution of activated N-ras and K-ras oncogenes to increased intrinsic radiation resistance in human tumor cell lines. Cancer Res. 2000;60:6597–6600. - PubMed
    1. Gupta AK, et al. The Ras radiation resistance pathway. Cancer Res. 2001;61:4278–4282. - PubMed

Publication types

MeSH terms