

Biomarkers of environmental enteric dysfunction are not consistently associated with linear growth velocity in rural Zimbabwean infants
- PMID: 33740052
- PMCID: PMC8106752
- DOI: 10.1093/ajcn/nqaa416
Biomarkers of environmental enteric dysfunction are not consistently associated with linear growth velocity in rural Zimbabwean infants
Abstract
Background: Child stunting remains a poorly understood, prevalent public health problem. Environmental enteric dysfunction (EED) is hypothesized to be an important underlying cause.
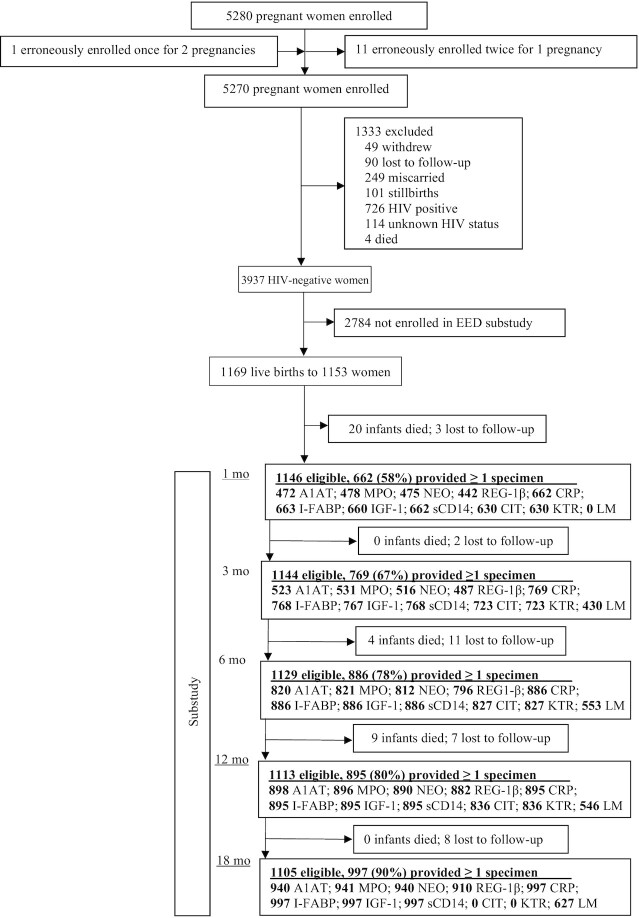
Objectives: Within a subgroup of 1169 children enrolled in the SHINE (Sanitation Hygiene Infant Nutrition Efficacy) trial in rural Zimbabwe, followed longitudinally from birth to 18 mo of age, we evaluated associations between the concentration of 11 EED biomarkers and linear growth velocity.
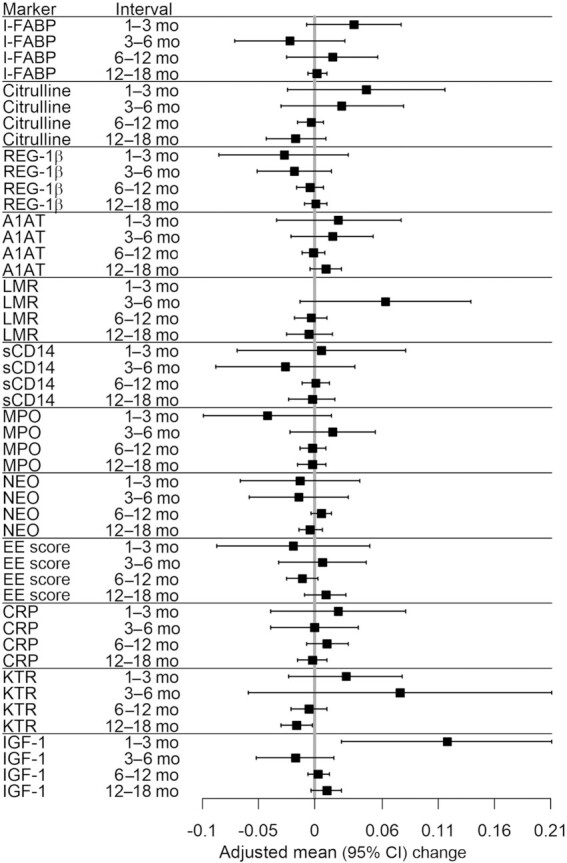
Methods: At infant ages 1, 3, 6, 12, and 18 mo, nurses measured child length and collected stool and blood; the lactulose-mannitol urine test was also conducted at all visits except at 1 mo. Stool neopterin, α-1 antitrypsin, myeloperoxidase, and regenerating gene 1β protein; urinary lactulose and mannitol; and plasma kynurenine, tryptophan, C-reactive protein, insulin-like growth factor-1 (IGF-1), soluble CD14, intestinal fatty acid binding protein, and citrulline were measured. We analyzed the change in relative [∆ length-for-age z score (LAZ)/mo] and absolute (∆ length/mo) growth velocity during 4 age intervals (1-3 mo; 3-6 mo; 6-12 mo; and 12-18 mo) per SD increase in biomarker concentration at the start of each age interval.
Results: In fully adjusted models, we observed only 3 small, statistically significant associations: kynurenine:tryptophan ratio at 12 mo was associated with decreased mean LAZ velocity during the 12-18 mo interval (-0.015 LAZ/mo; 95% CI: -0.029, -0.001 LAZ/mo); mannitol excretion at 6 mo was associated with increased LAZ velocity during the 6-12 mo interval (0.013 LAZ/mo; 95% CI: 0.001, 0.025 LAZ/mo), and plasma IGF-1 at 1 mo was associated with increased LAZ velocity during the 1-3 mo interval (0.118 LAZ/mo; 95% CI: 0.024, 0.211 LAZ/mo). Results for absolute growth velocity were similar, except IGF-1 was also associated with growth during the 12-18 mo interval. We found no other associations between any EED biomarker and linear growth velocity.
Conclusions: None of 11 biomarkers of EED were consistently associated with linear growth among Zimbabwean children.This trial was registered at clinicaltrials.gov as NCT01824940.
Keywords: Zimbabwe; biomarkers; child growth; environmental enteric dysfunction; stunting.
© The Author(s) 2021. Published by Oxford University Press on behalf of the American Society for Nutrition.
Figures
Similar articles
-
Effects of improved water, sanitation, and hygiene and improved complementary feeding on environmental enteric dysfunction in children in rural Zimbabwe: A cluster-randomized controlled trial.PLoS Negl Trop Dis. 2020 Feb 14;14(2):e0007963. doi: 10.1371/journal.pntd.0007963. eCollection 2020 Feb. PLoS Negl Trop Dis. 2020. PMID: 32059011 Free PMC article. Clinical Trial.
-
Environmental enteric dysfunction and systemic inflammation predict reduced weight but not length gain in rural Bangladeshi children.Br J Nutr. 2018 Feb;119(4):407-414. doi: 10.1017/S0007114517003683. Br J Nutr. 2018. PMID: 29498344 Clinical Trial.
-
Complementary feeding with cowpea reduces growth faltering in rural Malawian infants: a blind, randomized controlled clinical trial.Am J Clin Nutr. 2017 Dec;106(6):1500-1507. doi: 10.3945/ajcn.117.160986. Epub 2017 Nov 1. Am J Clin Nutr. 2017. PMID: 29092882 Free PMC article. Clinical Trial.
-
Plasma Fibroblast Growth Factor 21 Is Associated with Subsequent Growth in a Cohort of Underweight Children in Bangladesh.Curr Dev Nutr. 2019 Mar 30;3(5):nzz024. doi: 10.1093/cdn/nzz024. eCollection 2019 May. Curr Dev Nutr. 2019. PMID: 31093598 Free PMC article. Review.
-
Environmental enteric dysfunction pathways and child stunting: A systematic review.PLoS Negl Trop Dis. 2018 Jan 19;12(1):e0006205. doi: 10.1371/journal.pntd.0006205. eCollection 2018 Jan. PLoS Negl Trop Dis. 2018. PMID: 29351288 Free PMC article. Review.
Cited by
-
Gut microbiome development and childhood undernutrition.Cell Host Microbe. 2022 May 11;30(5):617-626. doi: 10.1016/j.chom.2022.04.002. Cell Host Microbe. 2022. PMID: 35550665 Free PMC article. Review.
-
Campylobacter vaccination reduces diarrheal disease and infant growth stunting among rhesus macaques.Nat Commun. 2023 Jun 26;14(1):3806. doi: 10.1038/s41467-023-39433-1. Nat Commun. 2023. PMID: 37365162 Free PMC article.
-
Anemia status of infants and young children aged six to thirty-six months in Ma'anshan City: A retrospective study.World J Clin Cases. 2023 Oct 6;11(28):6744-6753. doi: 10.12998/wjcc.v11.i28.6744. World J Clin Cases. 2023. PMID: 37901006 Free PMC article.
-
Bile Acid Profiling Reveals Distinct Signatures in Undernourished Children with Environmental Enteric Dysfunction.J Nutr. 2021 Dec 3;151(12):3689-3700. doi: 10.1093/jn/nxab321. J Nutr. 2021. PMID: 34718665 Free PMC article. Clinical Trial.
-
Intermittent preventive treatment for malaria in pregnancy and infant growth: a mediation analysis of a randomised trial.EBioMedicine. 2024 Nov;109:105397. doi: 10.1016/j.ebiom.2024.105397. Epub 2024 Oct 16. EBioMedicine. 2024. PMID: 39418986 Free PMC article. Clinical Trial.
References
-
- UNICEF, World Health Organization, International Bank for Reconstruction and Development/The World Bank. Levels and trends in child malnutrition: key findings of the 2019 edition of the Joint Child Malnutrition Estimates. Geneva: WHO; 2019.
-
- De Onis M, Habicht JP. Anthropometric reference data for international use: recommendations from a World Health Organization Expert Committee. Am J Clin Nutr. 1996;64:650–8. - PubMed
-
- Victora CG, De Onis M, Hallal PC, Blössner M, Shrimpton R. Worldwide timing of growth faltering: revisiting implications for interventions. Pediatrics. 2010;125:e473–e80. - PubMed
-
- Vollmer S, Harttgen K, Subramanyam MA, Finlay J, Klasen S, Subramanian SV. Association between economic growth and early childhood undernutrition: evidence from 121 Demographic and Health Surveys from 36 low-income and middle-income countries. Lancet Glob Health. 2014;2:e225–e34. - PubMed
Publication types
MeSH terms
Substances
Associated data
Grants and funding
LinkOut - more resources
Full Text Sources
Other Literature Sources
Medical
Research Materials
Miscellaneous
