Comparative Study
. 2021 Jun 25;38(7):2897-2914.
doi: 10.1093/molbev/msab080.

Horizontal Gene Transfer and Gene Duplication of β-Fructofuranosidase Confer Lepidopteran Insects Metabolic Benefits

Affiliations
Comparative Study

Horizontal Gene Transfer and Gene Duplication of β-Fructofuranosidase Confer Lepidopteran Insects Metabolic Benefits

Xiangping Dai et al. Mol Biol Evol. .

Abstract

Horizontal gene transfer (HGT) is a potentially critical source of material for ecological adaptation and the evolution of novel genetic traits. However, reports on posttransfer duplication in organism genomes are lacking, and the evolutionary advantages conferred on the recipient are generally poorly understood. Sucrase plays an important role in insect physiological growth and development. Here, we performed a comprehensive analysis of the evolution of insect β-fructofuranosidase transferred from bacteria via HGT. We found that posttransfer duplications of β-fructofuranosidase were widespread in Lepidoptera and sporadic occurrences of β-fructofuranosidase were found in Coleoptera and Hymenoptera. β-fructofuranosidase genes often undergo modifications, such as gene duplication, differential gene loss, and changes in mutation rates. Lepidopteran β-fructofuranosidase gene (SUC) clusters showed marked divergence in gene expression patterns and enzymatic properties in Bombyx mori (moth) and Papilio xuthus (butterfly). We generated SUC1 mutations in B. mori using CRISPR/Cas9 to thoroughly examine the physiological function of SUC. BmSUC1 mutant larvae were viable but displayed delayed growth and reduced sucrase activities that included susceptibility to the sugar mimic alkaloid found in high concentrations in mulberry. BmSUC1 served as a critical sucrase and supported metabolic homeostasis in the larval midgut and silk gland, suggesting that gene transfer of β-fructofuranosidase enhanced the digestive and metabolic adaptation of lepidopteran insects. These findings highlight not only the universal function of β-fructofuranosidase with a link to the maintenance of carbohydrate metabolism but also an underexplored function in the silk gland. This study expands our knowledge of posttransfer duplication and subsequent functional diversification in the adaptive evolution and lineage-specific adaptation of organisms.

Keywords: β-fructofuranosidase; adaptation; gene duplication; horizontal gene transfer; insect.


Figures

Fig. 1.
Fig. 1.
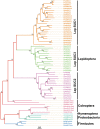
Distribution of SUC paralogs across lepidopteran species. Summary of SUC homolog presence across Lepidoptera with two expanded orders: Coleoptera and Hymenoptera. A total of 61 full-length genes encoding putative β-fructofuranosidases from 21 insect species were detected. The presence (black box) or absence (white box) of each SUC and SUC-like were identified by retrieving the available coding sequences from NCBI, Ensembl, and Lepbase online databases is schematized to the right of each species. Three conserved mitochondrial genes (cytochrome oxidase subunit I, cytochrome oxidase subunit II, and NADH dehydrogenase subunit 1) were used to build the evolutionary tree of lepidopteran species. Cytochrome oxidase subunit I genes were used to build the phylogenetic relationship between hymenopteran and coleopteran species. Phylogenetic trees were constructed with multilocus sequence analysis (MLSA) using the IQ-TREE software. The highest log likelihood is −12801.62 and −2570.39, respectively. Detailed information involved sequences and the accession numbers are provided as supplementary tables S1 and S4, Supplementary Material online.
Fig. 2.
Fig. 2.
Evolutionary relationship among SUCs. The evolutionary relationship was constructed using MEGA7.0 software with the maximum-likelihood topology based on the (LG+G+I) model. The analysis involved 67 amino acid sequences. All positions containing gaps and missing data were eliminated. Bootstrap values greater than 60 are shown. The scale bar represents 0.1 amino acid substitutions per site. Sequences and the accession numbers are provided in supplementary table S1, Supplementary Material online.
Fig. 3.
Fig. 3.
Conserved syntenic analysis of SUCs and their surrounding genes. Synteny was analyzed using PxSUC1, PxSUC2, and PxSUC3 as anchor sites, respectively. Lepidopteran SUCs are placed in the middle and indicated in yellow. Homologs are represented by the same color, and genes with no homolog are indicated with blank boxes. Forkhead box protein k1, FOXK1; allatostatin-A receptor, AstAR; lipopolysaccharide-binding protein, LBP; glutaminyl-peptide cyclotransferase-like, QPCT; sorting nexin-8-like, SNX8; acylneuraminate cytidylyltransferase, NeuA; ATP-dependent DNA helicase Q1-like, RecQ1; amino acid transporter 4-like, AT4/AT4-2; cholecystokinin receptor-like, CCKR; elongation of very long-chain fatty acids protein 5: ELOVL5. The direction of the gene is indicated with block arrows. Gene name abbreviations are shown inside the arrow diagrams. The positions of genes on the chromosomes are not drawn to scale. SUC homologs with introns are underlined in purple: DpleSUC1, JcoeSUC1, JcoeSUC2, and HmelSUC3b.
Fig. 4.
Fig. 4.
Partial amino acid sequence alignment of SUCs. Three catalytic regions (62–65,180–183, and 234–237 amino acids; numbered according to BmSUC1) were extracted following an alignment of the full-length SUC protein sequences in MEGA7.0 program. The R package “ggtree” was used to visualize and annotate the result. Same amino acids are represented by the same color. Three conserved catalytic residues Asp63 (D), Asp181 (D), and Glu234 (E) are indicated in red letters. The alignment result of SUC2s is marked with a red rectangle. The scale bar represents 0.1 amino acid substitutions per site.
Fig. 5.
Fig. 5.
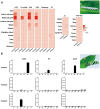
Expression patterns of SUCs in Bombyx mori and Papilio xuthus. (A) Expression patterns of BmSUCs in B. mori. Expression data from SilkDB 3.0 (https://silkdb.bioinfotoolkits.net/main/species-info/-1, last accessed March 21, 2021) were searched to identify the expression profiles of SUC genes in 78 samples throughout the silkworm development stages (larval, pupal, and adult stages). The fold-changes of SUCs were indicated by the R package “Complex Heatmap.” (B) qRT–PCR analysis of PxSUCs expression. Samples were collected from the dissections of the head (Hd), wing disc (Wi), silk gland (Sg), fat body (Fb), midgut (Mg), Malpighia tubule (Mt), testis (Te), and epidermis (Ep). qRT–PCR was normalized using Pxrpl as a control. Values represent means ± SEM (n = 3). L4D3, the third day of the fourth larval instar; L4 molting, the end of the fourth larval instar; L5D0, the start of the fifth larval instar; L5D3, the third day of the fifth larval instar; PP, prepupal stage; P1, the first day of the pupal stage; P4, the fourth day of the pupal stage; Adult, adult stage; Adult day1, the first day of the adult stage.
Fig. 6.
Fig. 6.
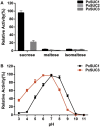
Enzymatic properties of three recombinant PxSUC proteins. (A) Enzymatic activities of recombinant PxSUC proteins. The purified PxSUC proteins were incubated with selected substrates (sucrose, maltose, and isomaltose). (B) The pH profiles of recombinant PxSUC1 and PxSUC3. The optimal pH was determined using sucrose as a substrate in 20 mM Britton–Robinson wide range buffer (pH: 3.0–11.0). Data represent the mean of three independent experiments, and error bars represent SDs.
Fig. 7.
Fig. 7.
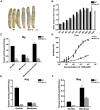
CRISPR/Cas9-mediated gene editing of BmSUC1 in Bombyx mori. (A) Individual body sizes on day 5 of the fifth larval instar. (B) The weight of each individual during the fifth instar (n = 20). (C) Sucrase activities of the midgut in WT and BmSUC1 mutant larvae. (D) Inhibitory effects of 1-deoxynojirimycin on midgut sucrase activities in WT and mutant. (E) Sucrase activities of anterior silk gland in WT and mutant larvae. (F) Sucrase activities of middle silk gland in WT and mutant larvae. Statistical analyses were performed using an independent Student’s t-test. *P < 0.05, **P < 0.01, and ***P < 0.001. Vertical bars indicate means ± SEM (n = 3).
Fig. 8.
Fig. 8.
Transcriptomic changes following interruption of BmSUC1 in the midgut. (A) Gene ontology (GO) enrichment analysis. GO terms with P < 0.05 were considered significant enrichment. (B) The KEGG pathways enrichment analysis. The different-sized dots represent the numbers of enriched genes in pathways. (C) Heat map of midgut DEGs. The color of heat map corresponds to the scale value of FPKM (row Z scores). The line chart displays the fold-change of DEGs. The green vertical bars represent the P value of each gene. The names of the DEGs are shown on the left. The detailed DEGs are provided in supplementary table S6, Supplementary Material online.
Fig. 9.
Fig. 9.
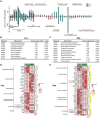
Transcriptomic changes following interruption of BmSUC1 in the silk gland. (A) The up- and downregulation of DEGs within enriched GO terms. Red/green bars represent the numbers of genes that were significantly up- and downregulated in Asg and Msg, respectively. The detailed GO terms information are described in supplementary table S3, Supplementary Material online. (B) The KEGG pathways enrichment analysis in Asg. (C) The KEGG pathways enrichment analysis in Msg. Pathways with P < 0.05 were considered as significant enrichment. (D) The heat map of selected DEGs in Asg. (E) The heat map of selected DEGs in Msg. The same DEGs in Asg and Msg are marked with purple asterisks. The color of heat map corresponds to the scale value of FPKM (row Z scores). The green vertical bars represent the P value of each gene. The detailed DEGs are provided in supplementary table S7, Supplementary Material online.

Similar articles

Cited by

References

    1. Acuña R, Padilla BE, Flórez-Ramos CP, Rubio DJ, Herrera JC, Benavides P, Lee SJ, Yeats TH, Egan AN, Doyle JJ, et al.2012. Adaptive horizontal transfer of a bacterial gene to an invasive insect pest of coffee. Proc Natl Acad Sci U S A. 109(11):4197–4202. - PMC - PubMed
    1. Afshar K, Dube FF, Najafabadi HS, Bonneil E, Thibault P, Salavati R, Bede JC.. 2013. Insights into the insect salivary gland proteome: diet-associated changes in caterpillar labial salivary proteins. J Insect Physiol. 59(3):351–366. - PubMed
    1. Albalat R, Cañestro C.. 2016. Evolution by gene loss. Nat Rev Genet. 17(7):379–391. - PubMed
    1. Assis R, Bachtrog D.. 2013. Neofunctionalization of young duplicate genes in Drosophila. Proc Natl Acad Sci U S A. 110(43):17409–17414. - PMC - PubMed
    1. Baudouin-Gonzalez L, Santos MA, Tempesta C, Sucena É, Roch F, Tanaka K.. 2017. Diverse cis-regulatory mechanisms contribute to expression evolution of tandem gene duplicates. Mol Biol Evol. 34(12):3132–3147. - PMC - PubMed

Publication types

LinkOut - more resources