

The N-terminal domain of the A12.2 subunit stimulates RNA polymerase I transcription elongation
- PMID: 33737158
- PMCID: PMC8204343
- DOI: 10.1016/j.bpj.2021.03.007
The N-terminal domain of the A12.2 subunit stimulates RNA polymerase I transcription elongation
Abstract
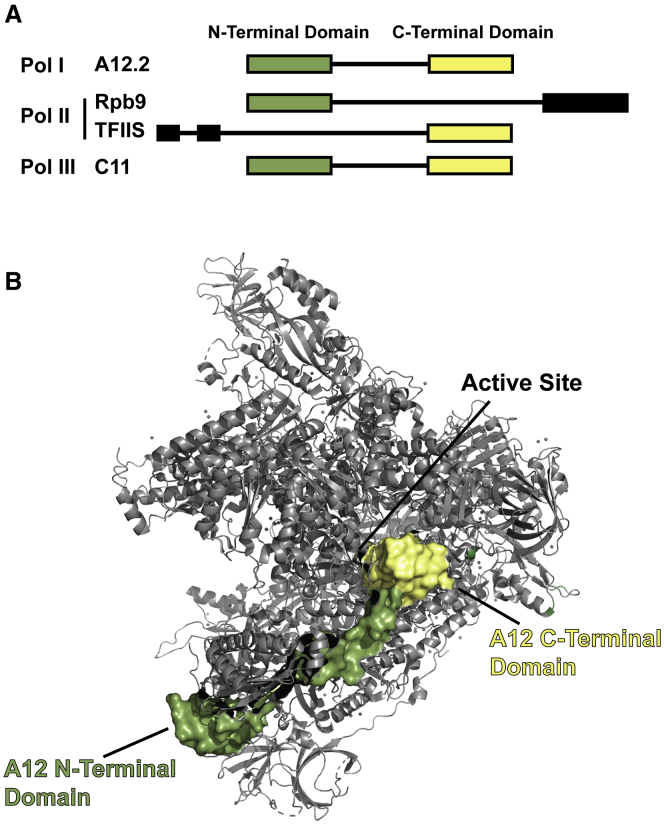
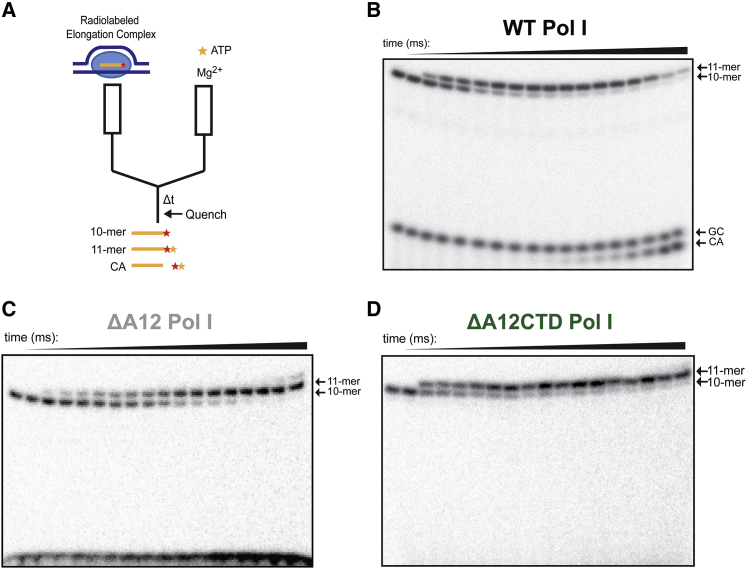
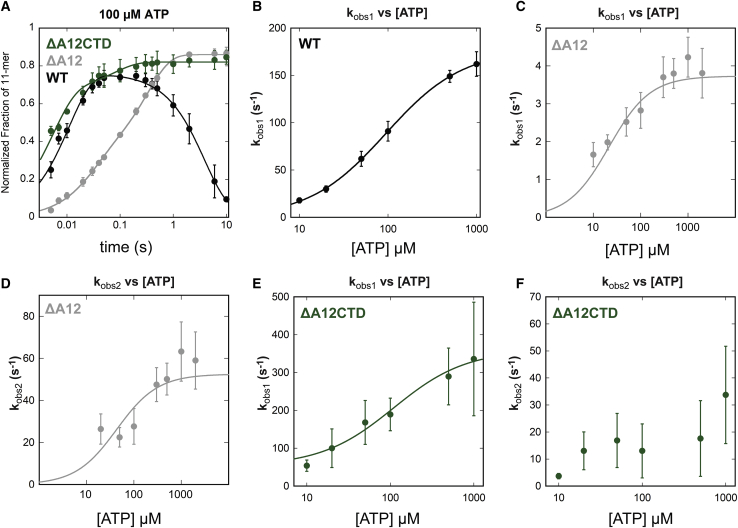
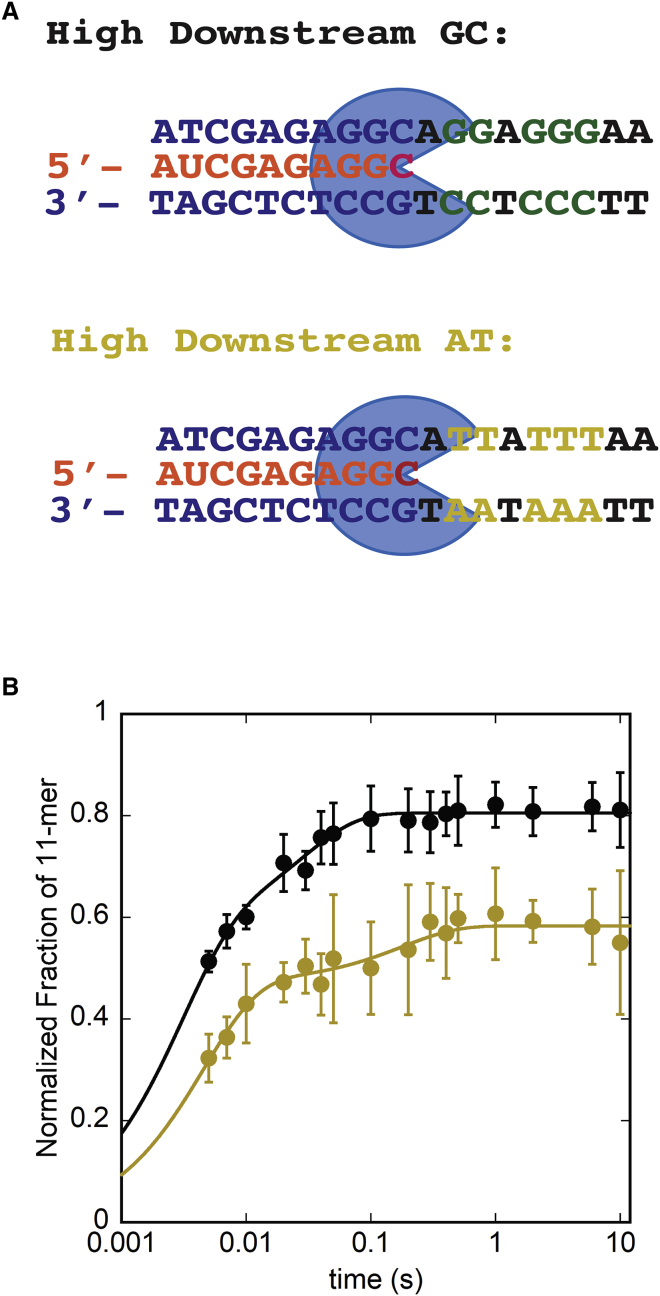
Eukaryotes express three DNA-dependent RNA polymerases (Pols) that are responsible for the entirety of cellular genomic expression. The three Pols have evolved to express specific cohorts of RNAs and thus have diverged both structurally and functionally to efficiently execute their specific transcriptional roles. One example of this divergence is Pol I's inclusion of a proofreading factor as a bona fide subunit, as opposed to Pol II, which recruits a transcription factor, TFIIS, for proofreading. The A12.2 (A12) subunit of Pol I shares homology with both the Rpb9 subunit of Pol II as well as the transcription factor TFIIS, which promotes RNA cleavage and proofreading by Pol II. In this study, the functional contribution of the TFIIS-like C-terminal domain and the Rpb9-like N-terminal domain of the A12 subunit are probed through mutational analysis. We found that a Pol I mutant lacking the C-terminal domain of the A12 subunit (ΔA12CTD Pol I) is slightly faster than wild-type Pol I in single-nucleotide addition, but ΔA12CTD Pol I lacks RNA cleavage activity. ΔA12CTD Pol I is likewise similar to wild-type Pol I in elongation complex stability, whereas removal of the entire A12 subunit (ΔA12 Pol I) was previously demonstrated to stabilize transcription elongation complexes. Furthermore, the ΔA12CTD Pol I is sensitive to downstream sequence context, as ΔA12CTD Pol I exposed to AT-rich downstream DNA is more arrest prone than ΔA12 Pol I. These data demonstrate that the N-terminal domain of A12 does not stimulate Pol I intrinsic RNA cleavage activity, but rather contributes to core transcription elongation properties of Pol I.
Copyright © 2021 Biophysical Society. Published by Elsevier Inc. All rights reserved.
Figures


Similar articles
-
Transcription elongation through DNA arrest sites. A multistep process involving both RNA polymerase II subunit RPB9 and TFIIS.J Biol Chem. 1997 Jun 6;272(23):14747-54. doi: 10.1074/jbc.272.23.14747. J Biol Chem. 1997. PMID: 9169440
-
The A12.2 Subunit Plays an Integral Role in Pyrophosphate Release of RNA Polymerase I.J Mol Biol. 2023 Aug 1;435(15):168186. doi: 10.1016/j.jmb.2023.168186. Epub 2023 Jun 22. J Mol Biol. 2023. PMID: 37355033 Free PMC article.
-
The A12.2 Subunit Is an Intrinsic Destabilizer of the RNA Polymerase I Elongation Complex.Biophys J. 2018 Jun 5;114(11):2507-2515. doi: 10.1016/j.bpj.2018.04.015. Biophys J. 2018. PMID: 29874602 Free PMC article.
-
Transcription elongation mechanisms of RNA polymerases I, II, and III and their therapeutic implications.J Biol Chem. 2024 Mar;300(3):105737. doi: 10.1016/j.jbc.2024.105737. Epub 2024 Feb 8. J Biol Chem. 2024. PMID: 38336292 Free PMC article. Review.
-
RNA polymerase II structure: from core to functional complexes.Curr Opin Genet Dev. 2004 Apr;14(2):218-26. doi: 10.1016/j.gde.2004.01.003. Curr Opin Genet Dev. 2004. PMID: 15196470 Review.
Cited by
-
Structural insights into nuclear transcription by eukaryotic DNA-dependent RNA polymerases.Nat Rev Mol Cell Biol. 2022 Sep;23(9):603-622. doi: 10.1038/s41580-022-00476-9. Epub 2022 May 3. Nat Rev Mol Cell Biol. 2022. PMID: 35505252 Review.
-
RNA polymerase I (Pol I) lobe-binding subunit Rpa12.2 promotes RNA cleavage and proofreading.J Biol Chem. 2022 May;298(5):101862. doi: 10.1016/j.jbc.2022.101862. Epub 2022 Mar 25. J Biol Chem. 2022. PMID: 35341765 Free PMC article.
-
Expression of RNA polymerase I catalytic core is influenced by RPA12.PLoS One. 2023 May 11;18(5):e0285660. doi: 10.1371/journal.pone.0285660. eCollection 2023. PLoS One. 2023. PMID: 37167337 Free PMC article.
-
Defining the Influence of the A12.2 Subunit on Transcription Elongation and Termination by RNA Polymerase I In Vivo.Genes (Basel). 2021 Nov 30;12(12):1939. doi: 10.3390/genes12121939. Genes (Basel). 2021. PMID: 34946888 Free PMC article.
-
Regulation of ribosomal RNA gene copy number, transcription and nucleolus organization in eukaryotes.Nat Rev Mol Cell Biol. 2023 Jun;24(6):414-429. doi: 10.1038/s41580-022-00573-9. Epub 2023 Feb 2. Nat Rev Mol Cell Biol. 2023. PMID: 36732602 Review.
References
Publication types
MeSH terms
Substances
Grants and funding
LinkOut - more resources
Full Text Sources
Other Literature Sources
