

Covariance-based sample selection for heterogeneous data: Applications to gene expression and autism risk gene detection
- PMID: 33731968
- PMCID: PMC7958652
- DOI: 10.1080/01621459.2020.1738234
Covariance-based sample selection for heterogeneous data: Applications to gene expression and autism risk gene detection
Abstract
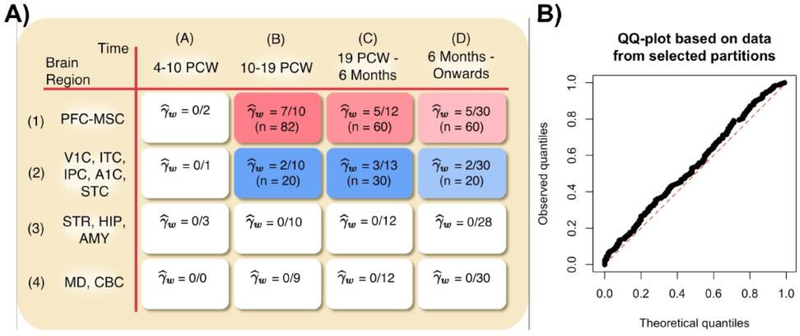
Risk for autism can be influenced by genetic mutations in hundreds of genes. Based on findings showing that genes with highly correlated gene expressions are functionally interrelated, "guilt by association" methods such as DAWN have been developed to identify these autism risk genes. Previous research analyze the BrainSpan dataset, which contains gene expression of brain tissues from varying regions and developmental periods. Since the spatiotemporal properties of brain tissue is known to affect the gene expression's covariance, previous research have focused only on a specific subset of samples to avoid the issue of heterogeneity. This analysis leads to a potential loss of power when detecting risk genes. In this article, we develop a new method called COBS (COvariance-Based sample Selection) to find a larger and more homogeneous subset of samples that share the same population covariance matrix for the downstream DAWN analysis. To demonstrate COBS's effectiveness, we use genetic risk scores from two sequential data freezes obtained in 2014 and 2020. We show COBS improves DAWN's ability to predict risk genes detected in the newer data freeze when using the risk scores of the older data freeze as input.
Keywords: Bootstrap covariance test; Microarray; Multiple testing with dependence.
Figures

Similar articles
-
NETWORK ASSISTED ANALYSIS TO REVEAL THE GENETIC BASIS OF AUTISM.Ann Appl Stat. 2015;9(3):1571-1600. doi: 10.1214/15-AOAS844. Epub 2015 Nov 2. Ann Appl Stat. 2015. PMID: 27134692 Free PMC article.
-
DAWN: a framework to identify autism genes and subnetworks using gene expression and genetics.Mol Autism. 2014 Mar 6;5(1):22. doi: 10.1186/2040-2392-5-22. Mol Autism. 2014. PMID: 24602502 Free PMC article.
-
Predicting the Risk Genes of Autism Spectrum Disorders.Front Genet. 2021 Jun 14;12:665469. doi: 10.3389/fgene.2021.665469. eCollection 2021. Front Genet. 2021. PMID: 34194469 Free PMC article.
-
The genetics of autism.Pediatrics. 2004 May;113(5):e472-86. doi: 10.1542/peds.113.5.e472. Pediatrics. 2004. PMID: 15121991 Review.
-
Translational Metabolomics of Head Injury: Exploring Dysfunctional Cerebral Metabolism with Ex Vivo NMR Spectroscopy-Based Metabolite Quantification.In: Kobeissy FH, editor. Brain Neurotrauma: Molecular, Neuropsychological, and Rehabilitation Aspects. Boca Raton (FL): CRC Press/Taylor & Francis; 2015. Chapter 25. In: Kobeissy FH, editor. Brain Neurotrauma: Molecular, Neuropsychological, and Rehabilitation Aspects. Boca Raton (FL): CRC Press/Taylor & Francis; 2015. Chapter 25. PMID: 26269925 Free Books & Documents. Review.
Cited by
-
Age, sex, and apolipoprotein E isoform alter contextual fear learning, neuronal activation, and baseline DNA damage in the hippocampus.Mol Psychiatry. 2023 Aug;28(8):3343-3354. doi: 10.1038/s41380-023-01966-8. Epub 2023 Feb 2. Mol Psychiatry. 2023. PMID: 36732588 Free PMC article.
References
-
- Alamgir M and Von Luxburg U (2012). Shortest path distance in random k - nearest neighbor graphs. arXiv preprint arXiv:1206.6381.
-
- Autism and Investigators, D. D. M. N. S. Y.. P. (2014). Prevalence of autism spectrum disorder among children aged 8 years - Autism and developmental disabilities monitoring network, 11 sites, United States, 2010. Morbidity and Mortality Weekly Report: Surveillance Summaries, 63(2):1–21. - PubMed
-
- Cai T, Liu W, and Xia Y (2013). Two-sample covariance matrix testing and support recovery in high-dimensional and sparse settings. Journal of the American Statistical Association, 108(501):265–277.
-
- Chang J, Zhou W, Zhou W-X, and Wang L (2017). Comparing large covariance matrices under weak conditions on the dependence structure and its application to gene clustering. Biometrics, 73(1):31–41. - PubMed
Grants and funding
LinkOut - more resources
Full Text Sources
Other Literature Sources