. 2021 May 10;95(11):e00183-21.
doi: 10.1128/JVI.00183-21. Epub 2021 Mar 17.

Epigenetic reprogramming of host and viral genes by Human Cytomegalovirus infection in Kasumi-3 myeloid progenitor cells at early times post-infection

Affiliations

Epigenetic reprogramming of host and viral genes by Human Cytomegalovirus infection in Kasumi-3 myeloid progenitor cells at early times post-infection

Eleonora Forte et al. J Virol. .

Abstract

HCMV establishes latency in myeloid cells. Using the Kasumi-3 latency model, we previously showed that lytic gene expression is activated prior to establishment of latency in these cells. The early events in infection may have a critical role in shaping establishment of latency. Here, we have used an integrative multi-omics approach to investigate dynamic changes in host and HCMV gene expression and epigenomes at early times post infection. Our results show dynamic changes in viral gene expression and viral chromatin. Analyses of Pol II, H3K27Ac and H3K27me3 occupancy of the viral genome showed that 1) Pol II occupancy was highest at the MIEP at 4 hours post infection. However, it was observed throughout the genome; 2) At 24 hours, H3K27Ac was localized to the major immediate early promoter/enhancer and to a possible second enhancer in the origin of replication OriLyt; 3) viral chromatin was broadly accessible at 24 hpi. In addition, although HCMV infection activated expression of some host genes, we observed an overall loss of de novo transcription. This was associated with loss of promoter-proximal Pol II and H3K27Ac, but not with changes in chromatin accessibility or a switch in modification of H3K27.Importance.HCMV is an important human pathogen in immunocompromised hosts and developing fetuses. Current anti-viral therapies are limited by toxicity and emergence of resistant strains. Our studies highlight emerging concepts that challenge current paradigms of regulation of HCMV gene expression in myeloid cells. In addition, our studies show that HCMV has a profound effect on de novo transcription and the cellular epigenome. These results may have implications for mechanisms of viral pathogenesis.


Figures

FIG 1
FIG 1
Schematic of the samples used in the analysis of host and HCMV transcriptomes and epigenomes in Kasumi-3 cells. (A) Kasumi-3 cells were infected with HCMV TB40/Ewt-GFP at an MOI of 1. The total cell population, which includes GFP+ and GFP infected cells as well as uninfected cells, was collected at 4 and 24 hpi. Cells were used for RNA-seq, and Pol II, H3K27Ac, and H3K27me3 ChIP-seq analyses to study the HCMV epigenome. (B) Kasumi-3 cells were mock infected or infected with HCMV TB40/Ewt-GFP at an MOI of 1. At 24 hpi, cells were sorted to obtain GFP+ live infected cells and live mock-infected cells. Those populations were then subjected to ATAC-seq, RNA-seq, nascent RNA-seq, and Pol II, H3K27Ac and H3K27me3 ChIP-seq analyses to study the effect of HCMV infection on both host and viral epigenomes.
FIG 2
FIG 2
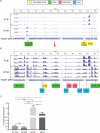
Expression of HCMV RNAs in infected Kasumi-3 cells at 4 and 24 hpi. (A) IGV (Integrative Genomics Viewer) of RNA-seq coverage of the entire HCMV genome at 4 and 24 hpi in infected Kasumi-3 cells. (B) Reduced-scale view of the RNA-seq coverage map to allow the visualization of all the expressed viral transcripts. Selected immediate early, early, early/late, and late genes are shown in yellow, green, pink, and blue, respectively. Kinetic classes are based on previous analyses of HCMV-infected fibroblasts (57, 61–64, 66, 67, 137–139). Three independent experiments are shown for each time. HCMV sequences were aligned to TB40/E clone TB40-BAC4 (EF999921.1), to which the GFP gene sequence was added. (C) RT-qPCR validation of changes in the relative abundance of selected viral genes between 4 and 24 hpi. Statistical significance was determined by one-way analysis of variance (ANOVA) with Tukey’s multiple-comparison test. *, P < 0.05; **, P < 0.01; ***, P < 0.001; ****, P < 0.0001.
FIG 3
FIG 3
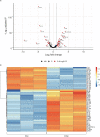
Temporal changes in the relative abundance of HCMV RNAs. (A) Volcano plot of changes in viral gene expression between 4 and 24 hpi. Significant regulated genes are shown in red (P value <0.05 and log2 fold change [FC] higher than 1 and less than −1). NS, not significant. (B) Heat map of differentially expressed genes. Values shown are Z scores of normalized reads, with a cutoff of −1 < log2 FC > 1 and adjusted P value of <0.05.
FIG 4
FIG 4
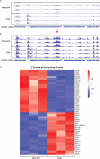
HCMV genes are differentially expressed in the early stages of infection. (A) IGV tracks of nascent and total RNAs expressed in infected Kasumi-3 cells at 24 to 28 hpi. (B) Reduced-scale view of the RNA-seq coverage map to allow the visualization of all the expressed viral transcripts. (C). Heat map of the Z scores of the normalized counts of nascent and total RNAs expressed between 24 and 28 hpi with a cutoff of −1 < log2 FC > 1 and adjusted P value of <0.05.
FIG 5
FIG 5
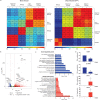
Validation of ChIP-seq analyses. Pearson correlation analyses between replicates of RNA-seq, Pol II ChIP-seq, H3K27Ac ChIP-seq, and H3K27me3 infected samples at 4 (A) and 24 (B) hpi. (C) H3K27Ac ChIP-seq (green) and H3K27me ChIP-seq (red) coverage maps for CD8A, which is not expressed, and GAPDH, which is transcriptionally active in HCMV-infected Kasumi-3 cells at 4 and 24 hpi. Tracks shown are from three independent experiments.
FIG 6
FIG 6
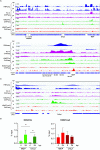
Epigenetic landscape of the HCMV genome at 4 and 24 hpi. RNA-seq (purple), Pol II ChIP-seq (pink), H3K27Ac ChIP-seq (green), and H3K27me ChIP-seq (red) coverage maps for the entire HCMV genome (A) and zoom-in image for the MIEP (B) and oriLyt (C) regions in Kasumi-3 infected cells at 4 and 24 hpi. A representative example of three independent experiments is shown. (D) PCR-ChIP analyses of the MIEP and oriLyt regions at 4 and 24 hpi. Three biological replicates were analyzed.
FIG 7
FIG 7
HCMV chromatin is open and accessible to cleavage with Tn5 transposase in infected Kasumi-3 cells. IGV ATAC-seq coverage maps of the HCMV genome (A) and the cellular GAPDH gene (B) in GFP+ HCMV-infected cells at 1 dpi. GAPDH analysis serves as internal control for the quality of the ATAC-seq. Three independent biological replicates are shown.
FIG 8
FIG 8
Changes in cellular gene expression induced by HCMV infection at 24 hpi. (A) Pearson correlation analyses between replicates of RNA-seq, Pol II ChIP-seq, H3K27Ac ChIP-seq, and H3K27me3 ChIP-seq from mock-infected and TB40/Ewt-GFP-infected sorted cells at 24 hpi. (B) Volcano plot showing differential gene expression between mock-infected and GFP+-infected Kasumi-3 cells at 1 dpi. Vertical lines indicate a log2 fold change (FC) of 1 and −1. (C) DAVID functional GO analysis of biological processes (BP) enrichment for downregulated and upregulated genes in HCMV-infected cells compared to mock-infected cells (adjusted P value < 0.05, −1 < log2 FC > 1). (D) RT-qPCR validation of changes in cellular gene expression induced by HCMV infection. RNAs from HCMV-infected (+) or mock-infected Kasumi-3 cells (−) were analyzed for the indicated cellular genes. Statistical significance was determined by one-way ANOVA with Tukey’s multiple-comparison test. *, P < 0.05; **, P < 0.01.
FIG 9
FIG 9
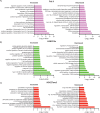
Effect of HCMV infection on de novo transcription of cellular genes. (A) Percentage of genes that were up- or downregulated at 24 hpi in total (steady state) and nascent RNAs from HCMV-infected versus mock-infected Kasumi-3 cells at 24 hpi, as determined by differential gene expression analysis (P < 0.05). (B) Heat maps of differentially expressed genes in total or nascent RNAs from mock-infected or infected cells. Values were derived from the Z scores of the normalized reads. (C) DAVID functional GO analysis of BP enrichment for upregulated and downregulated genes in nascent RNA from HCMV-infected cells compared to that in mock-infected cells.
FIG 10
FIG 10
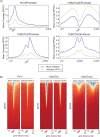
Effect of HCMV infection on occupancy of Pol II and H3K27 at cellular promoters. (A) Metagene analyses of ChIP-seq data of Pol II, H3K27me3, and H3K27Ac promoter occupancy and H3K27Ac enhancer occupancy in HCMV-infected or mock-infected Kasumi-3 cells at 1 dpi. (B) Heat maps of Pol II, H3K27Ac, and H3K4me3 occupancy at promoter regions. TSS, transcription start site.
FIG 11
FIG 11
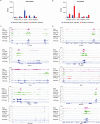
Epigenetic profiles of selected cellular genes with changes in de novo transcription in response to HCMV infection. Reads per kilobase per million (RPKM) of selected genes whose de novo expression is significantly decreased (A) or increased (B) in infected versus mock-infected Kasumi-3 cells (P < 0.05). Bars show mean values plus standard deviations. Coverage maps of selected genes whose expression is decreased (C) or increased (D) in infected versus mock-infected Kasumi-3 cells. Pol II ChIP-seq (pink), H3K27Ac ChIP-seq (green), H3K27me3 ChIP-seq (red), and ATAC-seq (blue). Tracks shown are representative of two to three independent experiments.
FIG 12
FIG 12
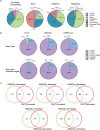
Localization of changes in the cellular epigenome induced by HCMV infection. (A) Gene annotation of changes in chromatin accessibility, Pol II, and H3K27Ac and H3K27me3 occupancy derived from differential peak analyses performed on genes in mock-infected versus HCMV-infected Kasumi-3 cells at 24 hpi (adjusted P value < 0.05 and −0.5 < log2 FC > 0.5). (B) Identification of gene type changes in Pol II, H3K27Ac, and H3K27me3 occupancy on entire genes and promoter-proximal regions in mock-infected and HCMV-infected Kasumi-3 cells at 24 hpi (adjusted P value < 0.05 and −0.5 < log2 FC > 0.5). (C). Venn diagrams showing correlations between changes in H3K27 versus Pol II and H3K27Ac versus H3K27me3.
FIG 13
FIG 13
Pathway analysis of the effect of HCMV infection on occupancy of Pol II and H3K27 at cellular promoters. DAVID functional GO analysis of BP enrichment conducted on genes with increased and decreased Pol II (A), H3K27Ac (B), and H3K27me3 occupancy at the promoter regions of HCMV-infected cells compared to that of mock-infected cells (adjusted P value < 0.05, −0.5 < log2 FC > 0.5).
FIG 14
FIG 14
Increased occupancy of Pol II at promoter-proximal regions is associated with both upregulation and downregulation of gene expression. RNA-seq (purple) and Pol II ChIP-seq (pink) coverage maps for RHOB (A), KLF2 (B), RUNX1 (C), SH2B3 (D), TGFB1 (E), and FHL3 (F). Tracks shown are representative of two to three independent experiments.
FIG 15
FIG 15
Effect of HCMV infection on Pol II protein isoforms. Kasumi-3 cells were infected with TB40/Ewt-GFP, and at 1 dpi, GFP-expressing cells were purified by flow cytometry. (A) Lysates were used for Western blot (WB) analysis against Rpb1, phospho (p)-Ser2 Rpb1, and p-Ser5 Rpb1. Cyclophilin B was used as a loading control (B). Quantification of protein expression levels from three independent experiments. Error bars represent standard errors of the means (SEMs). P value <0.05 by one-tailed Student’s pairwise t test.

Similar articles

Cited by

References

    1. Mendelson M, Monard S, Sissons P, Sinclair J. 1996. Detection of endogenous human cytomegalovirus in CD34+ bone marrow progenitors. J Gen Virol 77:3099–3102. 10.1099/0022-1317-77-12-3099. - DOI - PubMed
    1. Sindre H, Tjoonnfjord GE, Rollag H, Ranneberg-Nilsen T, Veiby OP, Beck S, Degre M, Hestdal K. 1996. Human cytomegalovirus suppression of and latency in early hematopoietic progenitor cells. Blood 88:4526–4533. 10.1182/blood.V88.12.4526.bloodjournal88124526. - DOI - PubMed
    1. Minton EJ, Tysoe C, Sinclair JH, Sissons JG. 1994. Human cytomegalovirus infection of the monocyte/macrophage lineage in bone marrow. J Virol 68:4017–4021. 10.1128/JVI.68.6.4017-4021.1994. - DOI - PMC - PubMed
    1. Kondo K, Mocarski ES. 1995. Cytomegalovirus latency and latency-specific transcription in hematopoietic progenitors. Scand J Infect Dis Suppl 99:63–67. - PubMed
    1. Fishman JA. 2017. Infection in organ transplantation. Am J Transplant 17:856–879. 10.1111/ajt.14208. - DOI - PubMed

LinkOut - more resources