. 2021 Feb 9;217(2):iyaa038.
doi: 10.1093/genetics/iyaa038.

Genomic regions associated with microdeletion/microduplication syndromes exhibit extreme diversity of structural variation

Affiliations

Genomic regions associated with microdeletion/microduplication syndromes exhibit extreme diversity of structural variation

Yulia Mostovoy et al. Genetics. .

Abstract

Segmental duplications (SDs) are a class of long, repetitive DNA elements whose paralogs share a high level of sequence similarity with each other. SDs mediate chromosomal rearrangements that lead to structural variation in the general population as well as genomic disorders associated with multiple congenital anomalies, including the 7q11.23 (Williams-Beuren Syndrome, WBS), 15q13.3, and 16p12.2 microdeletion syndromes. Population-level characterization of SDs has generally been lacking because most techniques used for analyzing these complex regions are both labor and cost intensive. In this study, we have used a high-throughput technique to genotype complex structural variation with a single molecule, long-range optical mapping approach. We characterized SDs and identified novel structural variants (SVs) at 7q11.23, 15q13.3, and 16p12.2 using optical mapping data from 154 phenotypically normal individuals from 26 populations comprising five super-populations. We detected several novel SVs for each locus, some of which had significantly different prevalence between populations. Additionally, we localized the microdeletion breakpoints to specific paralogous duplicons located within complex SDs in two patients with WBS, one patient with 15q13.3, and one patient with 16p12.2 microdeletion syndromes. The population-level data presented here highlights the extreme diversity of large and complex SVs within SD-containing regions. The approach we outline will greatly facilitate the investigation of the role of inter-SD structural variation as a driver of chromosomal rearrangements and genomic disorders.

Keywords: genome mapping; genomic disorders; segmental duplications; structural variation.


Figures

Figure 1
Figure 1
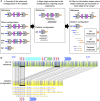
Optical mapping to genotype complex structural variation. (A) Cartoon example of the pipeline (i–iii). (i) Compilation of distinct configurations from all the assembled contigs in the full dataset. The cartoon locus depicted here includes inversions (inv), a duplication (dup), and a deletion (del). (ii) Alignment of single molecules from each sample to the full set of local configurations seen in (i) to determine genotype. The example shown here has single molecule support for the reference and deletion (del) configurations. (iii) Selection of informative molecules anchored in unique region flanking the repeat element. In the example shown here, Ac (A-centromeric) and At (A-telomeric) are the two paralogs of the duplicon marked by the gray arrow. The molecules labeled “Ac” and “At” cannot distinguish between the deletion and other configurations as they lack the full flanking context, so they cannot be used to confirm the deletion. The molecules labeled “Deletion” exclusively support the deletion configuration as they contain flanking region on both sides of the repeat element. (B) A real example showing a deletion configuration at 15q13.3. The top green bar represents the reference configuration, while the middle yellow bar represents the deletion configuration. Vertical tick marks represent label sites, and gray lines connecting ticks show where labels from the deletion configuration aligned to labels from the reference. The SD duplicon structure corresponding to the reference and deletion configurations are shown as colored arrows on the top and bottom of the figure, respectively. The yellow lines below the deletion configuration are single molecules spanning the deletion, with blue and cyan tick marks representing label sites that aligned or did not align to the deletion configuration, respectively. The black horizontal bars indicate the breakpoint region involved in the rearrangement, which molecules needed to span in order to support the deletion configuration.
Figure 2
Figure 2
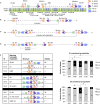
Structural variants (SVs) at 7q11.23. (A) The hg38 reference configuration of 7q11.23, showing duplicon positions and orientations for SD7-I and SD7-II. Paralogs are shown in the same color and are labeled, e.g., “Ac” and “At” for the centromeric and telomeric copies of duplicon A. A partial copy of the A-CNV is marked with parallel lines. Below the duplicons, the optical map of this region is shown as a green bar with BspQI labels shown in blue, followed by local genes. (B) A large inversion observed between SD7-I and SD7-II, with breakpoints within the “C-A-B” duplicon block. Right, a stacked bar graph showing the number of individuals carrying the large inversion allele or the reference configuration in each of the five populations covered in this study. (C) A small inversion observed between Bm and Bt in SD7-II. Bottom, a stacked bar graph showing the number of individuals carrying the small inversion or the reference configuration in each of the five populations. For (B) and (C), labels on the bars show the number of times a configuration was detected in each population; count labels of one or two are not shown. (D) A copy number variant observed in the A duplicon (A-CNV) flanked by the C and B duplicons in both SD7-I and SD7-II. Bottom, a bar plot depicting the full copy number alleles found in the A-CNV, including both the Ac and At copies. No significant population differences were observed for (B), (C), or (D) (B and C: pairwise Fisher’s exact test with Benjamini–Hochberg multiple testing correction; D: Wilcoxon rank-sum test with Benjamini–Hochberg multiple testing correction). In all SV diagrams, gray bars below the duplicons represent the critical regions that molecules needed to span in order to be informative for the configuration.
Figure 3
Figure 3
SVs at 15q13.3. (A) The hg38 reference configuration of 15q13.3, showing duplicon positions and orientations for SD15-I and SD15-II. Paralogs are shown in the same color and are labeled, e.g., “Ac” and “At” for the centromeric and telomeric copies of duplicon A. Gray arrows with different patterns mark the different unique regions flanking the SDs. Below the duplicons, the optical map of this region is shown as a green bar with BspQI labels shown in blue, followed by local genes. (B) Configurations anchored in the unique region either proximal or distal to SD15-I. Configurations were genotyped in three groups, G1, G2, and G3, using datasets labeled with the DLE-1 or the BspQI enzyme. For each genotyped sample, supporting molecules needed to span all of the duplicons and flanking unique regions depicted in the “structure” column. Right, stacked bar graphs showing the prevalence of configurations in the G1 (top) and G2 (bottom) groups for each of the five populations used in this study. Configuration G2-2 was significantly depleted in the EAS population compared to all other populations (P < 0.05, pairwise Fisher’s exact test with Benjamini–Hochberg multiple testing correction comparing G2-1 and G2-2). Labels on the bars show the number of times a configuration was detected in each population. Count labels of one or two are not shown. (C) Configurations anchored in the unique region either proximal or distal to SD15-II. The DLE-1 dataset contained molecules anchored within unique regions on both ends of SD15-II as well as molecules anchored only in the unique region proximal to SD15-II, while the BspQI dataset contained molecules anchored only in the unique region distal to SD15-II. Configurations were genotyped in one group, G4. Gray bars (top) indicate the proximal and distal critical regions: proximally anchored molecules extended at least to Bt, while distally anchored molecules extended at least to At. For (B) and (C), columns show the configuration IDs, their structure, and the number of alleles identified in our dataset with the indicated enzyme.
Figure 4
Figure 4
SVs at 16p12.2. (A) The hg38 reference configuration of 16p12.2, showing duplicon positions and orientations for SD16-I, SD16-II, and SD16-III. Paralogs are shown in the same color, and are labeled, e.g,. “At,” “Am,” and “Ac” for the telomeric, middle, and centromeric copies of duplicon A. Gray arrows with different patterns mark the different unique regions flanking the SDs. Below the duplicons, the optical map of this region is shown as a green bar with BspQI labels shown in blue, followed by local genes. (B) A large balanced inversion, “S1,” between At and Ac. (C) A large inversion with duplication, “S2.” Newly created duplicons are marked as, e.g., Cc′. (D) A small inverted insertion detected distal to SD16-A on the reference configuration, labeled “S3.” (E) Left, configurations genotyped in three groups, G1, G2, and G3, are shown. G1 configurations are anchored in the unique region proximal to SD16-I. G2 configurations are anchored in the green-blue duplicon pair that was not seen in the reference configuration. G3 configurations are anchored in the unique region distal to SD16-III. Columns depict the configuration ID, the longer haplotypes with which they are consistent (among the hg38 reference, S1, S2, and S3), the structure, and the number of alleles detected in the BspQI dataset. Supporting molecules for a given configuration had to span each of the depicted duplicons. Right, stacked bar graphs showing the prevalence of configurations from group G1 (top) and G3 (bottom) across the five populations included in this study. *P < 0.05, pairwise Fisher’s exact test with Benjamini–Hochberg multiple testing correction using the two most prevalent configurations in the group. Labels on the bars show the number of times a configuration was detected in each population. Count labels of 1 were not shown.
Figure 5
Figure 5
Breakpoint mapping in microdeletion patients. For each panel, the green bar (top) is the hg38 reference configuration of a given region, while the yellow bar (bottom) is the configuration of the deletion observed in the patient. Yellow bars in (A–C) depict assembled contigs while the yellow bar in (D) depicts a molecule. Red filled-in triangles indicate the region deleted in patients. Duplicon structures for the reference and deleted configurations are depicted above and below the bars, respectively. (A) Patient 1 with 7q11.23 deletion. (B) Patient 2 with 7q11.23 deletion. (C) Patient with 15q13.3 deletion. (D) Patient with 16p12.2 deletion.

Similar articles

Cited by

References

    1. Alsmadi O, John SE, Thareja G, Hebbar P, Antony D, et al. 2014. Genome at juncture of early human migration: a systematic analysis of two whole genomes and thirteen exomes from Kuwaiti population subgroup of inferred Saudi Arabian tribe ancestry. PLoS One. 9:e99069. - PMC - PubMed
    1. Amos-Landgraf JM, Ji Y, Gottlieb W, Depinet T, Wandstrat AE, et al. 1999. Chromosome breakage in the Prader-Willi and Angelman syndromes involves recombination between large, transcribed repeats at proximal and distal breakpoints. Am J Hum Genet. 65:370–386. - PMC - PubMed
    1. Antonacci F, Dennis MY, Huddleston J, Sudmant PH, Steinberg KM, et al. 2014. Palindromic GOLGA8 core duplicons promote chromosome 15q13.3 microdeletion and evolutionary instability. Nat Genet. 46:1293–1302. - PMC - PubMed
    1. Antonacci F, Kidd JM, Marques-Bonet T, Teague B, Ventura M, et al. 2010. A large and complex structural polymorphism at 16p12.1 underlies microdeletion disease risk. Nat Genet. 42:745–750. - PMC - PubMed
    1. Antonell A, de Luis O, Domingo-Roura X, Perez-Jurado LA. 2005. Evolutionary mechanisms shaping the genomic structure of the Williams-Beuren syndrome chromosomal region at human 7q11.23. Genome Res. 15:1179–1188. - PMC - PubMed

Publication types

MeSH terms

Supplementary concepts