T cell and antibody kinetics delineate SARS-CoV-2 peptides mediating long-term immune responses in COVID-19 convalescent individuals
- PMID: 33723016
- PMCID: PMC8128286
- DOI: 10.1126/scitranslmed.abf7517
T cell and antibody kinetics delineate SARS-CoV-2 peptides mediating long-term immune responses in COVID-19 convalescent individuals
Abstract
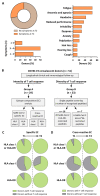
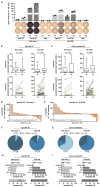
Long-term immunological memory to severe acute respiratory syndrome coronavirus 2 (SARS-CoV-2) is crucial for the development of population-level immunity, which is the aim of vaccination approaches. Reports on rapidly decreasing antibody titers have led to questions regarding the efficacy of humoral immunity alone. The relevance of T cell memory after coronavirus disease 2019 (COVID-19) remains unclear. Here, we investigated SARS-CoV-2 antibody and T cell responses in matched samples of COVID-19 convalescent individuals up to 6 months after infection. Longitudinal analysis revealed decreasing and stable spike- and nucleocapsid-specific antibody responses, respectively. In contrast, functional T cell responses remained robust, and even increased, in both frequency and intensity. Single peptide mapping of T cell diversity over time identified open reading frame-independent, dominant T cell epitopes mediating long-term SARS-CoV-2 T cell responses. Identification of these epitopes may be fundamental for COVID-19 vaccine design.
Copyright © 2021 The Authors, some rights reserved; exclusive licensee American Association for the Advancement of Science. No claim to original U.S. Government Works. Distributed under a Creative Commons Attribution License 4.0 (CC BY).
Figures


Similar articles
-
Identification of SARS-CoV-2 Nucleocapsid and Spike T-Cell Epitopes for Assessing T-Cell Immunity.J Virol. 2021 Feb 24;95(6):e02002-20. doi: 10.1128/JVI.02002-20. Print 2021 Feb 24. J Virol. 2021. PMID: 33443088 Free PMC article.
-
CD8+ T cells specific for an immunodominant SARS-CoV-2 nucleocapsid epitope display high naive precursor frequency and TCR promiscuity.Immunity. 2021 May 11;54(5):1066-1082.e5. doi: 10.1016/j.immuni.2021.04.009. Epub 2021 Apr 15. Immunity. 2021. PMID: 33951417 Free PMC article.
-
Robust and Functional Immune Memory Up to 9 Months After SARS-CoV-2 Infection: A Southeast Asian Longitudinal Cohort.Front Immunol. 2022 Feb 3;13:817905. doi: 10.3389/fimmu.2022.817905. eCollection 2022. Front Immunol. 2022. PMID: 35185909 Free PMC article.
-
The potential clinical utility of measuring severe acute respiratory syndrome coronavirus 2-specific T-cell responses.Clin Microbiol Infect. 2021 Dec;27(12):1784-1789. doi: 10.1016/j.cmi.2021.07.005. Epub 2021 Jul 10. Clin Microbiol Infect. 2021. PMID: 34256141 Free PMC article. Review.
-
Immune response in COVID-19: What do we currently know?Microb Pathog. 2020 Nov;148:104484. doi: 10.1016/j.micpath.2020.104484. Epub 2020 Sep 9. Microb Pathog. 2020. PMID: 32916246 Free PMC article. Review.
Cited by
-
Clonal diversity predicts persistence of SARS-CoV-2 epitope-specific T-cell response.Commun Biol. 2022 Dec 9;5(1):1351. doi: 10.1038/s42003-022-04250-7. Commun Biol. 2022. PMID: 36494499 Free PMC article.
-
Immunogenicity and safety of booster dose of S-268019-b or BNT162b2 in Japanese participants: An interim report of phase 2/3, randomized, observer-blinded, noninferiority study.Vaccine. 2022 Jul 30;40(32):4328-4333. doi: 10.1016/j.vaccine.2022.06.032. Epub 2022 Jun 21. Vaccine. 2022. PMID: 35738968 Free PMC article. Clinical Trial.
-
T cell perturbations persist for at least 6 months following hospitalization for COVID-19.Front Immunol. 2022 Aug 8;13:931039. doi: 10.3389/fimmu.2022.931039. eCollection 2022. Front Immunol. 2022. PMID: 36003367 Free PMC article.
-
Ingestion of beta-glucans could stimulate longer-lasting cellular immunity upon administration of COVID-19 vaccines.J Food Biochem. 2021 Nov;45(11):e13959. doi: 10.1111/jfbc.13959. Epub 2021 Oct 5. J Food Biochem. 2021. PMID: 34608650 Free PMC article. No abstract available.
-
The Polarity and Specificity of Antiviral T Lymphocyte Responses Determine Susceptibility to SARS-CoV-2 Infection in Patients with Cancer and Healthy Individuals.Cancer Discov. 2022 Apr 1;12(4):958-983. doi: 10.1158/2159-8290.CD-21-1441. Cancer Discov. 2022. PMID: 35179201 Free PMC article.
References
-
- Tang F., Quan Y., Xin Z. T., Wrammert J., Ma M. J., Lv H., Wang T. B., Yang H., Richardus J. H., Liu W., Cao W. C., Lack of peripheral memory B cell responses in recovered patients with severe acute respiratory syndrome: A six-year follow-up study. J. Immunol. 186, 7264–7268 (2011). 10.4049/jimmunol.0903490 - DOI - PubMed
-
- Kreer C., Zehner M., Weber T., Ercanoglu M. S., Gieselmann L., Rohde C., Halwe S., Korenkov M., Schommers P., Vanshylla K., Di Cristanziano V., Janicki H., Brinker R., Ashurov A., Krähling V., Kupke A., Cohen-Dvashi H., Koch M., Eckert J. M., Lederer S., Pfeifer N., Wolf T., Vehreschild M. J. G. T., Wendtner C., Diskin R., Gruell H., Becker S., Klein F., Longitudinal Isolation of Potent Near-Germline SARS-CoV-2-Neutralizing Antibodies from COVID-19 Patients. Cell 182, 843–854.e12 (2020). 10.1016/j.cell.2020.06.044 - DOI - PMC - PubMed
-
- Rodda L. B., Netland J., Shehata L., Pruner K. B., Morawski P. A., Thouvenel C. D., Takehara K. K., Eggenberger J., Hemann E. A., Waterman H. R., Fahning M. L., Chen Y., Hale M., Rathe J., Stokes C., Wrenn S., Fiala B., Carter L., Hamerman J. A., King N. P., Gale M. Jr., Campbell D. J., Rawlings D. J., Pepper M., Functional SARS-CoV-2-Specific Immune Memory Persists after Mild COVID-19. Cell 184, 169–183.e17 (2021). 10.1016/j.cell.2020.11.029 - DOI - PMC - PubMed
Publication types
MeSH terms
Substances
LinkOut - more resources
Full Text Sources
Other Literature Sources
Medical
Miscellaneous

