. 2021 Jun:42:101928.
doi: 10.1016/j.redox.2021.101928. Epub 2021 Mar 5.

PARP inhibition promotes ferroptosis via repressing SLC7A11 and synergizes with ferroptosis inducers in BRCA-proficient ovarian cancer

Affiliations

PARP inhibition promotes ferroptosis via repressing SLC7A11 and synergizes with ferroptosis inducers in BRCA-proficient ovarian cancer

Ting Hong et al. Redox Biol. 2021 Jun.

Abstract

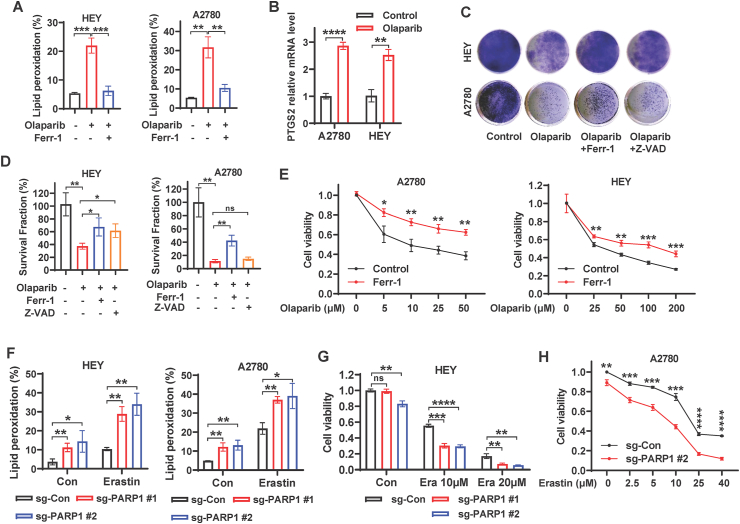
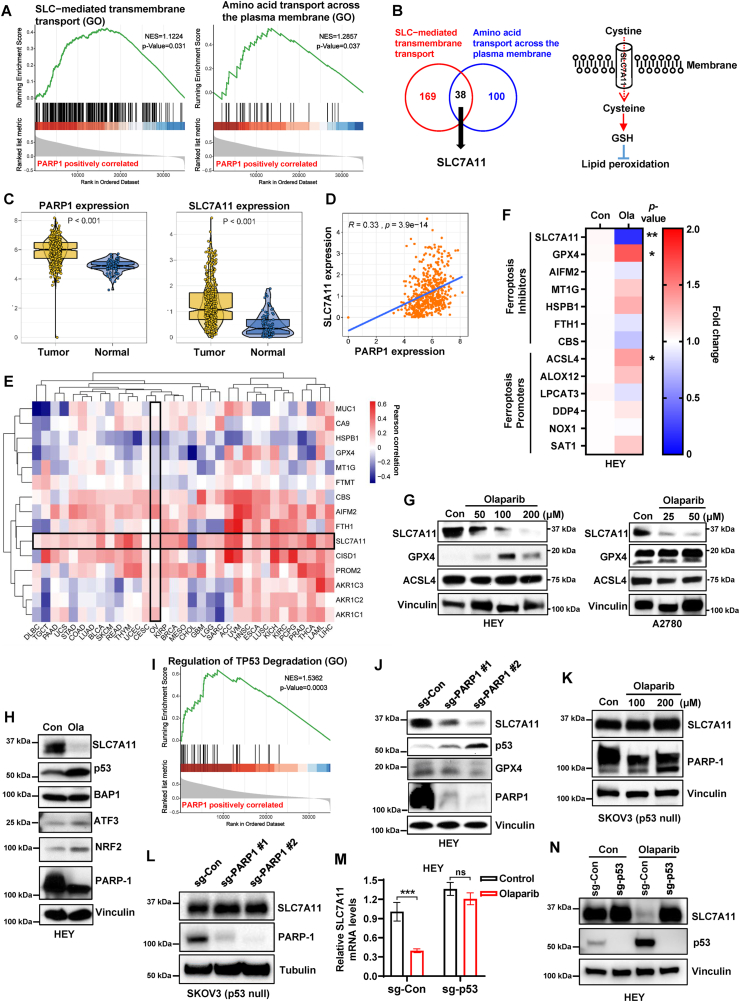
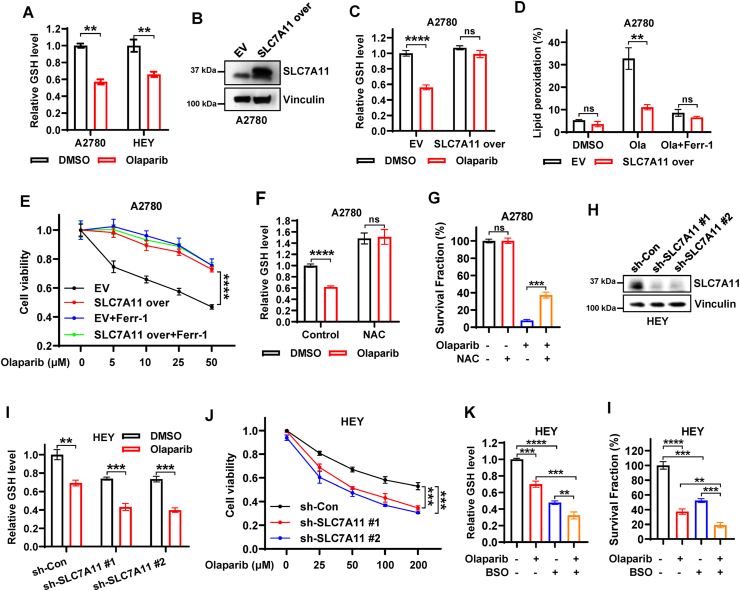
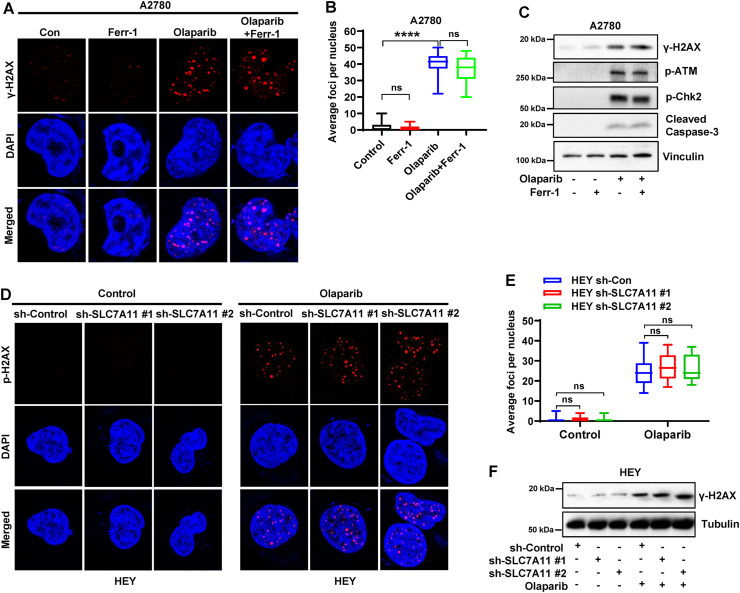
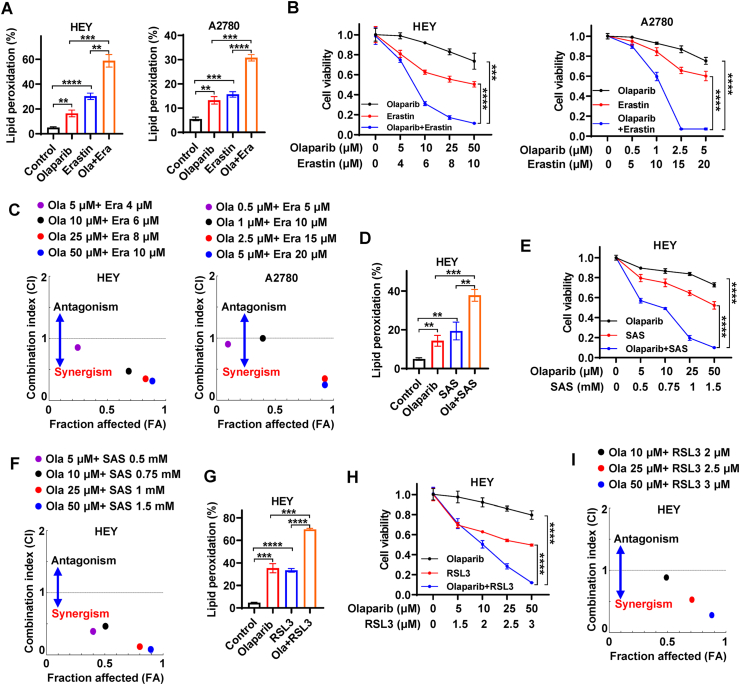
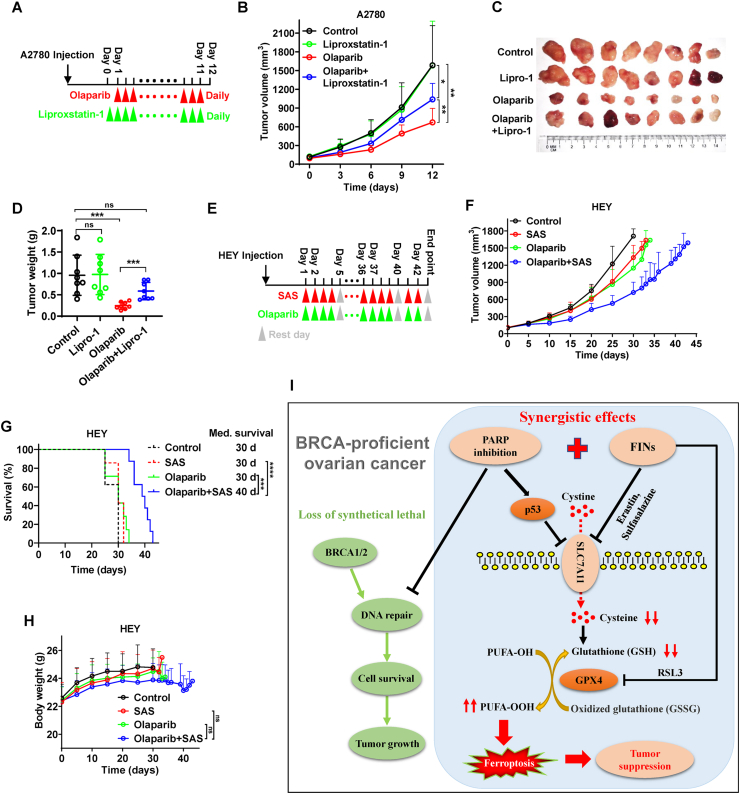
Pharmacologic inhibition of PARP is the primary therapeutic strategy for BRCA mutant ovarian cancer. However, most of patients carry wild-type BRCA1/2 with no significant clinical benefits from PARP inhibitors, calling for the needs to further understanding and developing new strategy when employing PARP inhibitors to treat ovarian cancer. Here, we show that ferroptosis, a form of regulated cell death driven by iron-dependent phospholipid peroxidation, is partly responsible for the efficacy of PARP inhibitor olaparib. Mechanistically, pharmacological inhibition or genetic deletion of PARP downregulates the expression of cystine transporter SLC7A11 in a p53-dependent manner. Consequently, decreased glutathione biosynthesis caused by SLC7A11 repression promotes lipid peroxidation and ferroptosis. Furthermore, ferroptosis perturbation results in significant resistance to olaparib without affecting DNA damage response, while boosting ferroptosis by ferroptosis inducers (FINs) synergistically sensitizes BRCA-proficient ovarian cancer cells and xenografts to PARP inhibitor. Together, our results reveal a previously unappreciated mechanism coupling ferroptosis to PARP inhibition and suggest the combination of PARP inhibitor and FINs in the treatment of BRCA-proficient ovarian cancer.

Keywords: Ferroptosis; Lipid peroxidation; Ovarian cancer; PARP; SLC7A11.


Conflict of interest statement

No competing interests.

Figures

Image 1
Graphical abstract
Fig. 1
Fig. 1
PARP inhibition induces ferroptosis in ovarian cancer cells. A Lipid peroxidation levels in HEY and A2780 cells treated with DMSO or olaparib (25 μM for HEY, 5 μM for A2780) or olaparib in combination with ferrostatin-1 (5 μM) for 48 h. B mRNA levels of PTGS2 in A2780 and HEY cells treated with DMSO or olaparib (25 μM for HEY, 5 μM for A2780) for 48 h. C Representative images of clonogenic assay in HEY and A2780 cells treated with DMSO, or olaparib (20 μM for HEY, 10 μM for A2780), or olaparib in combination with ferrostatin-1 (5 μM) or Z-VAD (10 μM). D Quantification of clonogenic survival fractions in HEY and A2780 cells subjected to the indicated treatments. E Cell viability in A2780 and HEY cells treated with indicated concentrations of olaparib with or without ferrostatin-1 (5 μM). F Lipid peroxidation levels in sg-control and sg-PARP1 HEY/A2780 cells treated with DMSO or erastin (HEY, 2.5 μM, 24 h; A2780, 10 μM, 48 h). G-H Cell viability in sg-control and sg-PARP1 HEY/A2780 cells treated with DMSO or indicated concentrations of erastin for 24 (HEY) or 48 (A2780) hours. Data are presented as representative images or as mean ± SD from three independent repeats. Statistical analysis was conducted using 2-tailed unpaired Student t-test.
Fig. 2
Fig. 2
PARP inhibition represses SLC7A11 expression in a p53-dependent manner. A Gene set enrichment pathway analysis (GSEA) showing the significant enrichment of the Gene Ontology (GO) gene sets involving “SLC−mediated transmembrane transport” and “Amino acid transport across the plasma membrane” in PARP1-regulated genes in TCGA ovarian cancer database. B Left panel, the overlap between 169 PARP1-related genes with gene set “SLC−mediated transmembrane transport” and 100 PARP1-related genes with gene set “Amino acid transport across the plasma membrane” in TCGA ovarian cancer database. Right panel, simplified schematic representation of SLC7A11 functioning as a cystine transporter. C Expression levels of PARP1 (left panel) or SLC7A11 (right panel) comparison between ovarian tumor samples and normal tissues from the TCGA and GTEx databases. D Correlation between PARP1 and SLC7A11 expression in ovarian tumor samples and normal tissues in TCGA and GTEx databases. R, Pearson correlation coefficient. E Heatmap showing the Pearson's correlation between expression of PARP1 and ferroptosis-related genes in 33 cancer types from TCGA. The cancer types (in columns) and indicated genes (in rows) are arranged by hierarchical clustering. F Heatmap showing relative mRNA expression of indicated ferroptosis regulators in HEY cells treated with DMSO or olaparib (100 μM) for 48 h. G Protein levels of SLC7A11, GPX4 and ACSL4 were analyzed by western blotting in A2780 and HEY cells treated with DMSO or the indicated concentrations of olaparib for 48 h. H Protein levels of indicated genes were analyzed by western blotting in HEY cells treated with DMSO or olaparib (100 μM) for 48 h. I Gene set enrichment pathway analysis (GSEA) showing the significant enrichment of the Gene Ontology (GO) gene set “Regulation of TP53 Degradation” in PARP1-regulated genes in TCGA ovarian cancer database. J Protein levels of SLC7A11, p53, GPX4 and PARP1 were analyzed by western blotting in sg-control and sg-PARP1 HEY cells. K Protein levels of SLC7A11 and PARP1 were analyzed by western blotting in SKOV3 cells treated with DMSO or indicated concentrations of olaparib for 48 h. L Protein levels of SLC7A11 and PARP1 were analyzed by western blotting in sg-control and sg-PARP1 SKOV3 cells. M mRNA levels of SLC7A11 in sg-control and sg-p53 HEY cells treated with DMSO or olaparib (100 μM) for 48 h. N Protein levels of SLC7A11 and p53 were analyzed by western blotting in sg-control and sg-p53 HEY cells treated with DMSO or olaparib (100 μM) for 48 h. Data are presented as representative images or as mean ± SD from three independent repeats. Statistical analysis was conducted using 2-tailed unpaired Student t-test in c, f, and m. Pearson's correlation (two-sided) analysis was used in d and e.
Fig. 3
Fig. 3
Olaparib promotes ferroptosis partially through suppressing SLC7A11-mediated GSH synthesis. A Relative glutathione levels in A2780 and HEY cells treated with DMSO or olaparib (50 μM for HEY, 25 μM for A2780). B The expression of SLC7A11 was examined by western blotting in A2780 cells stably expressing empty vector (EV) or SLC7A11. C Relative glutathione levels in EV- and SLC7A11-expressing A2780 cells treated with DMSO or olaparib (25 μM). D Lipid peroxidation levels in EV- and SLC7A11-expressing A2780 cells treated with DMSO or olaparib (5 μM) or olaparib in combination with ferrostatin-1 (5 μM) for 48 h. E Cell viability in EV- and SLC7A11-expressing A2780 cells treated with indicated concentrations of olaparib with or without ferrostatin-1 (5 μM). F Relative glutathione levels in A2780 cells treated with DMSO or NAC (5 mM) or olaparib (25 μM) or olaparib in combination with NAC. G Quantification of clonogenic survival fractions in A2780 cells treated with DMSO or NAC (5 mM) or olaparib (10 μM) or olaparib in combination with NAC. H The knockdown efficiency of sh-SLC7A11 in HEY cells was examined by western blotting. i Relative glutathione levels in sh-control and sh-SLC7A11 HEY cells treated with DMSO or olaparib (50 μM). J Cell viability in sh-control and sh-SLC7A11 HEY cells treated with indicated concentrations of olaparib for 48 h. K Relative glutathione levels in HEY cells treated with DMSO or olaparib or BSO or olaparib in combination with BSO. I Quantification of clonogenic survival fractions in HEY cells treated with DMSO or olaparib or BSO or olaparib in combination with BSO. Data are presented as representative images or as mean ± SD from three independent repeats. Statistical analysis was conducted using 2-tailed unpaired Student t-test.
Fig. 4
Fig. 4
DNA damage response is not involved in ferroptosis-mediated efficacy of olaparib. A Representative immunofluorescence images of γ-H2AX foci in A2780 cells treated with DMSO or ferrostatin-1 (5 μM) or olaparib (5 μM) or olaparib in combination with ferrostatin-1 for 48 h. B Quantification of γ-H2AX foci in each nucleus based on immunofluorescence in A2780 cells subjected to the indicated treatments for 48 h. C Protein levels of indicated regulators of DNA damage response were analyzed by western blotting in A2780 cells treated with DMSO or ferrostatin-1 (5 μM) or olaparib (5 μM) or olaparib in combination with ferrostatin-1 for 48 h. D Representative immunofluorescence images of γ-H2AX foci in sh-control and sh-SLC7A11 HEY cells treated with DMSO or olaparib (25 μM) for 48 h. E Quantification of γ-H2AX foci in each nucleus based on immunofluorescence in sh-control and sh-SLC7A11 HEY cells subjected to the indicated treatments for 48 h. F Protein levels of γ-H2AX were analyzed by western blotting in sh-control and sh-SLC7A11 HEY cells treated with DMSO or olaparib (25 μM) for 48 h. Data are presented as representative images or as mean ± SD from twenty independent repeats. Statistical analysis was conducted using 2-tailed unpaired Student t-test.
Fig. 5
Fig. 5
FINs synergistically sensitize BRCA proficient ovarian cancer cells to olaparib. A Lipid peroxidation levels in HEY and A2780 cells treated with DMSO or olaparib (10 μM) or erastin (6 μM) or olaparib in combination with erastin. B Cell viability in HEY and A2780 cells treated with olaparib and/or erastin at indicated concentrations. C The Chou-Talalay plot showing the combination effect of indicated treatments. The purple or black or red or blue dots in the plot represent the combination of olaparib and erastin at indicated concentrations. CI values less than, equal to, or greater than 1 indicate synergistic, additive, or antagonistic effects, respectively. D Lipid peroxidation levels in HEY cells treated with DMSO or olaparib (10 μM) or sulfasalazine (0.75 mM) or olaparib in combination with sulfasalazine. E Cell viability in HEY cells treated with olaparib and/or sulfasalazine at indicated concentrations. F The Chou-Talalay plot showing the combination effect of indicated treatments. The purple or black or red or blue dots in the plot represent the combination of olaparib and sulfasalazine at indicated concentrations. CI values less than, equal to, or greater than 1 indicate synergistic, additive, or antagonistic effects, respectively. G Lipid peroxidation levels in HEY cells treated with DMSO or olaparib (50 μM) or RSL3 (3 μM) or olaparib in combination with RSL3. H Cell viability in HEY cells treated with olaparib and/or RSL3 at indicated concentrations. I The Chou-Talalay plot showing the combination effect of indicated treatments. The black or red or blue dots in the plot represent the combination of olaparib and RSL3 at indicated concentrations. CI values less than, equal to, or greater than 1 indicate synergistic, additive, or antagonistic effects, respectively. Data are presented as representative images or as mean ± SD from three independent repeats. Statistical analysis was conducted using 2-tailed unpaired Student t-test. Data are presented as representative images or as mean ± SD from twenty independent repeats. Statistical analysis was conducted using 2-tailed unpaired Student t-test. . (For interpretation of the references to colour in this figure legend, the reader is referred to the Web version of this article.)
Fig. 6
Fig. 6
Ferroptosis correlates with olaparib-mediated tumor suppression in vivo. A Treatment schema for nude mice bearing A2780 xenograft. Liproxstatin-1 treatment initiated on day 0 and was administered daily until experimental endpoints. Olaparib treatment initiated on day 1 and was administered daily until experimental endpoints. B Volume of A2780 xenografts treated with olaparib and/or liproxstatin-1 at different time points. Error bars are presented as mean ± SD from 8 independent repeats. P values determined using 2-way ANOVA. C Representative images of A2780 xenograft tumors treated with olaparib and/or liproxstatin-1 at experimental endpoints. D Weights of A2780 xenograft tumors treated with olaparib and/or liproxstatin-1 at different time points. Error bars are presented as mean ± SD from 8 independent repeats. P values calculated using 2-tailed unpaired Student t-test. E Treatment schema for nude mice bearing HEY xenograft. Olaparib and/or sulfasalazine treatment initiated on day 1, and every 5 days was a treatment cycle until experimental endpoints, in which drug treatment was administered daily for the first 4 days, and the last day is a rest day. F Volume of HEY xenografts treated with olaparib and/or sulfasalazine at different time points. 8 mice per group at the beginning and error bars are presented as mean ± SD. P values determined using 2-way ANOVA. G Kaplan–Meier survival curves of nude mice bearing HEY xenograft treated with olaparib and/or sulfasalazine. P values calculated by log-rank test. H Body weights of nude mice bearing HEY xenograft treated with olaparib and/or sulfasalazine. P values calculated by 2-tailed unpaired Student's t-test. I The working model depicting the role of ferroptosis in PARP inhibition-mediated tumor suppression in BRCA-proficient ovarian cancer. BRCA proficient ovarian cancers are resistant to PARP inhibition due to the inability to efficiently induce DNA damage, while PARP inhibition can activate p53 to repress SLC7A11 expression, leading to a decrease in GSH levels, thereby promoting ferroptosis. On this basis, PARP inhibitors in combination with FINS targeting SLC7A11 or GPX4 synergistically augment ferroptosis, resulting in potent tumor suppression in BRCA-proficient ovarian cancer.

Similar articles

Cited by

References

    1. Krishnakumar R., Kraus W.L. The PARP side of the nucleus: molecular actions, physiological outcomes, and clinical targets. Mol. Cell. 2010;39:8–24. - PMC - PubMed
    1. Chaitanya G.V., Alexander J.S., Babu P.P. PARP-1 cleavage fragments: signatures of cell-death proteases in neurodegeneration. Cell Commun. Signal. 2010;8:31. - PMC - PubMed
    1. Chiu L.-Y., Ho F.-M., Shiah S.-G., Chang Y., Lin W.-W. Oxidative stress initiates DNA damager MNNG-induced poly (ADP-ribose) polymerase-1-dependent parthanatos cell death. Biochem. Pharmacol. 2011;81:459–470. - PubMed
    1. Bai P., Cantó C. The role of PARP-1 and PARP-2 enzymes in metabolic regulation and disease. Cell Metabol. 2012;16:290–295. - PubMed
    1. Gibson B.A., Kraus W.L. New insights into the molecular and cellular functions of poly (ADP-ribose) and PARPs. Nat. Rev. Mol. Cell Biol. 2012;13:411–424. - PubMed

Publication types

Substances