. 2021 Feb 16;24(3):102196.
doi: 10.1016/j.isci.2021.102196. eCollection 2021 Mar 19.

Impaired phosphatidylethanolamine metabolism activates a reversible stress response that detects and resolves mutant mitochondrial precursors

Affiliations

Impaired phosphatidylethanolamine metabolism activates a reversible stress response that detects and resolves mutant mitochondrial precursors

Pingdewinde N Sam et al. iScience. .

Abstract

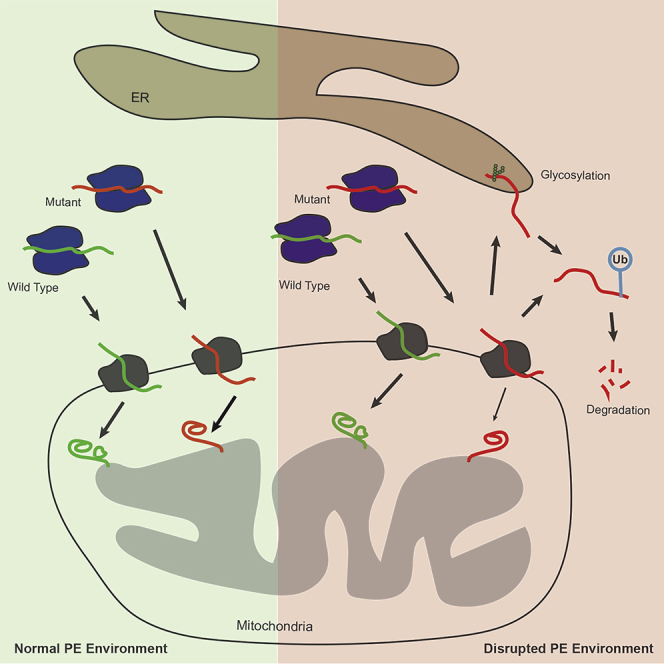
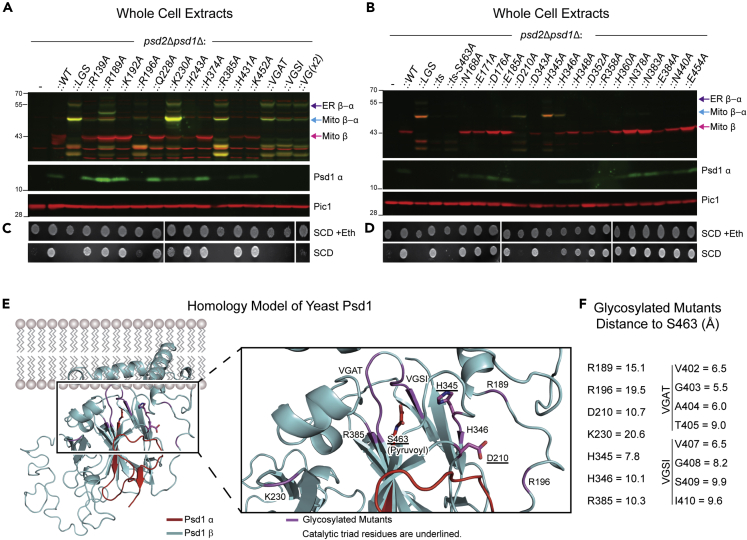
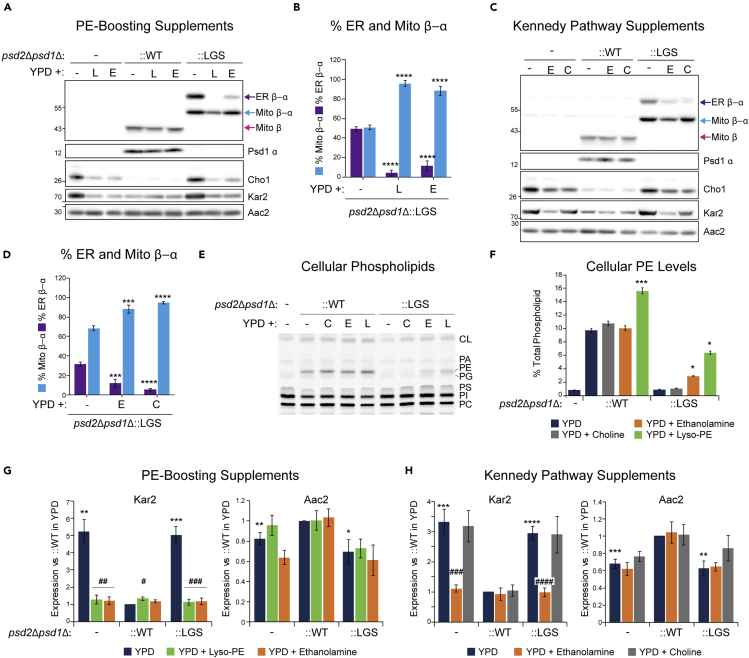
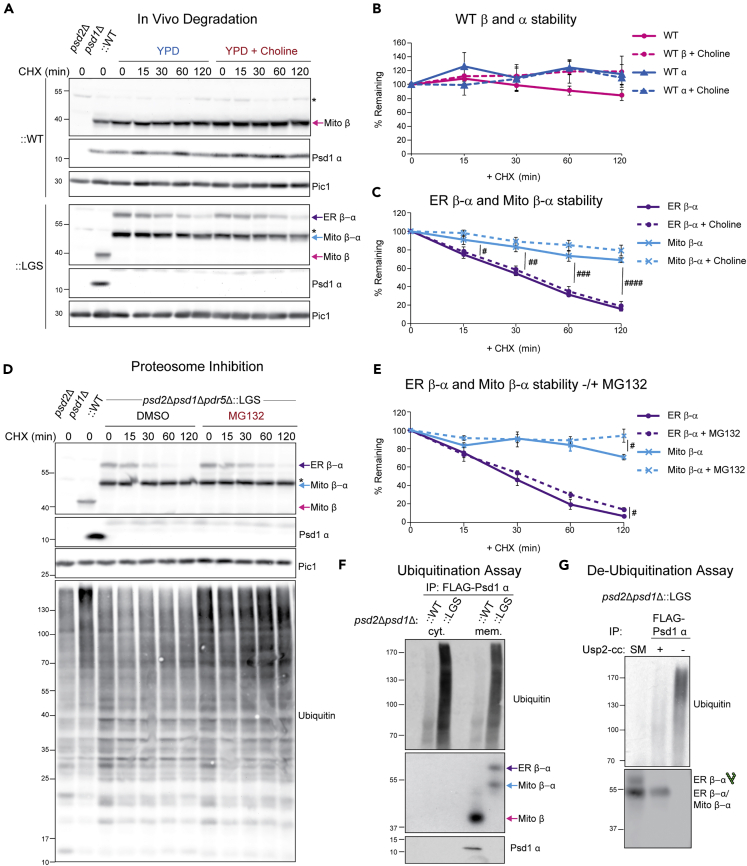
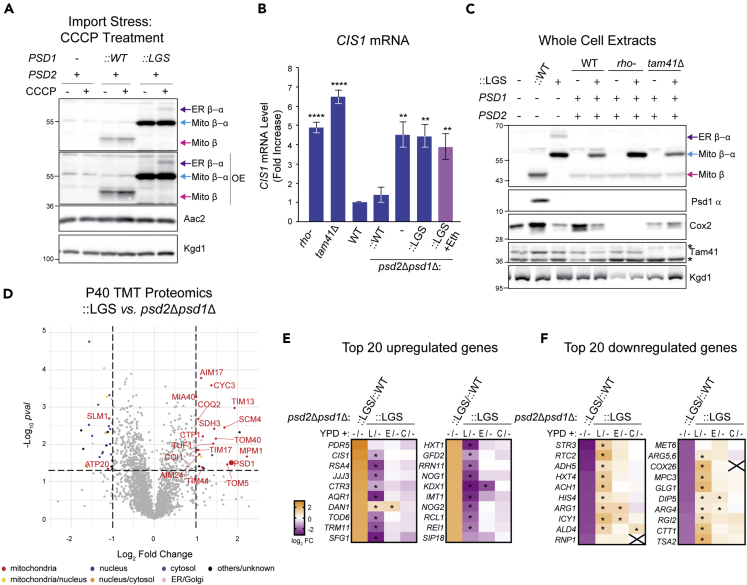
Phosphatidylethanolamine (PE) made in mitochondria has long been recognized as an important precursor for phosphatidylcholine production that occurs in the endoplasmic reticulum (ER). Recently, the strict mitochondrial localization of the enzyme that makes PE in the mitochondrion, phosphatidylserine decarboxylase 1 (Psd1), was questioned. Since a dual localization of Psd1 to the ER would have far-reaching implications, we initiated our study to independently re-assess the subcellular distribution of Psd1. Our results support the unavoidable conclusion that the vast majority, if not all, of functional Psd1 resides in the mitochondrion. Through our efforts, we discovered that mutant forms of Psd1 that impair a self-processing step needed for it to become functional are dually localized to the ER when expressed in a PE-limiting environment. We conclude that severely impaired cellular PE metabolism provokes an ER-assisted adaptive response that is capable of identifying and resolving nonfunctional mitochondrial precursors.

Keywords: Cell Biology; Molecular Physiology; Proteomics.


Conflict of interest statement

The authors declare no competing interests.

Figures

None
Graphical abstract
Figure 1
Figure 1
Endogenous and overexpressed Psd1 is localized to mitochondria (A) Psd1 detection range was determined for antisera raised in two rabbits 4,077 (green) and 4,078 (blue) using a standard curve of recombinant Psd1. Bleeds number 4 and 5 were analyzed, respectively. The amount of Psd1 detected in WT mitochondria was calculated (n = 3). (B) Cell extracts derived from pairs of WT and psd1Δ yeast of the indicated backgrounds grown at 30°C in synthetic complete dextrose (SCD) were treated with EndoH as listed and analyzed by immunoblot using the designated anti-Psd1 antisera; Aac2 served as loading control. psd2Δpsd1Δ yeast stably transformed with WT (::WT) or ER-targeted Psd1 (::ER-Psd1) acted as overexpression and glycosylation controls, respectively. Due to its high relative expression, different exposures of ::ER-Psd1 are shown versus all other samples (indicated by frames) which were resolved on the same gel (n = 3). (C) Following growth in SCD medium to late log phase, fractions were collected from the indicated yeast strains by differential gravity centrifugation. Equal protein amounts from each collected fraction were resolved by SDS-PAGE and immunoblotted for Psd1 and mitochondrial (Qcr6), ER (Sec62), and cytosolic (Hsp70) markers. SM, starting material, P13, pellet of 13,000xg; P21, pellet of 21,000xg; P40, pellet of 40,000xg; and S40, supernatant of 40,000xg (n = 3). (D) Mitochondria (P13) and ER (P40) fractions were mock or EndoH treated prior to immunoblot analysis (n = 3). (E) Tandem mass tag (TMT) comparison of ER (P40) proteomes from psd2Δpsd1Δ (n = 3 preps) and psd2Δpsd1Δ::WT yeast (n = 4 preps). (F) Representative images of HEK293 cells overexpressing FLAG-tagged WT PISD obtained via immunofluorescence to visualize PISD (anti-FLAG; green), mitochondria (anti-TOMM20; red), and ER (anti-calnexin; gray). Bottom panels are a magnification of the white-boxed areas shown in the upper panel. Intensity profile for PISD (green), mitochondria (red), and ER (gray) along the pixels indicated by a solid white line. Scale bars, 5 μm.
Figure 2
Figure 2
Re-localized Psd1 constructs are stable and functional (A) Schematic of chimeric constructs. MTS (mitochondrial targeting signal) and TM (transmembrane domain) of residues are indicated. Psd subunits β, α, and LGS motif are shown. All constructs have a 3XFLAG tag at the C-terminus. (B) The indicated strains were pre-cultured at 30°C in YPD, and after isolation of whole-cell extracts, the α and β subunits of Psd1 were analyzed by immunoblotting. Pic1 served as a loading control (n = 3). (C) The indicated strains pre-cultured at 30°C in YPD were spotted onto SCD with (+) or without (−) 2 mM ethanolamine and incubated at 30°C for 3 days (n = 3). (D) Mitochondrial phospholipids from the indicated strains were labeled overnight in rich lactate medium spiked with 32Pi and separated by TLC. The migration of phosphatidylcholine (PC), phosphatidylinositol (PI), PS, phosphatidylglycerol (PG), PE, phosphatidic acid (PA), and CL is indicated (n = 6). (E) The relative abundance of PE was determined for each strain (mean ± SEM for n = 6). Statistical differences (2 symbols p ≤ 0.01; 3 symbols p ≤ 0.001 compared to ::WT (∗) or psd2Δpsd1Δ (#)) were calculated by unpaired Student's t-test (for both ::Yme1 comparisons) or Mann-Whitney rank-sum test (all the rest). (F) Serial dilutions of the indicated strains were spotted onto SCD with or without 2 mM ethanolamine, synthetic complete lactate (SC Lactate), or synthetic complete ethanol-glycerol (SCEG) plates and incubated at 30°C or 37°C for the indicated duration (n = 3).
Figure 3
Figure 3
Glycosylation of endogenous and overexpressed mutant, nonfunctional Psd1 requires severe disruption of cellular PE metabolism (A) Cell extracts from the indicated strains grown at 30°C in YPD were treated with EndoH as listed and analyzed by immunoblot using the designated anti-Psd1 antisera; Aac2 served as loading control. ER β-α, glycosylated mutant Psd1; Mito β-α, mutant Psd1 not glycosylated (n = 3). (B) TMT comparison of ER (P40) proteomes from psd2Δpsd1Δ::LGS (n = 3 preps) and psd2Δpsd1Δ::WT yeast (n = 4 preps). LGS; autocatalytic mutant Psd1. (C) Cell extracts from the indicated strains grown at 30°C in YPD were immunoblotted for the Psd1 β subunit; Kgd1, Aac2, and Qcr6 served as loading controls. LGS was knocked into endogenous PSD1 of the listed strains via Hi-CRISPR (n = 3). (D) Serial dilutions of same strains as in (C) were spotted onto SCD with or without 2 mM ethanolamine (+Eth) and incubated at 30°C for 3 days (n = 3). (E) EndoH sensitivity assay of cell extracts from indicated strains grown in YPD at 30°C. Immunoblots were probed for Psd1 β (4,077.4) and Psd1 α (FLAG); Pic1 served as loading control (n = 3). (F) PSD1 mRNA level in the indicated strains determined by two-step reverse transcription-quantitative PCR of PSD1 and normalized to ACT1 (means ± SEM, n = 4). Statistical differences (1 symbol, p ≤ 0.05; 2 symbols p ≤ 0.01; 3 symbols p ≤ 0.001 compared WT (PSD2 +, PSD1 +) were calculated with unpaired Student's t-test. (G) Mitochondrial phospholipids from the indicated strains were labeled overnight in YPD medium spiked with 14C-Acetate and separated by TLC (n = 6). (H) Cell extracts derived from the indicated strains grown at 30°C in YPD were analyzed by immunoblot for Psd1 β (4,077.4), Psd1 α (FLAG), Cho1 (PS synthase), and Kar2 (ER chaperone); Aac2 acted as loading control (n = 5). (I) The relative abundance of ER β-α and Mito β-α in LGS mutant Psd1 expressing yeast of the indicated genotype was determined (means ± SEM for n = 5). Statistical differences (2 symbols p 0.01; 4 symbols p ≤ 0.0001) were determined by one-way analysis of variance (ANOVA) with Dunnett's multiple comparison test.
Figure 4
Figure 4
Mutations that indirectly impair autocatalysis are also glycosylated (A and B) Cell extracts derived from the indicated strains grown at 30°C in YPD were analyzed by fluorescent immunoblot for Psd1 β (red) and Psd1 α (green); Pic1 acted as loading control (n = 3). (C and D) The same strains in (A and B) were pre-cultured at 30°C in YPD, spotted onto SCD with (+) or without (−) 2 mM ethanolamine and incubated at 30°C for 3 days (n = 3). (E) Homology model structure of Psd1 based on the E. coli PSD structure (PDB code: 6L06)—view from the side of membrane. The α subunit and β subunit are colored in red and cyan, respectively. The right panel is a magnified view around S463 (pyruvoyl group at N-terminus of α subunit). Residues whose mutation to alanine impairs autocatalysis are indicated and colored in magenta. Autocatalytic triad residues are underlined and shown in stick form. (F) The distances were measured between the carbonyl carbon of the pyruvoyl group (S463) and the alpha carbon of the residues whose mutation to alanine impairs autocatalysis.
Figure 5
Figure 5
Supplements for distinct ER-resident phospholipid biosynthetic pathways decrease accumulation of glycosylated nonfunctional Psd1 (A) Pre-cultures of the indicated strains were inoculated in YPD medium supplemented with 1% (v/v) Tergitol (−), 0.5mM lyso-phosphatidylethanolamine in 1% (v/v) Tergitol (L), or 2mM ethanolamine (E). Following overnight growth at 30°C, cell extracts were harvested and immunoblotted for Psd1 β, Psd1 α, Cho1, and Kar2; Aac2 acted as loading control (n = 5). (B) The relative abundance of LGS mutant Psd1 ER β-α and Mito β-α was determined from yeast analyzed in (A) (mean ± SEM, n = 5). (C) Pre-cultures of the indicated strains were inoculated in YPD medium alone or supplemented with 2mM ethanolamine (E) or 2mM choline (C). Following overnight growth at 30°C, cell extracts were harvested and immunoblotted as listed. (D) The relative abundance of LGS mutant Psd1 ER β-α and Mito β-α was determined from yeast analyzed in (C) (mean ± SEM, n = 5). For (B) and (D), statistical differences (3 symbols p 0.001; 4 symbols p ≤ 0.0001) compared to psd2Δpsd1Δ were calculated by one-way ANOVA with Dunnett's multiple comparison test. (E) Cellular phospholipids from the indicated strains grown in YPD alone or supplemented with choline, ethanolamine, or lyso-phosphatidylethanolamine were labeled overnight with 14C-Acetate and separated by TLC (n = 6). (F) Cellular PE abundance was determined for each strain in each growth condition (mean ± SEM for n = 6). Statistical differences (1 symbol p ≤ 0.05; 3 symbols p ≤ 0.001) relative to growth in YPD alone were determined by one-way ANOVA with Holm-Sidak pairwise comparison (for :WT samples) or one-way ANOVA by ranks (:LGS samples). (G) Steady-state abundance of Kar2 and Aac2 in indicated strains grown in absence or presence of lyso-PE or ethanolamine relative to psd2Δpsd1Δ:WT yeast grown in YPD alone (mean ± SEM for n = 4). (H) Steady-state abundance of Kar2 and Aac2 in indicated strains grown in absence or presence of ethanolamine or choline relative to psd2Δpsd1Δ::WT yeast grown in YPD alone (mean ± SEM for n = 5). For (G) and (H), statistical differences (1 symbol p 0.05; 2 symbols p ≤ 0.01; 3 symbols p ≤ 0.001; 4 symbols p ≤ 0.0001) compared to WT in YPD alone (∗) or YPD alone for a given strain (#) were calculated with unpaired Student's t-test.
Figure 6
Figure 6
Glycosylated non-functional mutant Psd1 is short lived and ubiquitinated (A) In vivo degradation assay. Cell extracts from designated strains were isolated at the indicated times following growth in YPD containing cycloheximide (CHX) only or CHX and choline. Samples were resolved by SDS-PAGE and immunoblotted as indicated (n = 5). ∗, nonspecific bands. (B) The percentages of WT α and β subunits remaining at each time point were quantified (mean ± SEM for n = 5). (C) The percentages of nonfunctional glycosylated ER β-α and mitochondrial β-α remaining at each time point were quantified (mean ± SEM for n = 5). Statistical differences (1 symbol p ≤ 0.05; 2 symbols p ≤ 0.01; 3 symbols p ≤ 0.001; 4 symbols p ≤ 0.0001) between ER β-α and Mito β-α were determined at each time point by unpaired student t-test. (D) An overnight YPD culture of the psd2Δpsd1Δpdr5Δ:LGS strain was resuspended in SCD with 2mM choline and further spiked with vehicle (DMSO) or the proteosomal inhibitor MG132. After a 1hr incubation at 30°C, CHX was added and cell extracts harvested following growth at 30°C for the indicated times. Samples were resolved by SDS-PAGE and immunoblotted as indicated (n = 5). (E) The percentages of nonfunctional glycosylated ER β-α and mitochondrial β-α remaining at each time point were quantified (mean ± SEM for n = 5). Statistical differences (1 symbol p ≤ 0.05) between vehicle and MG132 treated samples for ER β-α and Mito β-α were determined at each time point by unpaired Student's t-test. (F) In vivo ubiquitination assay. Crude lysate was prepared from the indicated strains and lysates were ultracentrifuged into soluble, cytosolic (cyt.) and membrane (mem.) fractions, the latter of which was solubilized with digitonin. FLAG-tagged WT and mutant Psd1 were immunoprecipitated from the soluble and digitonin-extracted membrane fractions and recovered Mito β, Mito α, ER β-α, and Mito β-α detected by immunoblot using 4,077.4 antisera; ubiquitin antibody detected ubiquitination (n = 3). (G) In vivo re-translocation assay. Ubiquitin removal with Usp2Core, quenched with SUME, immunoprecipitated with anti-FLAG resin, and immunoblotted for Psd1 β and ubiquitin. SM, starting material before anti-FLAG immunoprecipitation (n = 3).
Figure 7
Figure 7
Supplements that diminish amount of glycosylated mutant Psd1 act by distinct mechanisms (A) The indicated strains were cultured overnight at 30°C in YPD without or with 10 μM CCCP. Cell extracts were harvested and immunoblotted as designated. OE indicates overexposed blot in which the Mito β-α signals are saturated. (n = 3). (B) CIS1 mRNA levels in the indicated strains grown in YPD at 30°C were determined by two-step reverse transcription-quantitative PCR and normalized to ACT1 (mean ± SEM, n = 5). Statistical differences (2 symbols p ≤ 0.01; 4 symbols p ≤ 0.0001) versus WT were calculated with unpaired Student's t-test. (C) Cell extracts from the indicated strains, untransformed or transformed with the autocatalytic LGS Psd1 mutant, grown overnight in YPD were immunoblotted for Psd1 β (4,077.4), Psd1 α (FLAG), Cox2 (encoded by mtDNA), and Tam41; Kgd1 acted as loading control (n = 3). ∗, nonspecific bands. (D) TMT comparison of ER (P40) proteomes from psd2Δpsd1Δ::LGS and psd2Δpsd1Δ yeast (n = 3 preps each). LGS; autocatalytic mutant Psd1. (E and F) Heatmaps of gene expression analysis from RNAseq with the indicated strains grown in YPD medium alone or YPD supplemented with lyso-PE (L), ethanolamine (E), or choline (C). padj values that were significantly different from YPD medium alone (p ≤ 0.05) are designated (∗). (E) The top 20 upregulated genes in ::LGS vs ::WT and how each supplement does or does not affect their expression relative to ::LGS grown in YPD alone. (F) The top 20 downregulated genes in ::LGS vs ::WT and how each supplement does or does not affect their expression relative to ::LGS grown in YPD alone.

Similar articles

Cited by

References

    1. Aaltonen M.J., Friedman J.R., Osman C., Salin B., di Rago J.P., Nunnari J., Langer T., Tatsuta T. MICOS and phospholipid transfer by Ups2-Mdm35 organize membrane lipid synthesis in mitochondria. J. Cell Biol. 2016;213:525–534. - PMC - PubMed
    1. Achleitner G., Zweytick D., Trotter P.J., Voelker D.R., Daum G. Synthesis and intracellular transport of aminoglycerophospholipids in permeabilized cells of the yeast, Saccharomyces cerevisiae. J. Biol. Chem. 1995;270:29836–29842. - PubMed
    1. Acoba M.G., Senoo N., Claypool S.M. Phospholipid ebb and flow makes mitochondria go. J. Cell Biol. 2020;219:e202003131. - PMC - PubMed
    1. Altschul S.F., Madden T.L., Schaffer A.A., Zhang J., Zhang Z., Miller W., Lipman D.J. Gapped BLAST and PSI-BLAST: a new generation of protein database search programs. Nucleic Acids Res. 1997;25:3389–3402. - PMC - PubMed
    1. Altschul S.F., Wootton J.C., Gertz E.M., Agarwala R., Morgulis A., Schaffer A.A., Yu Y.K. Protein database searches using compositionally adjusted substitution matrices. FEBS J. 2005;272:5101–5109. - PMC - PubMed