. 2021 Feb 25:12:629914.
doi: 10.3389/fphys.2021.629914. eCollection 2021.

Elevated Lactate by High-Intensity Interval Training Regulates the Hippocampal BDNF Expression and the Mitochondrial Quality Control System

Affiliations

Elevated Lactate by High-Intensity Interval Training Regulates the Hippocampal BDNF Expression and the Mitochondrial Quality Control System

Jingyun Hu et al. Front Physiol. .

Abstract

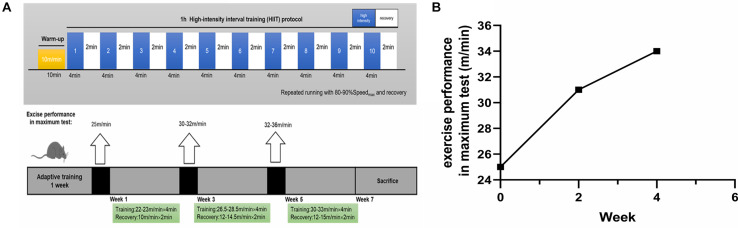
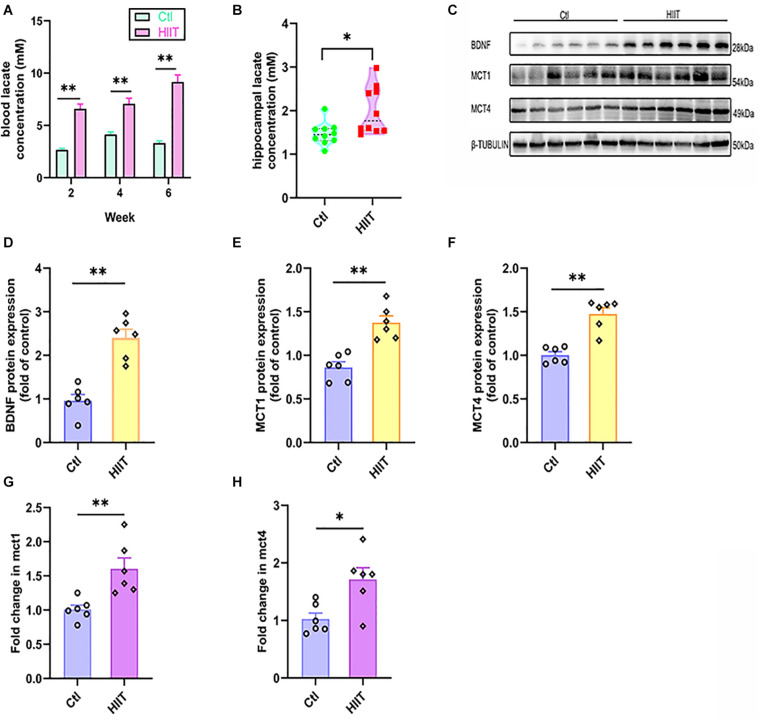
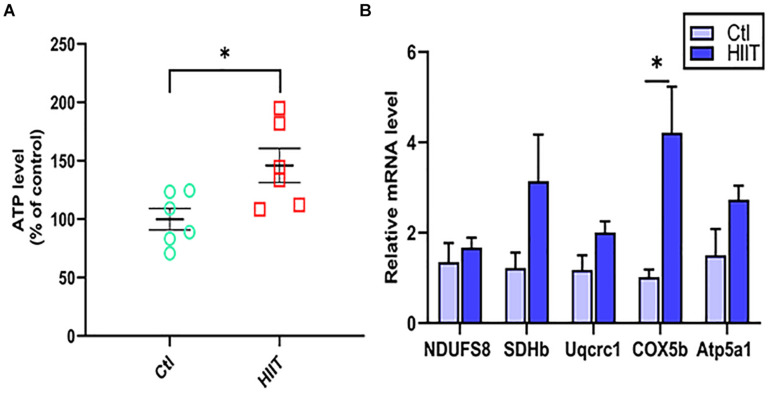
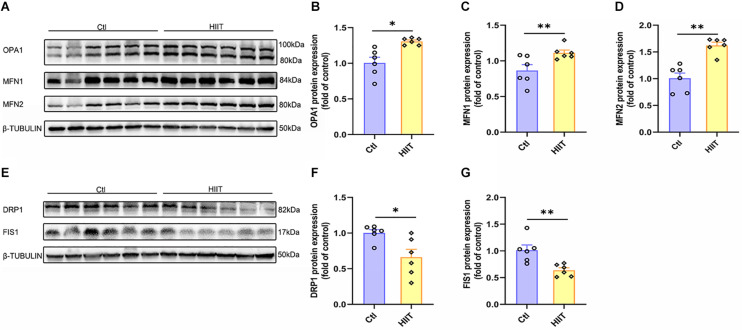
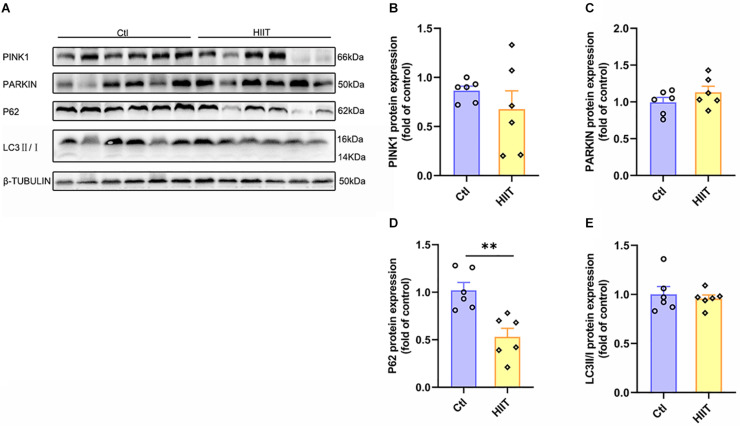
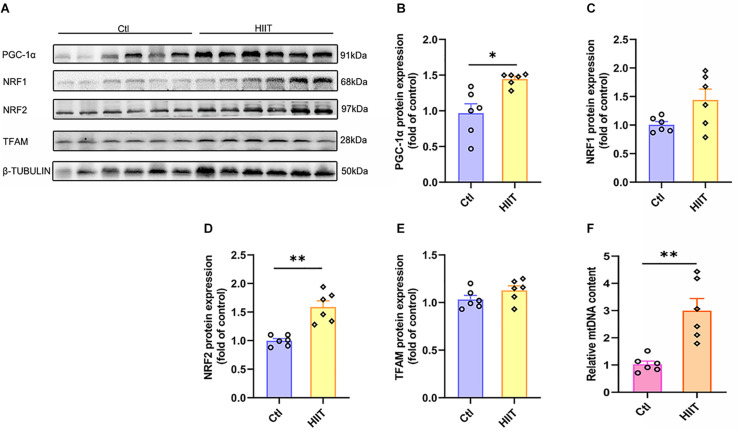
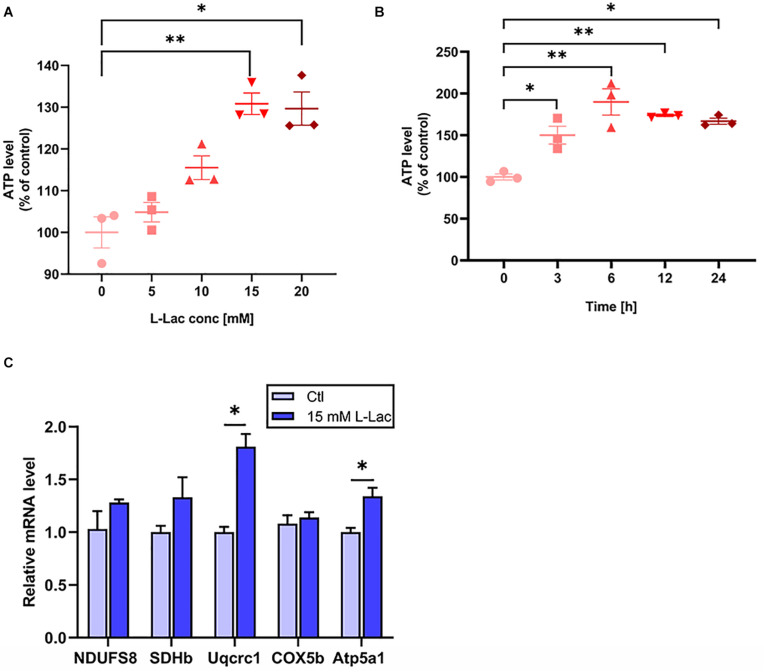
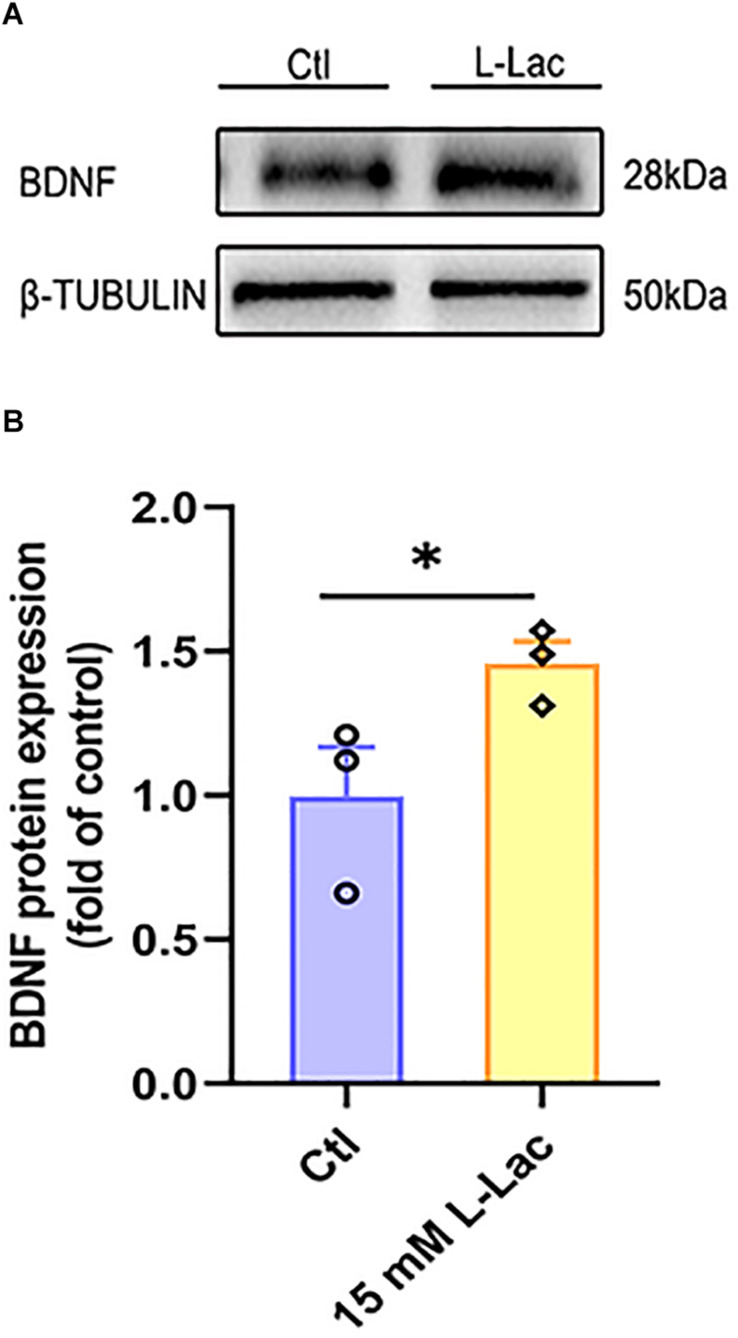
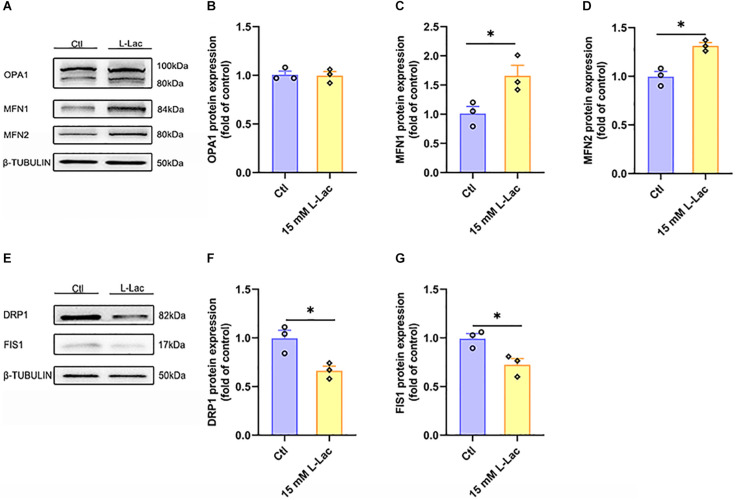
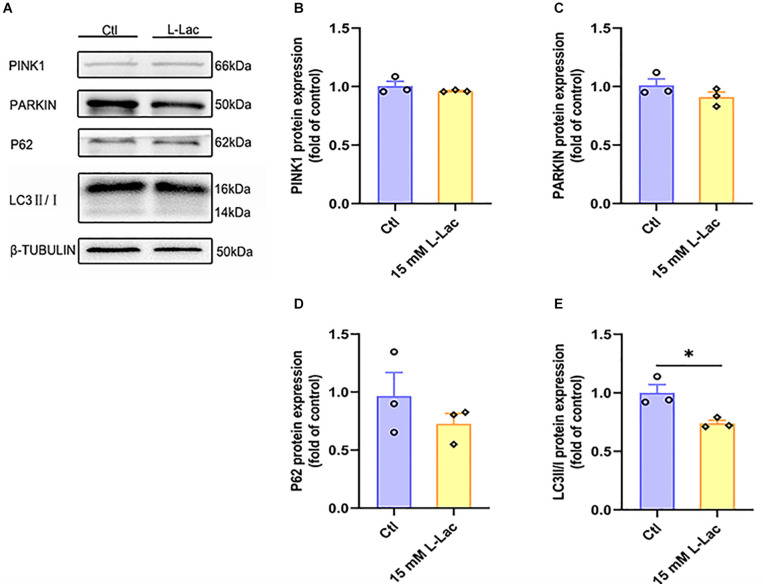
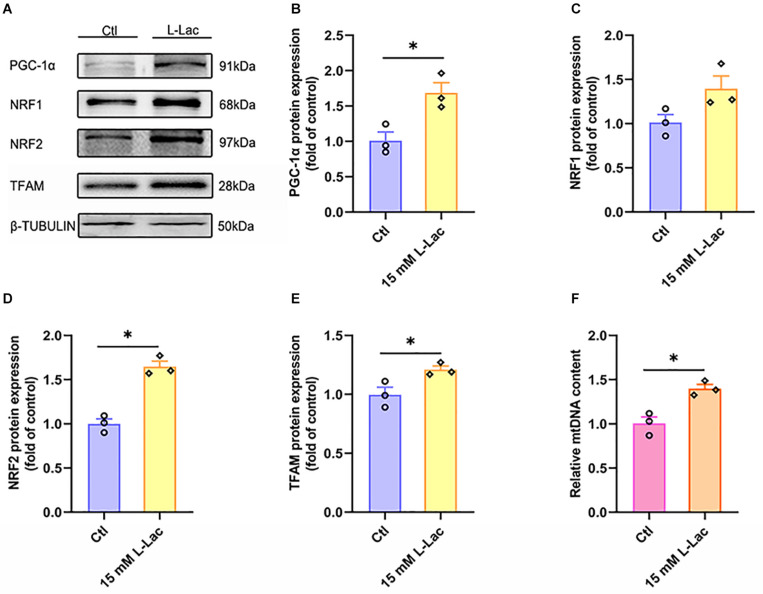
High-intensity interval training (HIIT) is reported to be beneficial to brain-derived neurotrophic factor (BDNF) biosynthesis. A key element in this may be the existence of lactate, the most obvious metabolic product of exercise. In vivo, this study investigated the effects of a 6-week HIIT on the peripheral and central lactate changes, mitochondrial quality control system, mitochondrial function and BDNF expression in mouse hippocampus. In vitro, primary cultured mice hippocampal cells were used to investigate the role and the underlying mechanisms of lactate in promoting mitochondrial function during HIIT. In vivo studies, we firstly reported that HIIT can potentiate mitochondrial function [boost some of the mitochondrial oxidative phosphorylation (OXPHOS) genes expression and ATP production], stimulate BDNF expression in mouse hippocampus along with regulating the mitochondrial quality control system in terms of promoting mitochondrial fusion and biogenesis, and suppressing mitochondrial fission. In parallel to this, the peripheral and central lactate levels elevated immediately after the training. In vitro study, our results revealed that lactate was in charge of regulating mitochondrial quality control system for mitochondrial function and thus may contribute to BDNF expression. In conclusion, our study provided the mitochondrial mechanisms of HIIT enhancing brain function, and that lactate itself can mediate the HIIT effect on mitochondrial quality control system in the hippocampus.

Keywords: BDNF; High-intensity interval training; lactate; mitochondrial quality control system; mouse hippocampus.


Conflict of interest statement

The authors declare that the research was conducted in the absence of any commercial or financial relationships that could be construed as a potential conflict of interest.

Figures

FIGURE 1
FIGURE 1
The exercise paradigm of 6-week HIIT and exercise performance in the maximum test. (A) The exercise paradigm of 6-week HIIT. In the first and second week, the HIIT group completed warm-up (10 min × 10 m/min) and then 10 bouts of high-intensity running [4 min × (22–23) m/min], and separated by active rest (2 min × 10 m/min). In the third and fourth week, the HIIT group completed warm-up and then 10 bouts of high-intensity running [4 min × (26.5–28.5) m/min], and separated by active rest [2 min × (12–14.5) m/min]. In the fifth and sixth week, the HIIT group completed warm-up and then 10 bouts of high-intensity running [4 min × (30–33) m/min], and separated by active rest [2 min × (12–15) m/min]. (B) The exercise performance in the maximum test. The exercise performance of the HIIT group was, respectively, performed at the end of adaptive training, the second and the fourth week of training.
FIGURE 2
FIGURE 2
HIIT increased lactate levels and promoted hippocampal MCT1/4 and BDNF expression. The blood lactate levels in two groups were detected at the end of 2nd, 4th, and 6th week of training to estimate the exercise intensity of High-intensity interval training (HIIT). The hippocampal lactate level was determined by colorimetry. The levels of Monocarboxylic acid transporter 1 (MCT1) and Monocarboxylic acid transporter 4 (MCT4) were also detected by RT-PCR and WB, respectively, to indirectly evaluate the lactate level in mouse hippocampus. The protein expression of Brain-derived neurotrophic factor (BDNF) was detected by WB. (A) The blood lactate levels. (B) hippocampal lactate level. (C) Representative WB image. (D) BDNF protein expression. (E) MCT1 protein expression. (F) MCT4 protein expression. (G) mct1 mRNA level. (H) mct4 mRNA level. TUBULIN and gapdh as the loading control. N = 10 mice per group for (A,B). N = 6 mice per group for (D-H). p ≤ 0.05 and ∗∗p ≤ 0.01 as compared with the Ctl group by unpaired Student’s t test. Values are expressed as mean ± standard error of the mean.
FIGURE 3
FIGURE 3
The effects of HIIT on hippocampal mitochondrial function. The level of ATP was detected by Luciferase and the oxidative phosphorylation (OXPHOS) related genes (NDUFS8, SDHb, Uqcrc1, COX5b, and Atp5a1) was detected by RT-PCR in mouse hippocampus. (A) The ATP level. (B) OXPHOS mRNA levels. The gapdh as the loading control. N = 6 mice per group. P ≤ 0.05 as compared with the Ctl group by unpaired Student’s t test. Values are expressed as mean ± standard error of the mean.
FIGURE 4
FIGURE 4
The effects of HIIT on hippocampal mitochondrial fusion and fission. The Optic atrophy (OPA1), Mitofusin 1 (MFN1), and Mitofusin 2 (MFN2) were determined by WB to represent the mitochondrial fusion state in mouse hippocampus. The Dynamin-related protein1 (DRP1) and mitochondrial fission 1 protein (FIS1) were also determined by WB to represent the mitochondrial fission state in mouse hippocampus. (A,E) Representative WB image. (B) OPA1 protein expression. (C) MFN1 protein expression. (D) MFN2 protein expression. (F) DRP1 protein expression. (G) FIS1 protein expression. TUBULIN as the loading control. N = 6 mice per group. p ≤ 0.05 and ∗∗p ≤ 0.01 as compared with the Ctl group by unpaired Student’s t test. Values are expressed as mean ± standard error of the mean.
FIGURE 5
FIGURE 5
The effects of HIIT on hippocampal mitophagy. The PTEN-induced putative kinase 1 (PINK1), PARKIN, Sequestosome-1 (P62), and microtubule-associated protein light chain3 (LC3) were determined by WB to represent the mitophagy state in mouse hippocampus. (A) Representative WB image. (B) PINK1 protein expression. (C) PARKIN protein expression. (D) P62 protein expression. (E) LC3 protein expression. TUBULIN as the loading control. N = 6 mice per group. ∗∗P ≤ 0.01 as compared with the Ctl group by unpaired Student’s t test. Values are expressed as mean ± standard error of the mean.
FIGURE 6
FIGURE 6
The effects of HIIT on hippocampal mitochondrial biogenesis signal and mitochondria DNA copy number. The peroxisome proliferator-activated receptor γ coactivator-1α (PGC-1α), nuclear respiratory factors 1 (NRF1), nuclear respiratory factors 1 (NRF2), and transcription factor A (TFAM) were determined by WB to evaluate the mitochondrial biogenesis signals in mouse hippocampus. The mt-Cytb level was determined by RT-PCR to evaluate the mitochondria DNA copy number. (A) Representative WB image. (B) PGC-1α protein expression. (C) NRF1 protein expression. (D) NRF2 protein expression. (E) TFAM protein expression. (F) mt-Cytb level. TUBULIN and Cycs as the loading control. N = 6 mice per group. p ≤ 0.05 and ∗∗p ≤ 0.01 as compared with the Ctl group by unpaired Students t test. Values are expressed as mean ± standard error of the mean.
FIGURE 7
FIGURE 7
Lactate increased the OXPHOS related genes expression and ATP levels in primary hippocampal cells. The mice primary cultured hippocampal cells were treated with different concentration of L-lactate (5, 10, 15, and 20 mM) for 24 h and different time points (3, 6, 12, and 24 h) following 15 mM lactate treatment for determination of the effect of lactate on the levels of ATP. The levels of ATP were detected by Luciferase. The oxidative phosphorylation (OXPHOS) related genes (NDUFS8, SDHb, Uqcrc1, COX5b, and Atp5a1) was detected in the condition of 15 mM L-lactate treatment for 3 h by RT-PCR in primary hippocampal cells. (A,B) The ATP levels. (C) OXPHOS mRNA levels. The gapdh as the loading control. N = 3 in three independent experiments. P ≤ 0.05 and ∗∗P ≤ 0.01 as compared with the Ctl group by non-parametric tests. Values are expressed as mean ± standard error of the mean.
FIGURE 8
FIGURE 8
Lactate increased BDNF expression in primary hippocampal cells. The mice primary cultured hippocampal cells were treated with 15 mM L-lactate for 3 h to observe the effect of lactate on BDNF expression. The protein expression of Brain-derived neurotrophic factor (BDNF) was detected by WB. (A) Representative WB image. (B) BDNF protein expression. TUBULIN as the loading control. N = 3 in three independent experiments. P ≤ 0.05 compared with the Ctl group by non-parametric tests. Values are expressed as mean ± standard error of the mean.
FIGURE 9
FIGURE 9
Lactate directly regulated mitochondrial fusion and fission in primary hippocampal cells. The Optic atrophy (OPA1), Mitofusin 1 (MFN1), and Mitofusin 2 (MFN2) were determined by WB to observe the effect of lactate on the mitochondrial fusion in primary hippocampal cells. The Dynamin-related protein1 (DRP1) and mitochondrial fission 1 protein (FIS1) were also determined by WB to observe the effect of lactate on the mitochondrial fusion in primary hippocampal cells. (A,E) Representative WB image. (B) OPA1 protein expression. (C) MFN1 protein expression. (D) MFN2 protein expression. (F) DRP1 protein expression. (G) FIS1 protein expression. TUBULIN as the loading control. N = 3 in three independent experiments. P ≤ 0.05 as compared with the Ctl group by non-parametric tests. Values are expressed as mean ± standard error of the mean.
FIGURE 10
FIGURE 10
Lactate weakly influenced mitophagy in primary hippocampal cells. The PTEN-induced putative kinase 1 (PINK1), PARKIN, Sequestosome-1 (P62), and microtubule-associated protein light chain3 (LC3) were determined by WB to observe the effect of lactate on the mitophagy in primary hippocampal cells. (A) Representative WB image. (B) PINK1 protein expression. (C) PARKIN protein expression. (D) P62 protein expression. (E) LC3 protein expression. TUBULIN as the loading control. N = 3 in three independent experiments. P ≤ 0.05 as compared with the Ctl group by non-parametric tests. Values are expressed as mean ± standard error of the mean.
FIGURE 11
FIGURE 11
Lactate enhanced mitochondrial biogenesis signal and increased mitochondria DNA copy number in primary hippocampal cells. The peroxisome proliferator-activated receptor γ coactivator-1α (PGC-1α), nuclear respiratory factors 1 (NRF1), nuclear respiratory factors 1 (NRF2), and transcription factor A (TFAM) were determined by WB to observe the effect of lactate on mitochondrial biogenesis signals in primary hippocampal cells. The mt-Cytb level was determined by RT-PCR to evaluate mitochondria DNA copy number after the L-lactate treatment in primary hippocampal cells. (A) Representative WB image. (B) PGC-1α protein expression. (C) NRF1 protein expression. (D) NRF2 protein expression. (E) TFAM protein expression. (F) mt-Cytb level. TUBULIN and Cycs as the loading control. N = 3 in three independent experiments. P ≤ 0.05 as compared with the Ctl group by non-parametric tests. Values are expressed as mean ± standard error of the mean.

Similar articles

Cited by

References

    1. Afzalpour M. E., Chadorneshin H. T., Foadoddini M., Eivari H. A. (2015). Comparing interval and continuous exercise training regimens on neurotrophic factors in rat brain. Physiol. Behav. 147 78–83. 10.1016/j.physbeh.2015.04.012 - DOI - PubMed
    1. Bayod S., Del Valle J., Canudas A. M., Lalanza J. F., Sanchez-Roige S., Camins A., et al. (2011). Long-term treadmill exercise induces neuroprotective molecular changes in rat brain. J. Appl. Physiol. 111 1391380–1391390. 10.1152/japplphysiol.00425.2011.-Exercise - DOI - PubMed
    1. Bergersen L. H. (2015). Lactate transport and signaling in the brain: potential therapeutic targets and roles in body-brain interaction. J. Cereb. Blood Flow Metab. 35 176–185. 10.1038/jcbfm.2014.206 - DOI - PMC - PubMed
    1. Bernardo T. C., Marques-Aleixo I., Beleza J., Oliveira P. J., Ascensao A., Magalhaes J. (2016). Physical exercise and brain mitochondrial fitness: the possible role against Alzheimer’s disease. Brain Pathol. 26 648–663. 10.1111/bpa.12403 - DOI - PMC - PubMed
    1. Berthet C., Lei H., Thevenet J., Gruetter R., Magistretti P. J., Hirt L. (2009). Neuroprotective role of lactate after cerebral ischemia. J. Cereb. Blood Flow Metab. 29 1780–1789. 10.1038/jcbfm.2009.97 - DOI - PubMed

LinkOut - more resources