. 2021 Mar 12;11(1):5817.
doi: 10.1038/s41598-021-85089-6.

Dual-specificity phosphatase 3 deletion promotes obesity, non-alcoholic steatohepatitis and hepatocellular carcinoma

Affiliations

Dual-specificity phosphatase 3 deletion promotes obesity, non-alcoholic steatohepatitis and hepatocellular carcinoma

Sophie Jacques et al. Sci Rep. .

Abstract

Non-alcoholic fatty liver disease (NAFLD) is the most common chronic hepatic pathology in Western countries. It encompasses a spectrum of conditions ranging from simple steatosis to more severe and progressive non-alcoholic steatohepatitis (NASH) that can lead to hepatocellular carcinoma (HCC). Obesity and related metabolic syndrome are important risk factors for the development of NAFLD, NASH and HCC. DUSP3 is a small dual-specificity protein phosphatase with a poorly known physiological function. We investigated its role in metabolic syndrome manifestations and in HCC using a mouse knockout (KO) model. While aging, DUSP3-KO mice became obese, exhibited insulin resistance, NAFLD and associated liver damage. These phenotypes were exacerbated under high fat diet (HFD). In addition, DEN administration combined to HFD led to rapid HCC development in DUSP3-KO compared to wild type (WT) mice. DUSP3-KO mice had more serum triglycerides, cholesterol, AST and ALT compared to control WT mice under both regular chow diet (CD) and HFD. The level of fasting insulin was higher compared to WT mice, though, fasting glucose as well as glucose tolerance were normal. At the molecular level, HFD led to decreased expression of DUSP3 in WT mice. DUSP3 deletion was associated with increased and consistent phosphorylation of the insulin receptor (IR) and with higher activation of the downstream signaling pathway. In conclusion, our results support a new role for DUSP3 in obesity, insulin resistance, NAFLD and liver damage.


Conflict of interest statement

The authors declare no competing interests.

Figures
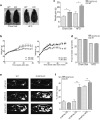
Figure 1
Figure 1
DUSP3 genetic deletion promotes obesity. (a) Representative images of 18-month-old WT and DUSP3-KO mice fed CD (left photo) and 5-month-old WT and DUSP3-KO mice fed HFD (right photo). (b) WT and KO mice were fed chow diet (left panel) or HFD (right panel) and body weight was monitored weekly during 60 weeks. The data are expressed as means ± SD (n = 10 mice in each group). (c) Weight gain of WT and KO mice after 60 weeks of CD or HFD. (d) Food intake during 27 weeks for WT and KO mice under CD and HFD. (e) Representative CT-scan images of 5- and 18-month-old WT and KO mice under CD and HFD. The white color represents fat and dark represent lean mass. (f) Quantification of fat body mass [n = 3 mice in each group shown in (e)] Data represent the mean ± SD of at least three mice of each group (*P < 0.5; **P < 0.01).
Figure 2
Figure 2
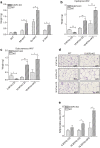
DUSP3 deletion promotes white adipose tissue accumulation. (a) White and brown adipose tissue (WAT and BAT, respectively) was assessed in 18-month-old WT and DUSP3-KO mice. SB subcutaneous, Ep epididymal and Pr perirenal. (b,c) Subcutaneous and epididymal fat assessment in 5-month-old WT and KO mice under CD and in 18-month-old WT and KO mice under CD and HFD. (d) Representative paraffin sections of epididymal WAT from 5-month-old WT and DUSP3-KO mice under CD and at 18-month-old under CD and HFD. Sections were stained with H&E. Magnification: ×20. (e) Average adipocytes cell area of epididymal WAT of the mice shown in (d). Data represent the mean ± SD of at least three mice of each group (*P < 0.5; **P < 0.01).
Figure 3
Figure 3
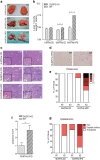
DUSP3 deletion promotes NAFLD and associated liver damages. (a) Representative image of liver from mutant and WT mice fed CD or HFD. (b) Quantification of liver to body weight ratio. Data represent the mean ± SD of at least ten mice of each of the indicated group (**P < 0.01). (c) Representative images of H&E staining of liver sections from DUSP3-KO and WT fed CD or HFD. Asterisks indicate representative lipid droplets. (d) Representative images of Sirius Red staining of liver sections from DUSP3-KO and WT fed HFD. (e–g) Fibrosis (e), steatosis (f) and dysplasia (g) scores. Mean ± SD values for all mice are shown. *P < 0.05; **P < 0.01.
Figure 4
Figure 4
DUSP3 deletion promotes NAFLD and associated liver damages. Concentrations of TG (a), T-CHO (b), LDL/HDL ratio (c), AST (d) and ALT (e) in the sera of mice. Each dot represents one mouse. Mean ± SD values for all mice are shown. *P < 0.05; **P < 0.01; ***P < 0.001.
Figure 5
Figure 5
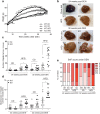
DUSP3 deletion associated with HFD strongly promote DEN-induced hepatocarcinogenesis. DEN (25 mg/kg) was i.p injected to 14-day-old DUSP3-KO and WT mice. Four weeks later, diet of the mice was switched to CD or HFD and weight was monitored every two weeks for 31 weeks (a). (b) Livers of WT and mutant mice kept on CD or HFD 24 and 32 weeks after the administration of DEN. (ce) Tumor multiplicity (c), size (d), and SAF score evaluation (e) in livers of DEN-injected WT and DUSP3-KO mice kept on CD or HFD as above. Each dot represents the average number of tumors or size of the tumors for one mouse. Results are means ± SD. Each dot represents one mouse. Mean ± SD values for all mice are shown. *P < 0.05; **P < 0.01. n = 10 mice in each group.
Figure 6
Figure 6
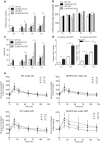
DUSP3 deletion exacerbate insulin resistance under HFD. Fasting blood insulin (a), blood glucose (b) and HOMA-IR (c) in DUSP3-KO and WT mice under CD or HFD. At all-time points, mice were starved for 6 h and blood was collected from tail vein to measure insulin and glucose. T0, basal level, corresponds to the measurement at the starting day of HFD. T1, T2 and T3 correspond respectively to 4 weeks, 12 weeks and 20 weeks under HFD or CD. N = 5 mice in each group of T1 to T3. N = 10 mice in each group at T0. (d) Fasting blood insulin in 24 weeks (left panel) and 32 weeks (right panel) after DEN challenge of DUSP3-KO and WT mice under CD or HFD. N = 5 mice in each group. Data represent means ± SD. Significance was determined by one-way ANOVA.
Figure 7
Figure 7
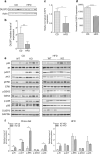
DUSP3 is involved in IR phosphorylation and signaling and its expression is reduced under HFD. (ad) DUSP3 expression is reduced in mice liver under HFD. (ab) DUSP3 protein expression. mRNA levels using qRT-PCR (c) and RNAseq (d) in liver extracts from 18-month-old WT mice under chow diet (CD) and high fat diet (HFD). (a) representative Western blot in liver samples of WT mice under CD and HFD. (b) Quantification of protein expression was normalized on beta-actin while (c) quantification of transcripts was normalized on HPRT housekeeping gene. Data are presented as mean ± SD. N = 3 mice in each group. (ef) Protein level and phosphorylation of IR, AKT, ERK, GSK3 and p38 in the mouse liver tissue from DUSP3-KO and WT mice under CD and HFD. Liver homogenates protein extract were subjected to Western blot using anti-phospho IR, anti-phospho AKT, anti-phospho-ERK, anti-phospho GSK3 and anti-phospho p38. Anti-IR, AKT, ERK, GSK3 and p38 were used for normalization of each phosphorylation level. Global normalization was achieved using anti-b-actin antibody. (e) Representative blots are shown. (f) The average relative grayscale values normalized with the control protein were obtained from 4 to 6 mice per group and results are expressed as mean ± SD. *P < 0.05; **P < 0.01. Non-cropped original blots for each shown phospho-protein and protein are in the extended Supplementary Fig. 7 in the Supplementary Information.
Figure 8
Figure 8
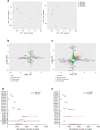
RNAseq analysis of DUSP3-KO and WT mice livers under CD and HFD. (a) Principal component analysis (PCA) on DUSP3-KO mice livers under CD (orange dots), or HFD (red dots) and WT mice livers under CD (light blue dots) or HFD (dark blue dots). (b,c) Comparison of the fold change difference between WT and DUSP3-KO genotypes for CD and HFD (b) and between CD and HFD for WT and the DUSP3-KO (c). Genes with adjusted p-value < 0.05 and fold change > 1.5 in at least one genotype were plotted. (b) Genes exclusive to CD are blue, the ones exclusive to HFD are green and the ones in common to both are red. (c) Genes exclusive to WT are blue, the ones exclusive to DUSP3-KO are green and the ones in common to both are red. Genes with the 5 highest or lowest fold changes in each group are labeled. (d,e) Comparison of expression levels of all known DUSPs in WT and DUSP3-KO (KO) mice under CD and HFD. Data are shown as normalized number of reads for each individual gene. ***P < 0.001.

Similar articles

Cited by

References

    1. Anstee QM, Reeves HL, Kotsiliti E, Govaere O, Heikenwalder M. From NASH to HCC: Current concepts and future challenges. Nat. Rev. Gastroenterol. Hepatol. 2019;16:411–428. doi: 10.1038/s41575-019-0145-7. - DOI - PubMed
    1. Younossi ZM, Koenig AB, Abdelatif D, Fazel Y, Henry L, Wymer M. Global epidemiology of nonalcoholic fatty liver disease—Meta-analytic assessment of prevalence, incidence, and outcomes. Hepatology. 2016;64:73–84. doi: 10.1002/hep.28431. - DOI - PubMed
    1. Wang S, Yan ZZ, Yang X, An S, Zhang K, Qi Y, et al. Hepatocyte DUSP14 maintains metabolic homeostasis and suppresses inflammation in the liver. Hepatology. 2018;67:1320–1338. doi: 10.1002/hep.29616. - DOI - PubMed
    1. Ye P, Xiang M, Liao H, Liu J, Luo H, Wang Y, et al. Dual-specificity phosphatase 9 protects against nonalcoholic fatty liver disease in mice through ASK1 suppression. Hepatology. 2019;69:76–93. doi: 10.1002/hep.30198. - DOI - PMC - PubMed
    1. Ye P, Liu J, Xu W, Liu D, Ding X, Le S, et al. Dual-specificity phosphatase 26 protects against nonalcoholic fatty liver disease in mice through transforming growth factor beta-activated kinase 1 suppression. Hepatology. 2019;69:1946–1964. doi: 10.1002/hep.30485. - DOI - PMC - PubMed

Publication types

Substances