. 2021 Apr 1;134(7):jcs254201.
doi: 10.1242/jcs.254201. Epub 2021 Apr 15.

The p97-UBXN1 complex regulates aggresome formation

Affiliations

The p97-UBXN1 complex regulates aggresome formation

Sirisha Mukkavalli et al. J Cell Sci. .

Abstract

The recognition and disposal of misfolded proteins is essential for the maintenance of cellular homeostasis. Perturbations in the pathways that promote degradation of aberrant proteins contribute to a variety of protein aggregation disorders broadly termed proteinopathies. The AAA-ATPase p97 (also known as VCP), in combination with adaptor proteins, functions to identify ubiquitylated proteins and target them for degradation by the proteasome or through autophagy. Mutations in p97 cause multi-system proteinopathies; however, the precise defects underlying these disorders are unclear. Here, we systematically investigate the role of p97 and its adaptors in the process of formation of aggresomes, membrane-less structures containing ubiquitylated proteins that arise upon proteasome inhibition. We demonstrate that p97 mediates aggresome formation and clearance, and identify a novel role for the adaptor UBXN1 in the process of aggresome formation. UBXN1 is recruited to aggresomes, and UBXN1-knockout cells are unable to form aggresomes. Loss of p97-UBXN1 results in increased Huntingtin polyQ inclusion bodies both in mammalian cells and in a C. elegans model of Huntington's disease. Together, our results identify evolutionarily conserved roles for p97-UBXN1 in the disposal of protein aggregates.

Keywords: Aggregate; Aggresome; Inclusion body; PolyQ; Proteasome; Ubiquitin.


Conflict of interest statement

Competing interests The authors declare no competing or financial interests.

Figures
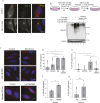
Fig. 1.
Fig. 1.
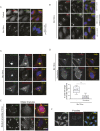
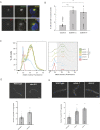
p97 is required for aggresome formation and clearance. (A) HeLa Flp-in T-Rex cells were treated with 1 µM Btz for 18 h. Cells were stained for p97, ubiquitin (FK2) and nuclei (Hoechst dye). (B) Hela Flp-in T-Rex cells were treated with 1 µM Btz, 2 µM CB-5083 or both for 8 h. Cells were released into drug-free medium or medium containing 1 µM CB-5083 for 24 h. Cell lysates were probed for ubiquitin. (C) Cells were treated as in B and imaged for ubiquitin-positive aggregates and aggresomes. (D) The percentage of cells with cellular aggregates (encompassing cytosolic and perinuclear aggregates) was quantified using AggreCount for images as in C. (E) The percentage of cells with perinuclear aggresomes (minimum size cutoff 2 µm2) was quantified using AggreCount for the images as in C. (F) The percentage of cells with cellular aggregates (encompassing cytosolic and perinuclear aggregates) in the release samples were quantified using AggreCount for images as in C. (G) The percentage of cells with perinuclear aggresomes in release samples were quantified using AggreCount for the images as in C. The black dot represents the mean from each biological replicate. The indicated number of cells (n) analyzed from all three independent biological replicates is shown for each condition. Graphs show the mean±s.e.m. *P≤0.05, **P≤0.01 as determined by one-way ANOVA with Bonferroni corrections (D,E) or an unpaired Student's t-test (F,G). Scale bars: 10 µm.
Fig. 2.
Fig. 2.
The p97 adaptors UBXN1 and NPL4 are localized to aggresomes. (A) HeLa Flp-in T-Rex cells were treated with 1 µM Btz for 18 h and cells were stained for UBXN1 and ubiquitin. Colocalization was determined through the Manders’ overlap coefficient for 25 cells in three replicate experiments. (B) NPL4, UFD1 and p47 localization to aggresomes labeled with ubiquitin in cells treated with 1 µM Btz for 18 h. Colocalization was determined through the Manders’ overlap coefficient for 25 cells in three replicate experiments. (C) GFP–UBXN1 colocalizes with the aggresome markers Proteostat, HDAC6 and 20S proteasomes in cells treated with 1 µM Btz for 18 h. (D) Microtubules are required for GFP–UBXN1 localization to aggresomes. Nocodazole co-incubation in Btz-treated (1 µM Btz for 18 h) cells prevents aggresome formation. Lower panel, the number of aggresomes was quantified. (E) Hela Flp-in T-Rex cells were treated with 0.1 mM sodium arsenite for 2 h. Cells were stained for stress granule marker G3BP1 and p97 adaptors (UBXN1 or p47, used here as a positive control. (F) Stable mCherry–Dcp1a cells (labeling P bodies) were stained with UBXN1. The indicated number of cells was analyzed from the three independent biological replicates. Manders’ coefficients are given as mean±s.e.m. For D, the box represents the tenth to 90th percentiles, and the median is indicated. The whiskers show the s.e.m. ***P≤0.001 as determined by unpaired Student's t-test. Scale bars: 10 µm.
Fig. 3.
Fig. 3.
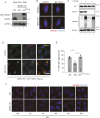
UBXN1 is required for the formation of aggresomes. (A) Immunoblot showing loss of UBXN1 in CRISPR/Cas9 generated knockout cells and re-expression of wild-type GFP–UBXN1 by doxycycline induction. (B) Wild-type (WT) and UBXN1 KO HeLa Flp-in TRex cell lines were treated with 1 µM Btz for 18 h. Cells were stained for ubiquitin. (C) Cell lysates from WT and KO cells treated with 1 µM Btz for 18 h were probed for ubiquitin. (D) GFP–UBXN1 expression in UBXN1 KO cells was induced by doxycycline. Cells were treated with Btz and stained for ubiquitin. Expression of GFP–UBXN1 reinstated aggresome formation in UBXN1 KO cells. (E) Quantification of data in B and D. (F) WT and UBXN1 KO lines were treated with 1 µM Btz for the indicated times and stained for ubiquitin. The black dot represents the mean from each biological replicate. The indicated number of cells (n) analyzed from all three independent biological replicates is shown for each condition. Graphs show the mean±s.e.m. *P≤0.05, **P≤0.01, as determined by one-way ANOVA with Bonferroni correction. Scale bars: 10 µm.
Fig. 4.
Fig. 4.
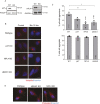
UBXN1 and NPL4 are required for aggresome formation. (A) Immunoblot validation of CRISPR/Cas9 gene-edited knockout (p47; KO) or knockdown (NPL4; KD) cell lines. WT, wild type. (B) Aggresome formation in CRISPR/Cas9 gene-edited KO cell lines for the indicated UBXD adaptors. (C) Quantification of data in B. (D) Aggregates in UBXN1 KO and NPL4 KD cells contain insoluble aggregated proteins as observed by staining with Proteostat. The black dot represents the mean from each biological replicate. The indicated number of cells (n) analyzed from all three independent biological replicates is shown for each condition. Graphs show the mean±s.e.m. *P≤0.05, **P≤0.01 as determined by one-way ANOVA with Bonferroni correction. Scale bars: 10 µm.
Fig. 5.
Fig. 5.
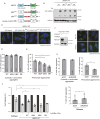
Analysis of domains within UBXN1 that are necessary for aggresome formation. (A) Domain organization of UBXN1 showing N-terminal ubiquitin associated domain (UBA), coiled coil domain (cc) and C-terminal ubiquitin X domain (UBX). (B) Expression of GFP–UBXN1, GFP–UBXN1-UBAmut, GFP–UBXN1-UBXmut and the double mutant (DB) in the UBXN1 KO cell line induced by the addition of doxycycline for 72 h. (C) UBXN1 KO cells expressing GFP–UBXN1 wild-type (WT), GFP–UBXN1-UBAmut, GFP–UBXN1-UBXmut and GFP–UBXN1-DB were treated with 1 µM Btz for 18 h and stained for ubiquitin. Re-expression of WT UBXN1 but not the single mutants or double mutant rescued aggresome formation. The UBAmut has smaller aggresomes but did not reach significance. (D) The percentage of cells with aggregates (encompassing cytosolic and perinuclear aggregates) were quantified for images as in C. (E) The percentage of cells with perinuclear aggresomes were quantified for the images as in C. (F) The depletion of HDAC6 inhibits aggresome formation and clearance in HeLa Flp-in TRex cells treated with 1 µM Btz for 18 h. Left panel shows knockdown of HDAC6. (G) Quantification of images in F. (H) WT, UBXN1 KO (and indicated rescue lines) and NPL4 cell lines were plated in triplicate into 96-well plates and treated with 1 µM Btz for 18 h. Cell viability was measured and normalized to the value of untreated controls for each cell line. The black dot represents the mean from each biological replicate. The indicated number of cells (n) analyzed from all three independent biological replicates is shown for each condition. Graphs show the mean±s.e.m. for panels in D, E and G and mean±s.d. of panel H. *P≤0.05, **P≤0.01 as determined by one-way ANOVA with Bonferroni correction (D,E) or Dunnett's multiple comparison test (H), or unpaired Student's t-test (G). Scale bars: 10 µm.
Fig. 6.
Fig. 6.
Role of p97 and UBXN1 in Huntingtin polyQ aggregation. (A) U2OS cells were treated with doxycycline to induce the expression of HTT Q91–mCherry. Cells were fixed and stained for ubiquitin and UBXN1 to demonstrate colocalization with HTT Q91–mCherry. (B) UBXN1 was transiently depleted with siRNAs in U2OS HTT Q91-mCherry cells and imaged for inclusion body formation. The percentage of cells with HTT Q91–mCherry inclusion bodies was quantified. (C) PuLSA analysis of HTT Q91-mCherry aggregates in UBXN1- and p97-depleted cells. (D,E) Representative fluorescent images of L4 larvae stage wild-type, cdc-48.1(tm544) (D), ubxn-1(tm2759) and ubxn-4(ok3343) worms. (E) Loss-of-function mutants expressing polyQ40::YFP in body wall muscle. Images were taken of worms precisely age-matched at the L4.4 vulva developmental stage. Bottom panels in each show quantification of visible fluorescent aggregates in L4 larvae animals expressing polyQ40::YFP in wild-type, cdc-48.1, ubxn-1 and ubxn-4 mutant animals. Quantification was only performed on worms at the L4.4 vulva development stage based on vulva morphology. The black dot represents the mean from each biological replicate. The indicated number of cells (n) analyzed from all three independent biological replicates is shown for each condition. Graphs show mean±s.e.m. *P≤0.05, **P≤0.01, ****P≤0.0001 as determined by one-way ANOVA with Tukey post-hoc testing (B) or Dunnett's test (E), and unpaired Student's t-test (D). Scale bar: 10 µm. Scale bars: 10 μm (B); 100 μm (D).

Similar articles

Cited by

References

    1. Arrasate, M., Mitra, S., Schweitzer, E. S., Segal, M. R. and Finkbeiner, S. (2004). Inclusion body formation reduces levels of mutant huntingtin and the risk of neuronal death. Nature 431, 805-810. 10.1038/nature02998 - DOI - PubMed
    1. Bauerlein, F. J. B., Saha, I., Mishra, A., Kalemanov, M., Martinez-Sanchez, A., Klein, R., Dudanova, I., Hipp, M. S., Hartl, F. U., Baumeister, W.et al. (2017). In Situ architecture and cellular interactions of PolyQ inclusions. Cell 171, 179. 10.1016/j.cell.2017.08.009 - DOI - PubMed
    1. Bersuker, K., Brandeis, M. and Kopito, R. R. (2016). Protein misfolding specifies recruitment to cytoplasmic inclusion bodies. J Cell Biol. 213, 229-241. 10.1083/jcb.201511024 - DOI - PMC - PubMed
    1. Blythe, E. E., Olson, K. C., Chau, V. and Deshaies, R. J. (2017). Ubiquitin- and ATP-dependent unfoldase activity of P97/VCP*NPLOC4*UFD1L is enhanced by a mutation that causes multisystem proteinopathy. Proc. Natl. Acad. Sci. USA 114, E4380-e4388. 10.1073/pnas.1706205114 - DOI - PMC - PubMed
    1. Bodnar, N. and Rapoport, T. (2017a). Toward an understanding of the Cdc48/p97 ATPase. F1000Research 6, 1318. 10.12688/f1000research.11683.1 - DOI - PMC - PubMed

Publication types

MeSH terms

Substances