. 2021 Jun;599(11):2851-2868.
doi: 10.1113/JP281037. Epub 2021 Mar 24.

The envelope protein of SARS-CoV-2 increases intra-Golgi pH and forms a cation channel that is regulated by pH

Affiliations

The envelope protein of SARS-CoV-2 increases intra-Golgi pH and forms a cation channel that is regulated by pH

David Cabrera-Garcia et al. J Physiol. 2021 Jun.

Abstract

Key points: We report a novel method for the transient expression of SARS-CoV-2 envelope (E) protein in intracellular organelles and the plasma membrane of mammalian cells and Xenopus oocytes. Intracellular expression of SARS-CoV-2 E protein increases intra-Golgi pH. By targeting the SARS-CoV-2 E protein to the plasma membrane, we show that it forms a cation channel, viroporin, that is modulated by changes of pH. This method for studying the activity of viroporins may facilitate screening for new antiviral drugs to identify novel treatments for COVID-19.

Abstract: The envelope (E) protein of coronaviruses such as SARS-CoV-1 is proposed to form an ion channel or viroporin that participates in viral propagation and pathogenesis. Here we developed a technique to study the E protein of SARS-CoV-2 in mammalian cells by directed targeting using a carboxyl-terminal fluorescent protein tag, mKate2. The wild-type SARS-CoV-2 E protein can be trafficked to intracellular organelles, notably the endoplasmic reticulum-Golgi intermediate complex, where its expression increases pH inside the organelle. We also succeeded in targeting SARS-CoV-2 E to the plasma membrane, which enabled biophysical analysis using whole-cell patch clamp recording in a mammalian cell line, HEK 293 cells, and two-electrode voltage clamp electrophysiology in Xenopus oocytes. The results suggest that the E protein forms an ion channel that is permeable to monovalent cations such as Na+ , Cs+ and K+ . The E current is nearly time- and voltage-independent when E protein is expressed in mammalian cells, and is modulated by changes of pH. At pH 6.0 and 7.4, the E protein current is activated, whereas at pH 8.0 and 9.0, the amplitude of E protein current is reduced, and in oocytes the inward E current fades at pH 9 in a time- and voltage-dependent manner. Using this directed targeting method and electrophysiological recordings, potential inhibitors of the E protein can be screened and subsequently investigated for antiviral activity against SARS-CoV-2 in vitro and possible efficacy in treating COVID-19.

Keywords: SARS-CoV-2; envelope protein; ion channel; membrane targeting.


Figures

Figure 1
Figure 1. Targeting SARS‐CoV‐2 E protein to the plasma membrane of NIH 3T3 cells
A, diagram of the SARS‐CoV‐2 E (SARS2‐E) constructs used for targeting experiments in NIH 3T3 cells. Numbers indicate the position of the amino acid (a.a.) in the sequence. B, representative phase contrast and fluorescence images of NIH 3T3 cells transfected with the constructs shown in A. Scale bar, 10 μm. The initial SARS2‐E‐mKate2 construct consisted of the cDNA encoding SARS‐CoV‐2 E protein, fused to a carboxyl (C)‐terminal fluorescent tag mKate2, separated by an intermediate spacer (GS) using glycine‐serine repeat (GSGSGS) and was termed WT for subsequent experiments (A, first construct). The construct SARS2‐E‐Ala6‐ΔPBM‐mKate2 (A, second construct) was made by mutating the PDZ‐binding motif (PBM) by replacement of six residues, 46–47 (A, described above the constructs) and 56–59 (A, indicated with double asterisks and described below the constructs) with alanine (Ala6) and deleting the C‐terminal ER retention signal DLLV (ΔPBM, indicated with single asterisk in the constructs). This construct resulted in expression of the E protein in organelles (B). A third construct (A) SARS2‐E‐PM‐mKate2 was made by insertion of a consensus Golgi export signal (ES) of Kir2.1 (KSRITSEGEYIPLDQIDINV) after the spacer, and again this construct resulted in expression of the E protein in organelles (B). The final construct SARS2‐E‐Ala6‐ΔPBM‐PM‐mKate2 (A) was made by inserting the Golgi export signal into the second construct, and this construct directed expression of the E protein to the plasma membrane (B, white arrowheads) as well as intracellular structures (B). We termed this final construct PM. [Color figure can be viewed at wileyonlinelibrary.com]
Figure 2
Figure 2. Expression of SARS‐CoV‐2 WT and PM targeting constructs in HEK 293S cells
A, representative confocal images of HEK 293S cells transfected using three constructs: pcDNA3 vector‐mKate2‐NLS (mock), SARS2‐E‐mKate2 (WT) and SARS2‐E‐Ala6‐ΔPBM‐PM‐mKate2 (PM). We were able to study the subcellular distribution of the E protein in HEK 293S cells by visualizing the red fluorescence signal of mKate2. Immunolabelling with anti‐ERGIC‐53 shows that expression of the WT construct is largely confined to intracellular organelles adjacent to the nucleus, presumably the ER and the ER–Golgi intermediate compartment (anti‐ERGIC‐53). Deletion of the ER retention signal first identified in the SARS‐CoV‐1 E protein combined with the insertion of a consensus Golgi export signal from the mammalian ion channel Kir2.1, allowed us to detect the PM construct in the plasma membrane. Panels show bright field (BF) images, nuclei stained for DAPI, mouse anti‐ERGIC‐53, and the C‐terminal red fluorescent tag, mKate2. These images show nuclear expression of NLS (mock, white arrowheads), organelle expression of E protein (WT) and expression of E protein at the plasma membrane (PM, white arrowheads). The bottom row shows merged images for DAPI, ERGIC‐53 and mKate2. Scale bar, 20 μm. B, a representative image of HEK 293S cells transfected with WT construct, which shows at higher resolution the co‐localization of SARS‐CoV‐2 E protein (mKate2) with the marker for ERGIC‐53 surrounding the nuclei (DAPI staining). Scale bar, 10 μm. [Color figure can be viewed at wileyonlinelibrary.com]
Figure 3
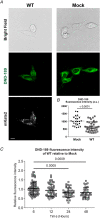
Figure 3. SARS‐CoV‐2 E protein expression decreases DND‐189 fluorescence in NIH 3T3 cells
A, representative cell images of NIH 3T3 cells transfected with pcDNA3 vector (Mock) or WT. Top row, bright‐field images; second row, LysoSensor DND‐189 images (green fluorescence); third row, mKate2 fluorescence to confirm E protein expression. Scale bar, 10 μm. B, quantification of fluorescence intensity in mock (n = 23) and WT (n = 39) transfected cells showing a decrease in mean cell fluorescence intensity 24 h following WT expression (1021 ± 304 vs. 668 ± 308 a.u. for mock and WT, respectively), which is consistent with an increase in luminal pH within organelles. Fluorescence was quantified using ImageJ analysis software. Student's t‐test, P < 0.0001. C, the time course of changes in pH monitored via fluorescence intensity at 6, 12, 24 and 48 h post‐transfection (n = 83, 51, 43 and 38, respectively) showing a decreasing relative fluorescence intensity (r.f.u., relative to mock) over time, indicating an increase in organellar pH. One‐way ANOVA F (3,211) = 7.133, P = 0.0001, Bonferroni's post hoc test when compared to 6 h (1.04 ± 0.34 r.f.u.): 12 h (0.94 ± 0.33 r.f.u., P = 0.2022), 24 h (0.81 ± 0.26 r.f.u., P = 0.0005), 48 h (0.81 ± 0.27 r.f.u., P = 0.0009). In B and C, data were collected and pooled from three separate transfections for each condition. Data are presented as means ± SD. [Color figure can be viewed at wileyonlinelibrary.com]
Figure 4
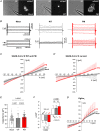
Figure 4. Membrane currents from HEK 293S cells expressing SARS‐CoV‐2 E WT or PM constructs
A, representative images of HEK 293S cells transfected with mock (NLS‐mKate2 into pcDNA3), WT and PM SARS‐CoV‐2 E protein constructs. Left panels, bright field images; right panels, mKate2 fluorescence. Scale bar, 20 μm. B, representative current records from HEK 293S cells expressing pcDNA3 vector (mock), WT and PM in top panels, and ‘mock subtracted’ traces of WT and PM in the bottom panels. Scale bars: 200 pA (vertical), 50 ms (horizontal). ‘Mock subtracted’ records are shown below. Scale bar, 100 pA. Dotted lines indicate zero current level. C, averaged I–V curves of mock (open squares, n = 102 from 24 transfections), PM (n = 95 from 22 transfections) and WT (n = 14 from 3 transfections) transfected cells. There was no difference between WT and mock (two‐way ANOVA, main difference between constructs, F (2,208) = 13.69, P < 0.0001, with Tukey's post hoc test, P = 0.7036 for WT vs. mock). When PM was expressed in HEK 293S cells, we observed higher total membrane conductance than with WT or mock (two‐way ANOVA, F (2,208) = 13.69, P < 0.0001, Tukey's post hoc: P < 0.0001 for PM vs. WT, and P < 0.0001 for PM vs. mock). D, subtracting mock‐transfected cell data from WT‐transfected data reveals no current. A larger voltage‐independent current is recorded in cells transfected with PM, and is revealed by digital subtraction (‘mock subtraction’) (two‐way ANOVA, main difference between constructs, F (1,107) = 3.334, P = 0.0742, and Bonferroni's post hoc test: P < 0.05 for V < −70 mV and >45 mV, P < 0.0001 at −100 mV and +100 mV). E, capacitance of PM (n = 95), mock (n = 102) and WT (n = 14) HEK 293S transfected cells (one‐way ANOVA, F (2,208) = 5.192, P = 0.0063, and Tukey's post hoc test: Mock vs. PM, P = 0.0043; Mock vs. WT, P = 0.8297; and PM vs. WT, P = 0.5638). F, current amplitudes in B were normalized to yield current density (pA/pF). Compared to mock‐transfected cells, the normalized current density of PM was greater at −100 mV (one‐way ANOVA, F (2,208) = 8.03, P = 0.0004, Tukey's post hoc test, Mock: −3.37 ± 1.58 pA pF−1 vs. PM: −4.44 ± 2.20 pA pF−1, P = 0.0003) and at +100 mV (one‐way ANOVA, F (2,208) = 12.35, P < 0.0001, Tukey's post hoc test, Mock: 3.93 ± 1.61 pA pF−1 vs. PM: 5.24 ± 2.15 pA pF−1, P < 0.0001). Current densities for WT were −3.64 ± 1.62 pA pF−1 at −100 mV (P = 0.3005, WT vs. PM) and 4.18 ± 1.38 pA pF−1 at +100 mV (P = 0.1227, WT vs. PM). No differences were found between Mock and WT (Tukey's post hoc test, at −100 mV: P = 0.8714, and at +100 mV: P = 0.8796). For visualization purposes, ns: not significant. G, using the whole‐cell configuration of the patch‐clamp technique with potassium gluconate in the pipette (Kgluci), cells transfected with the pcDNA3 vector only (mock, open squares, n = 13), WT (n = 7) and PM (n = 12) all exhibit a voltage‐dependent outward current. I–V relationships with potassium gluconate reveal a larger current in PM compared to mock‐transfected HEK 293S cells (mixed‐model two‐way ANOVA, main difference between constructs, F (2,29) = 0.3026, P = 0.011, and Tukey's post hoc test, PM vs. mock, P < 0.05 at V > +80 mV). The values plotted in the graphs are expressed as means ± SD. Currents in B–D and G were elicited by 200 ms commands from V h = −40 mV in 5 mV steps (from −100 mV to + 100 mV). [Color figure can be viewed at wileyonlinelibrary.com]
Figure 5
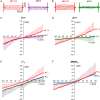
Figure 5. The E protein is modulated by pH and is permeable to small cations
A and B, representative examples of mock‐subtracted traces in standard Na+ extracellular solution at pH 7.4 (A and B) and after exchange with a similar external solution at pH 6 (A) or pH 8 (B). Dotted lines indicate the zero current level. Scale bars: 100 pA (vertical), 50 ms (horizontal). C–F, averaged mock‐subtracted current–voltage relationships for whole‐cell current in PM‐transfected cells in response to changes of pH and ion substitution in the external solution. Currents were elicited by 200 ms commands from V h = −40 mV in 5 mV steps (from −100 mV to +100 mV). C, the mock‐subtracted SARS‐CoV‐2 E current is linear at pH 7.4 but shows inward rectification when the external solution is exchanged for one at pH 6 (Mock = 11, PM = 12, from 5–6 transfections; two‐way ANOVA, main effect of pH: F (1,11) = 4.079, P = 0.0667, Bonferroni's post hoc test, P < 0.05 at V >75 mV, P < 0.0001 at +100 mV). D, SARS‐CoV‐2 E current measured at pH 7.4 is reduced when exposed to an external solution at pH 8 (Mock = 9, PM = 8, from 4–5 transfections; two‐way ANOVA, main effect of pH: F (1,7) = 6.628, P = 0.0368, Bonferroni's post hoc test, P < 0.05 at V h < −85 mV (P = 0.0017 at −100 mV) and V h > +60 mV (P < 0.0001 at +100 mV)). E, the SARS‐CoV‐2 E protein is permeable to K+. The standard external solution containing Na+ was replaced by a high K+ solution and the E rev shifted from −8.5 mV (95% CI: −11.7, −5.5 mV) in Na+ o to 18.7 mV (17.2, 20.3 mV) in high K+ o (Mock = 10, PM = 11, from 4–5 transfections; two‐way ANOVA, main effect of K+, F (1,10) = 20.85, P = 0.0010). The relative permeability ratio P K: P Na was estimated as 2.9 (2.8, 3.2). F, SARS‐CoV‐2 E protein is not permeable to NMDG (Mock = 11, PM = 10, from 4–5 transfections; two‐way ANOVA, main effect of NMDG: F (1,9) = 14.26, P = 0.0044, Bonferroni's post hoc test, P < 0.05 at V h < −85 mV (P = 0.0032 at −100 mV)). The relative permeability ratio of P Na: P Cs was estimated as 0.9 (0.7, 1.0). The values plotted in the graphs are expressed as means ± sd. [Color figure can be viewed at wileyonlinelibrary.com]
Figure 6
Figure 6. SARS‐CoV‐2 E PM expresses robust currents when expressed in Xenopus oocytes
A, exemplar current traces for Xenopus oocytes expressing WT (left panel) and untagged‐PM (right panel) as indicated, at pH 7.5 (30 ng cRNA). Voltage protocol and scale bars are shown in the inset. Dashed lines indicate zero current level. B, scatter plot of the unclamped membrane potential (E M) for oocytes expressing untagged‐PM (n = 35), WT (n = 20) or non‐injected (non‐inj) oocytes (triangles, n = 20) (statistical analysis by one‐way ANOVA (P = 0.0002) and Tukey's post hoc test, untagged‐PM vs. WT, P < 0.0001; untagged‐PM vs. non‐inj, P = 0.0064; WT vs. non‐inj, P = 0.3290). C, mean peak current versus voltage for oocytes after injection of 30 ng (mKate2‐tag) PM cRNA (diamonds, n = 5), 30 ng (squares, n = 17) or 60 ng ( squares, n = 8) untagged‐PM cRNA, or after injection of 30 ng WT cRNA (circles, n = 15). The mean peak current at +50 mV was equivalent between oocytes expressing tagged (3.1 ± 2.8 μA, n = 5) and untagged (3.6 ± 5.1 μA, n = 17) versions of the PM construct (Student's t‐test, P = 0.8336). cRNA encoding WT, PM and untagged‐PM constructs was generated from cDNA in the pXOOM vector. Two batches of oocytes were used for WT and untagged‐PM constructs and one batch for the PM construct. [Color figure can be viewed at wileyonlinelibrary.com]
Figure 7
Figure 7. The E protein is modulated by pH when expressed in Xenopus oocytes
A and B, exemplar current traces for untagged‐PM expressed (60 ng cRNA) in a single Xenopus oocyte at bath pH 6.0 (A) and pH 9.0 (B). Dashed lines indicate zero current level. Voltage protocol and scale bars inset. C, mean peak current versus voltage for oocytes after injection of 60 ng untagged‐PM cRNA, each studied at bath pH of 6 (squares), 7.5 (circles) and 9.0 (triangles) (n = 8), or non‐injected at pH 6 (squares, n = 20). D, mean data after normalization for each oocyte to the peak current of PM at +70 mV, pH 7.5. Statistical analysis by one‐way ANOVA and Tukey's post hoc test comparing normalized currents at −100 mV (main difference between pH solutions, P = 0.0189; pH 6.0 (−1.27 ± 0.32) vs. pH 7.5 (−0.95 ± 0.19), P = 0.0764; pH 6.0 vs. pH 9.0 (−0.86 ± 0.30), P = 0.0200; pH 7.5 vs. pH 9.0, P = 0.7980) and +50 mV (P = 0.0077; pH 6 (0.86 ± 0.15) vs. pH 7.5 (0.74 ± 0.04), P = 0.1150; pH 6 vs. pH 9 (0.66 ± 0.12), P = 0.0059; pH 7.5 vs. pH 9.0, P = 0.360). Data are presented as means ± sd. Two batches of oocytes were used for the experiment. [Color figure can be viewed at wileyonlinelibrary.com]

Comment in

Similar articles

Cited by

References

    1. Abbott GW (2016). KCNE1 and KCNE3: The yin and yang of voltage‐gated K+ channel regulation. Gene 576, 1–13. - PMC - PubMed
    1. Andersen KG, Rambaut A, Lipkin WI, Holmes EC & Garry RF (2020). The proximal origin of SARS‐CoV‐2. Nat Med 26, 450–452. - PMC - PubMed
    1. Arons MM, Hatfield KM, Reddy SC, Kimball A, James A, Jacobs JR, Taylor J, Spicer K, Bardossy AC, Oakley LP, Tanwar S, Dyal JW, Harney J, Chisty Z, Bell JM, Methner M, Paul P, Carlson CM, McLaughlin HP, Thornburg N, Tong S, Tamin A, Tao Y, Uehara A, Harcourt J, Clark S, Brostrom‐Smith C, Page LC, Kay M, Lewis J, Montgomery P, Stone ND, Clark TA, Honein MA, Duchin JS, Jernigan JA; Public Health–Seattle and King County and CDC COVID‐19 Investigation Team . (2020). Presymptomatic SARS‐CoV‐2 infections and transmission in a skilled nursing facility. N Engl J Med 382, 2081–2090. - PMC - PubMed
    1. Bedford T, Greninger AL, Roychoudhury P, Starita LM, Famulare M, Huang ML, Nalla A, Pepper G, Reinhardt A, Xie H, Shrestha L, Nguyen TN, Adler A, Brandstetter E, Cho S, Giroux D, Han PD, Fay K, Frazar CD, Ilcisin M, Lacombe K, Lee J, Kiavand A, Richardson M, Sibley TR, Truong M, Wolf CR, Nickerson DA, Rieder MJ, Englund JA; Seattle Flu Study Investigators , Hadfield J, Hodcroft EB, Huddleston J, Moncla LH, Müller NF, Neher RA, Deng X, Gu W, Federman S, Chiu C, Duchin JS, Gautom R, Melly G, Hiatt B, Dykema P, Lindquist S, Queen K, Tao Y, Uehara A, Tong S, MacCannell D, Armstrong GL, Baird GS, Chu HY, Shendure J & Jerome KR (2020). Cryptic transmission of SARS‐CoV‐2 in Washington state. Science 370, 571–575. - PMC - PubMed
    1. Bianchi M, Benvenuto D, Giovanetti M, Angeletti S, Ciccozzi M & Pascarella S (2020). Sars‐CoV‐2 envelope and membrane proteins: structural differences linked to virus characteristics? Biomed Res Int 2020, 4389089. - PMC - PubMed

Publication types