. 2020 Nov;3(11):2000133.
doi: 10.1002/adtp.202000133. Epub 2020 Aug 11.

A Human-Based Functional NMJ System for Personalized ALS Modeling and Drug Testing

Affiliations

A Human-Based Functional NMJ System for Personalized ALS Modeling and Drug Testing

Xiufang Guo et al. Adv Ther (Weinh). 2020 Nov.

Abstract

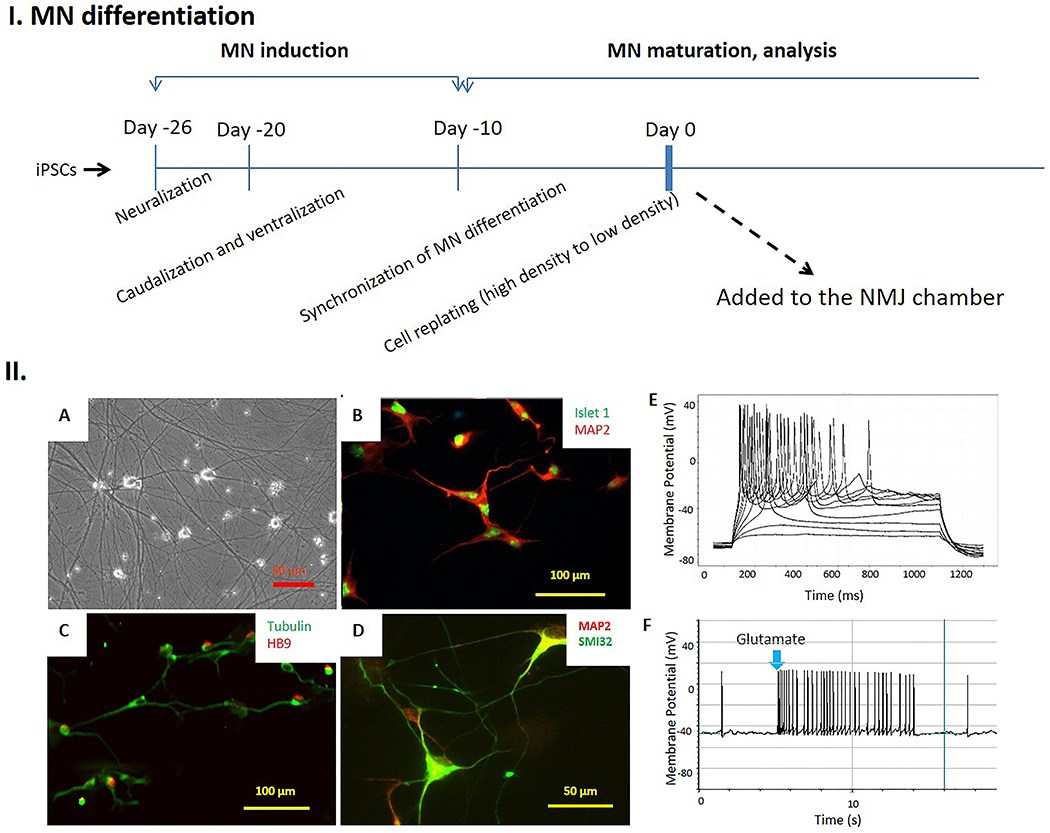
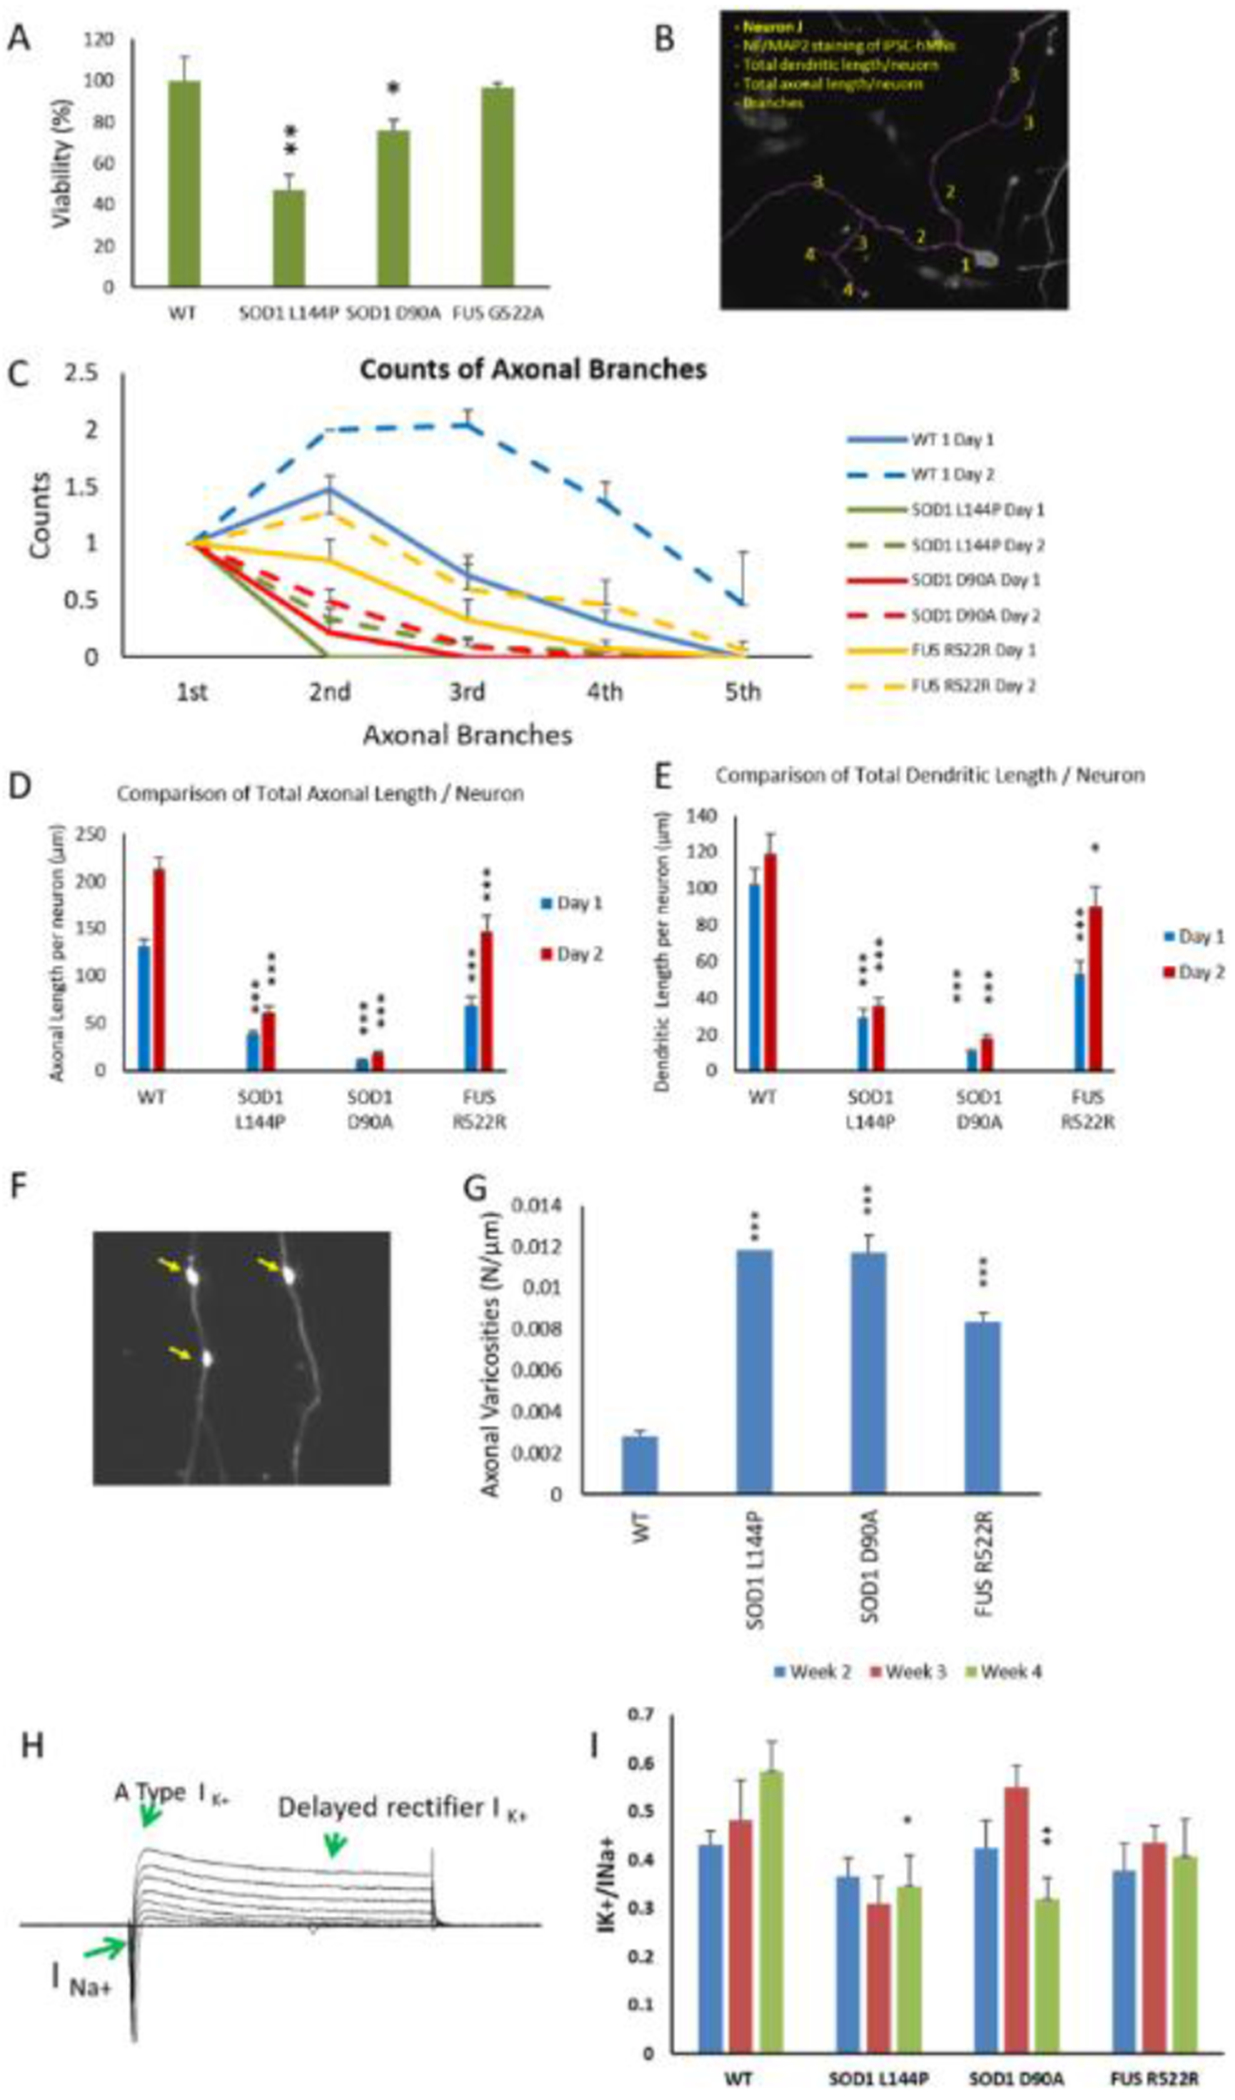
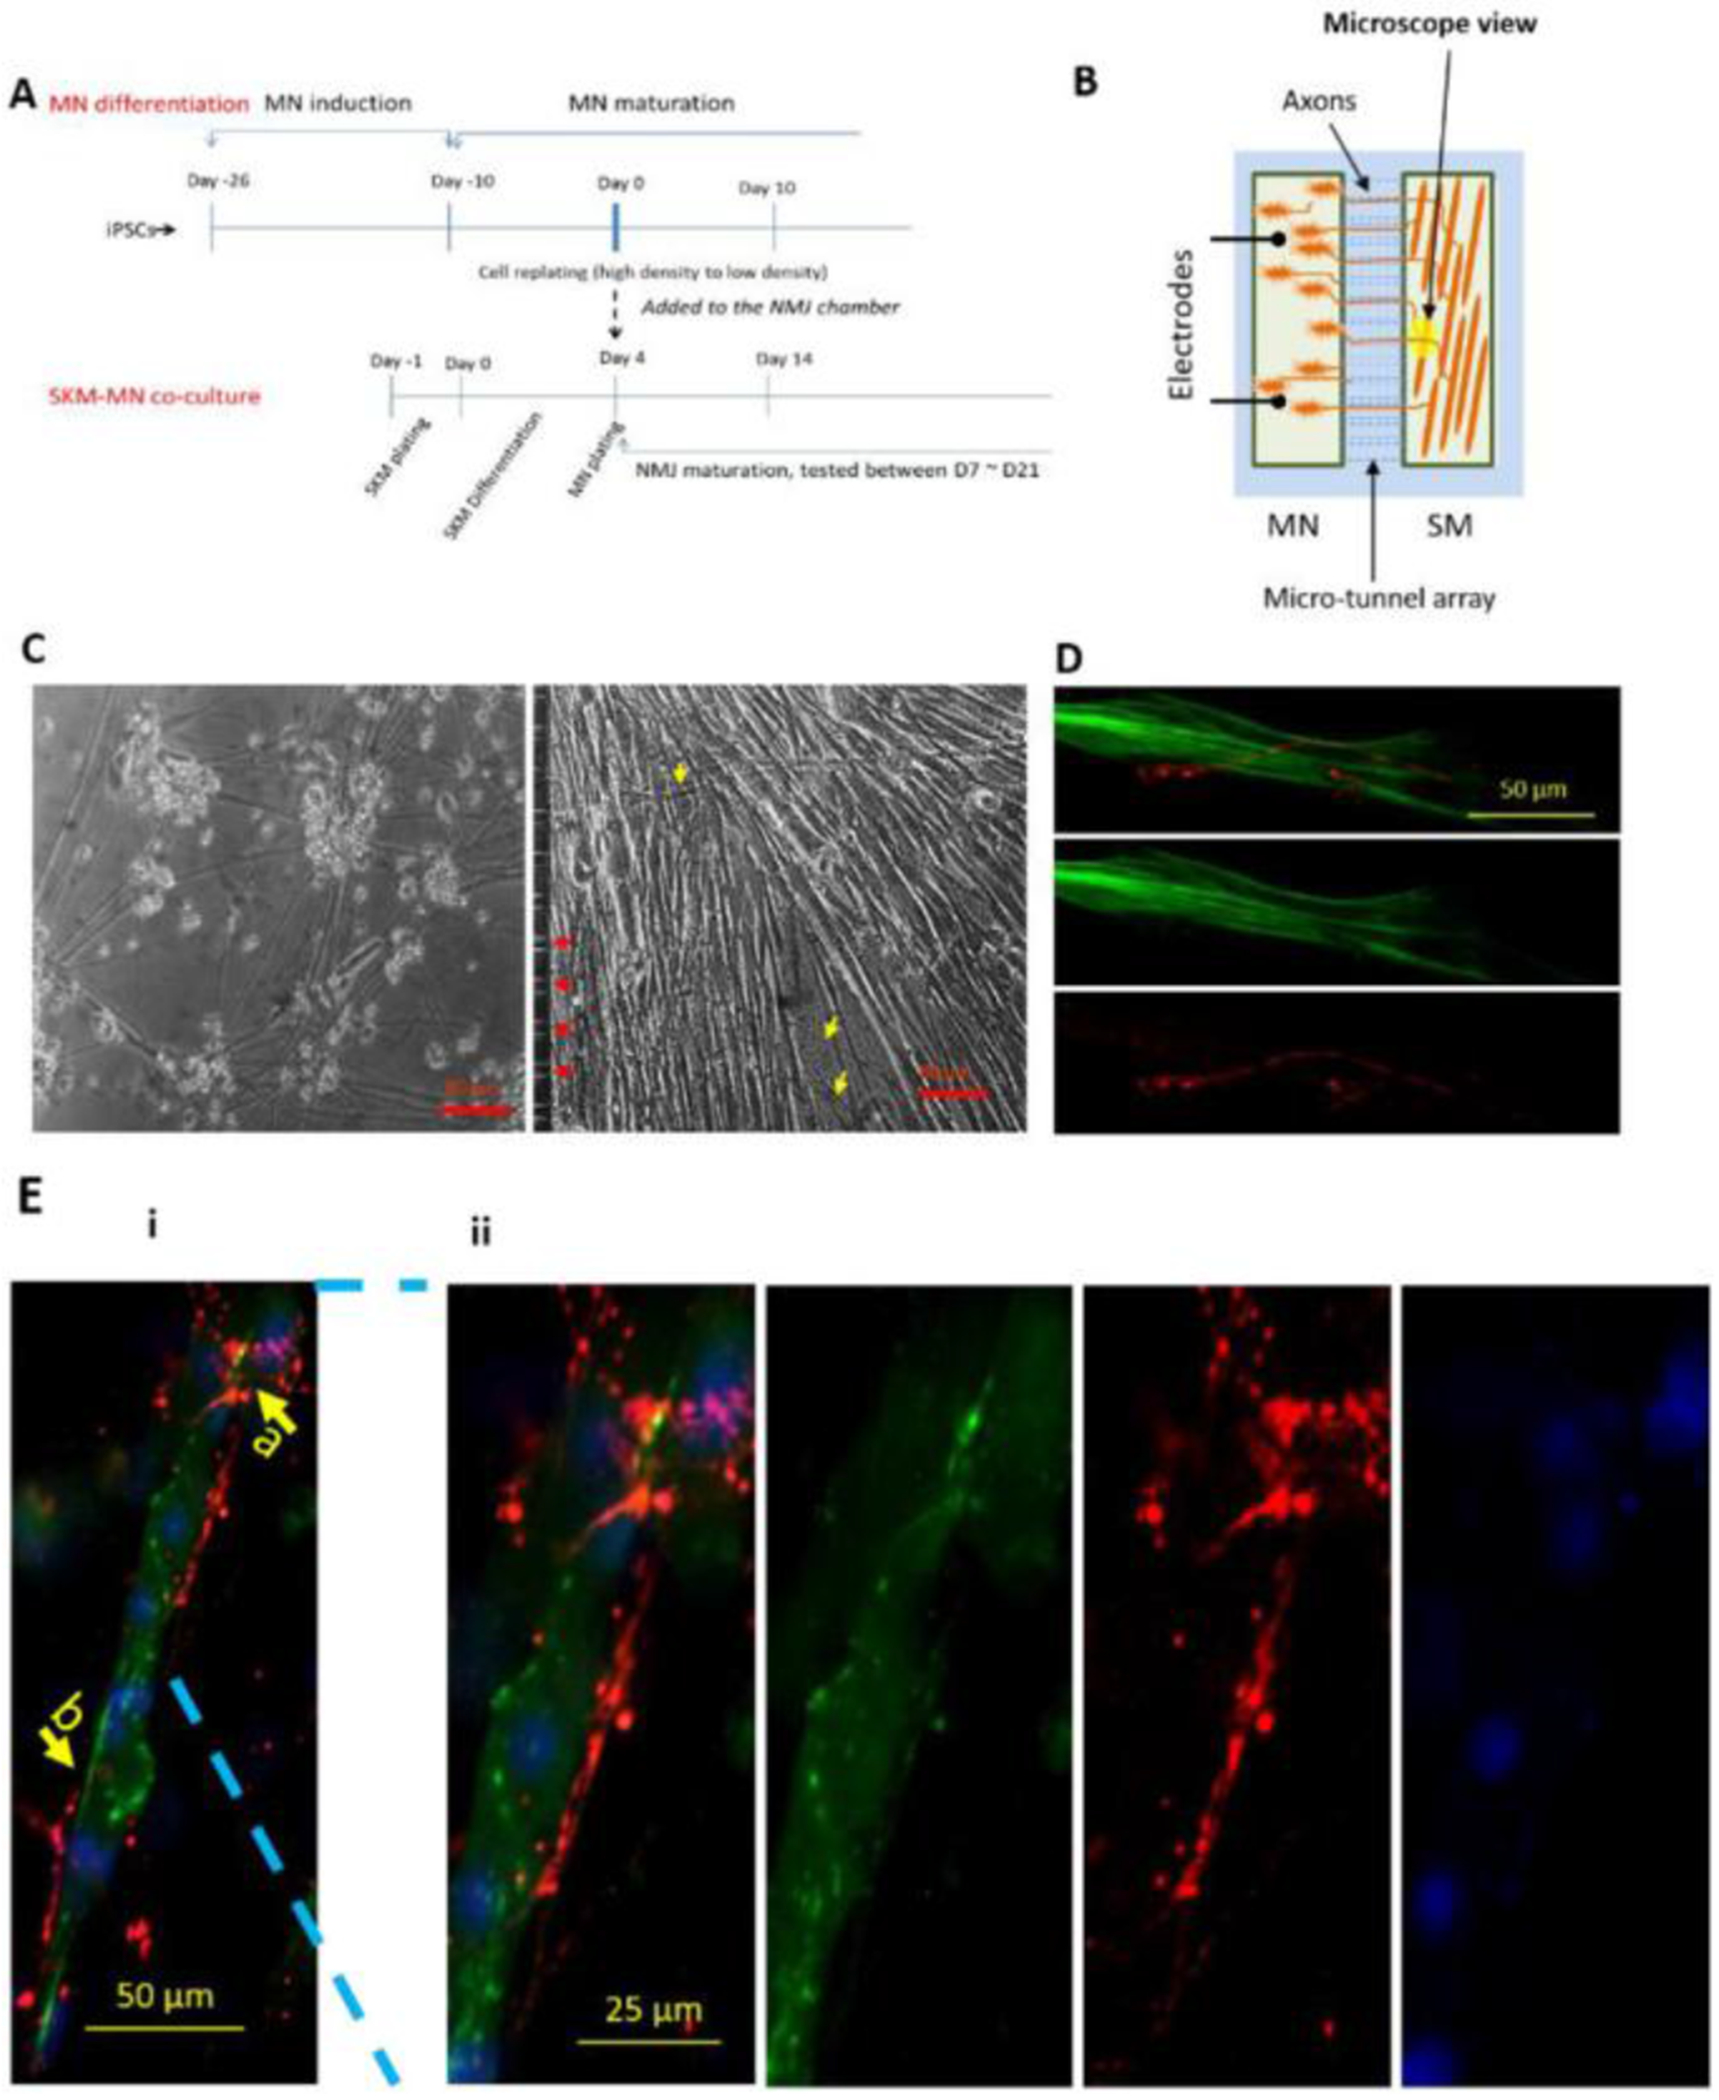
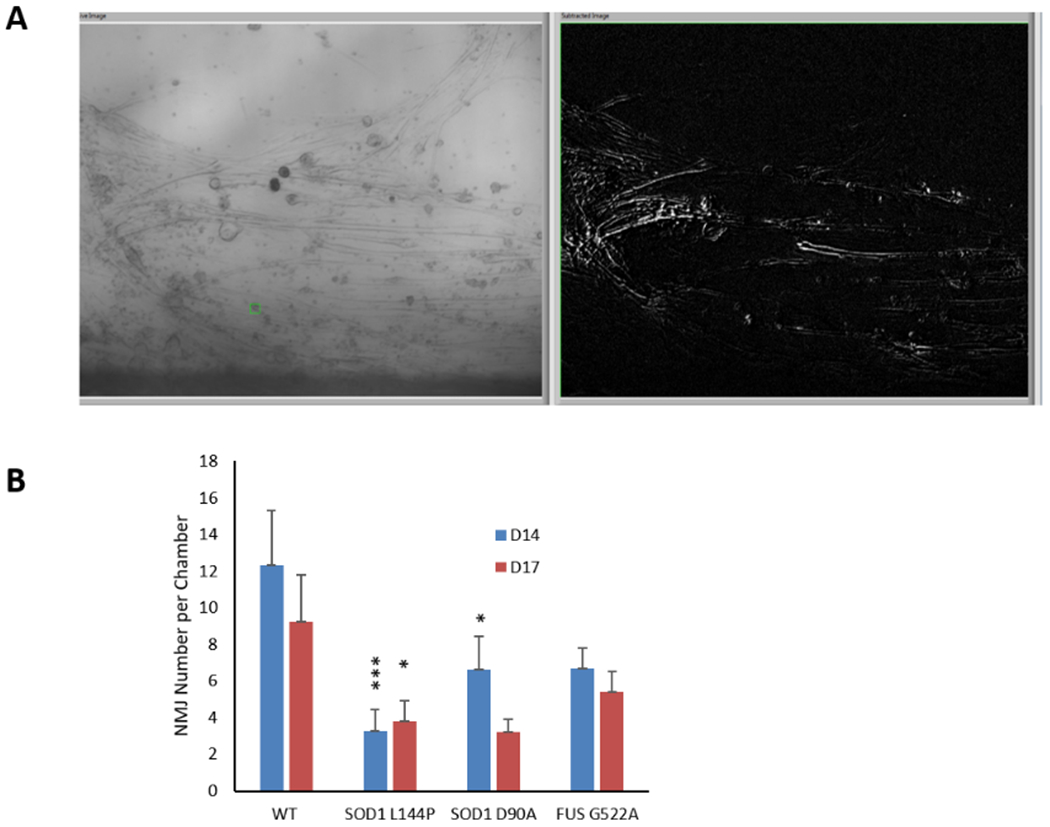
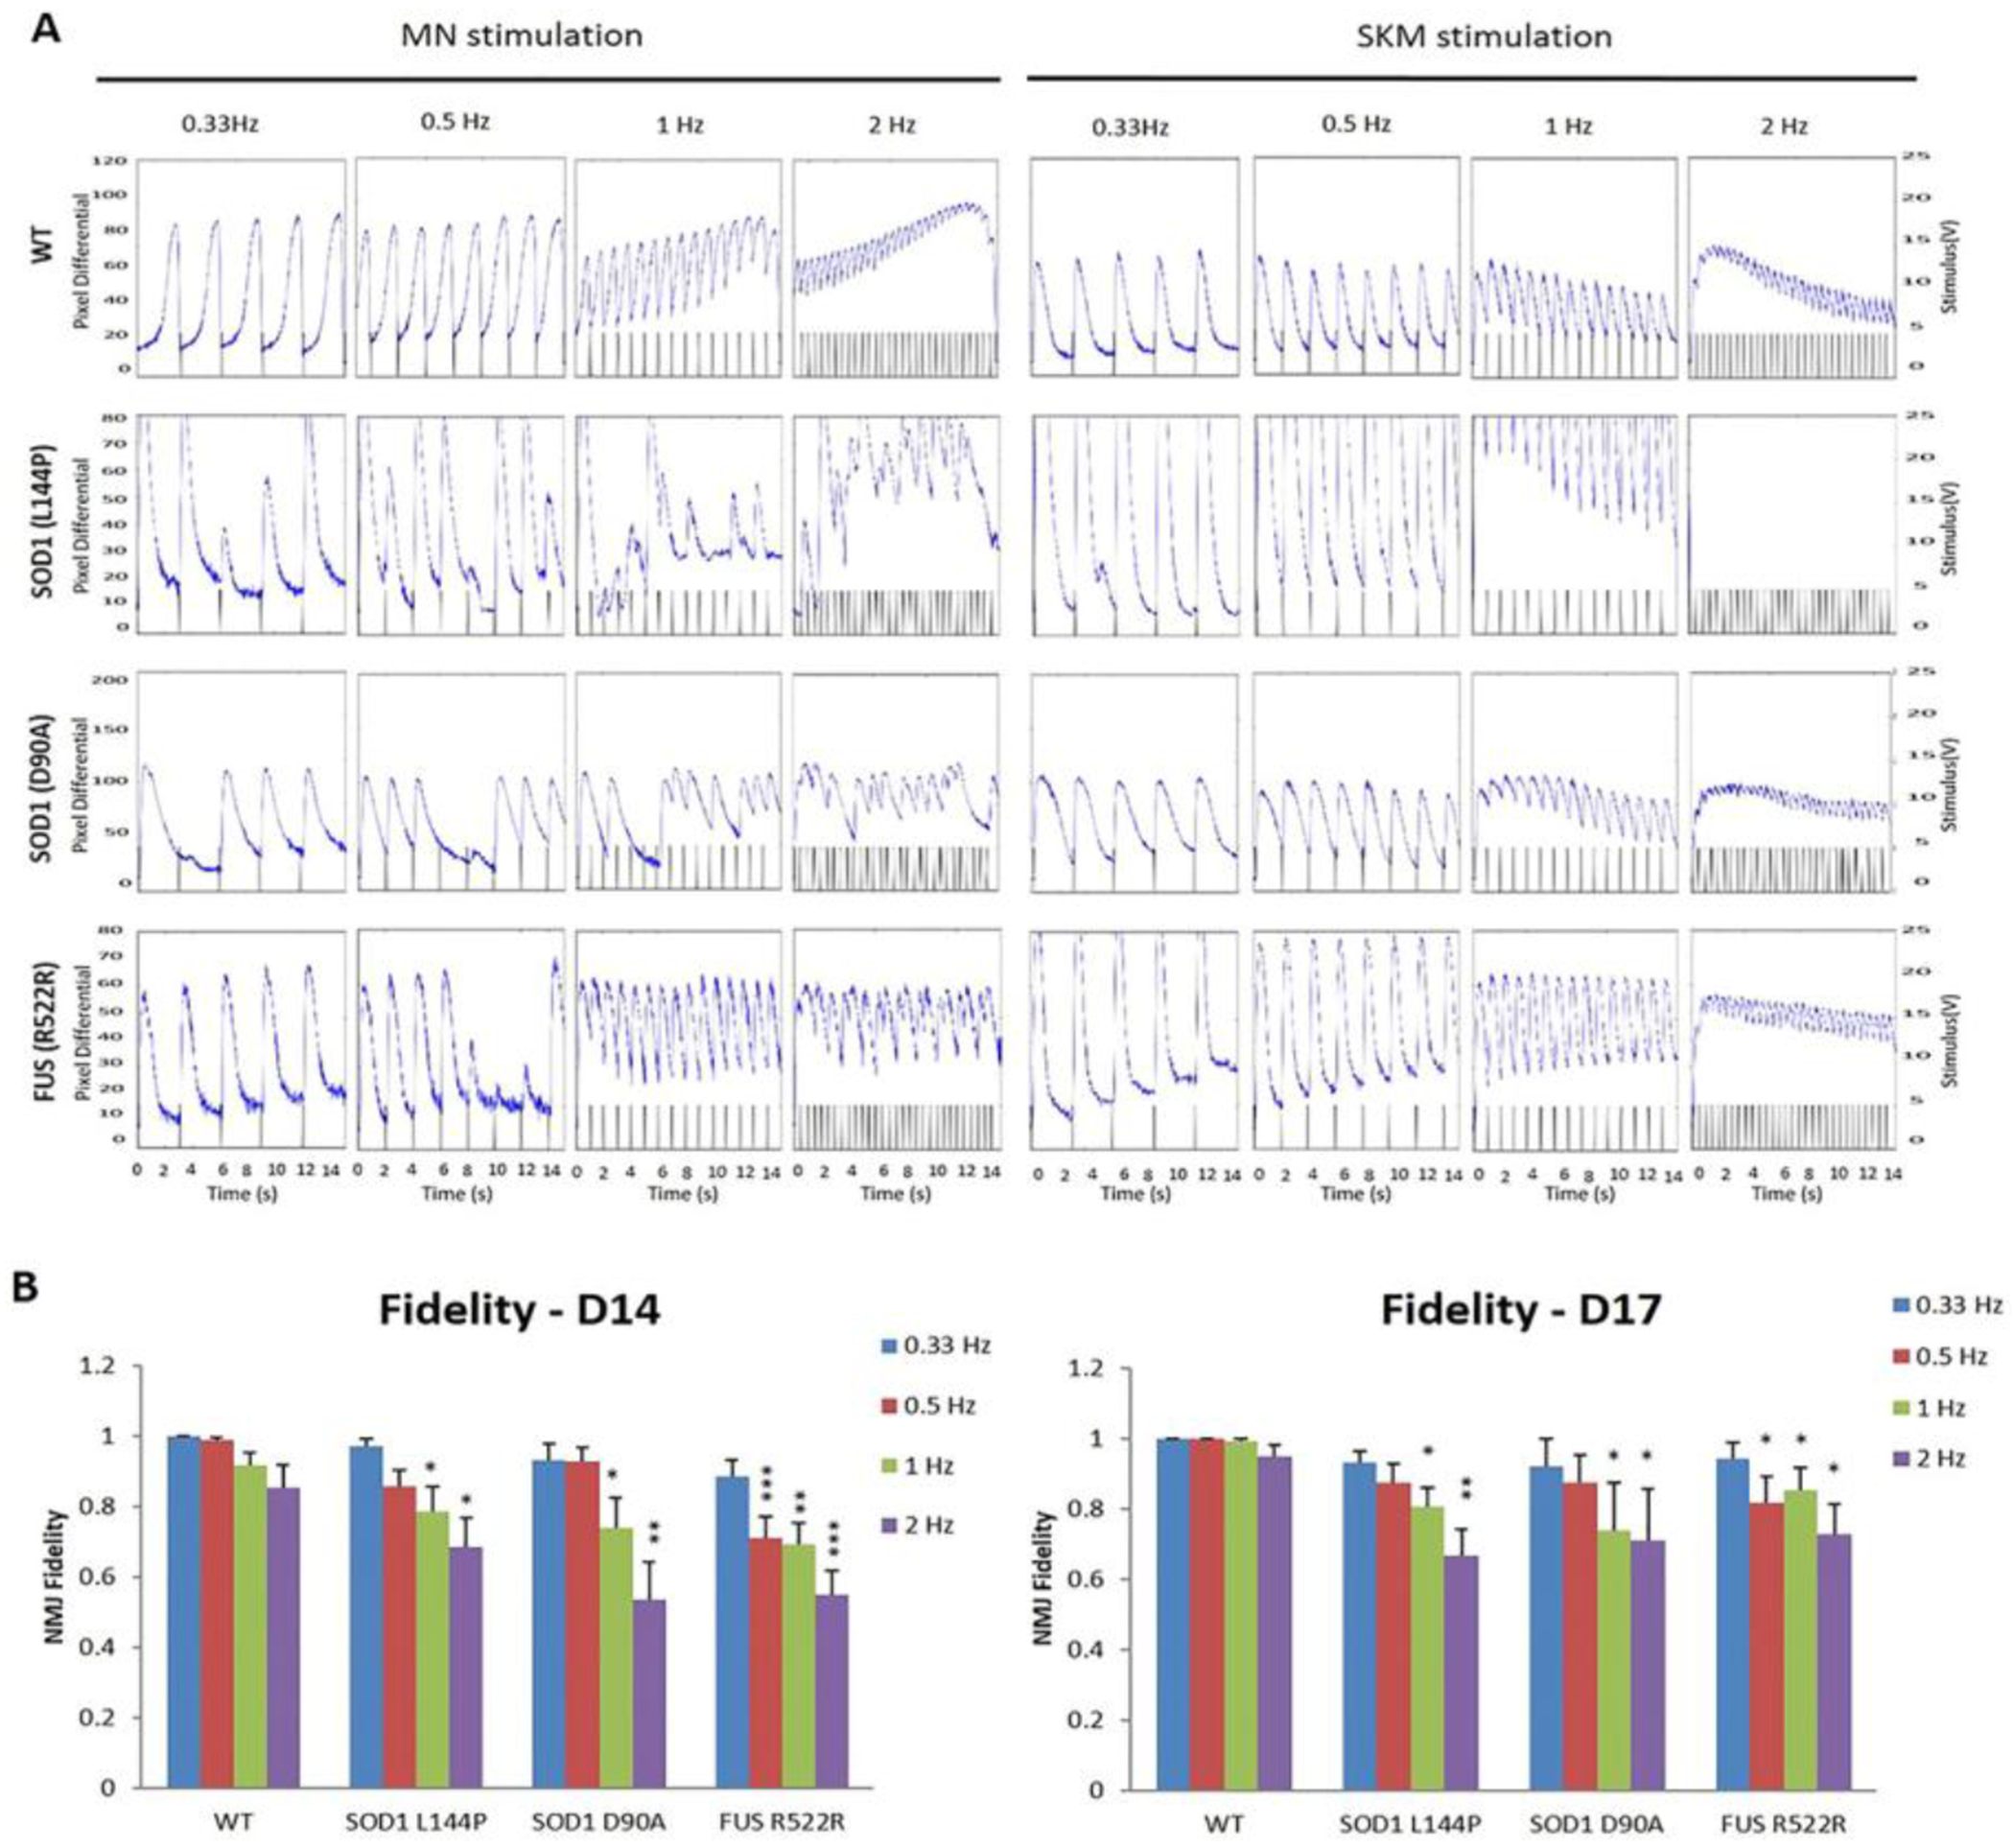
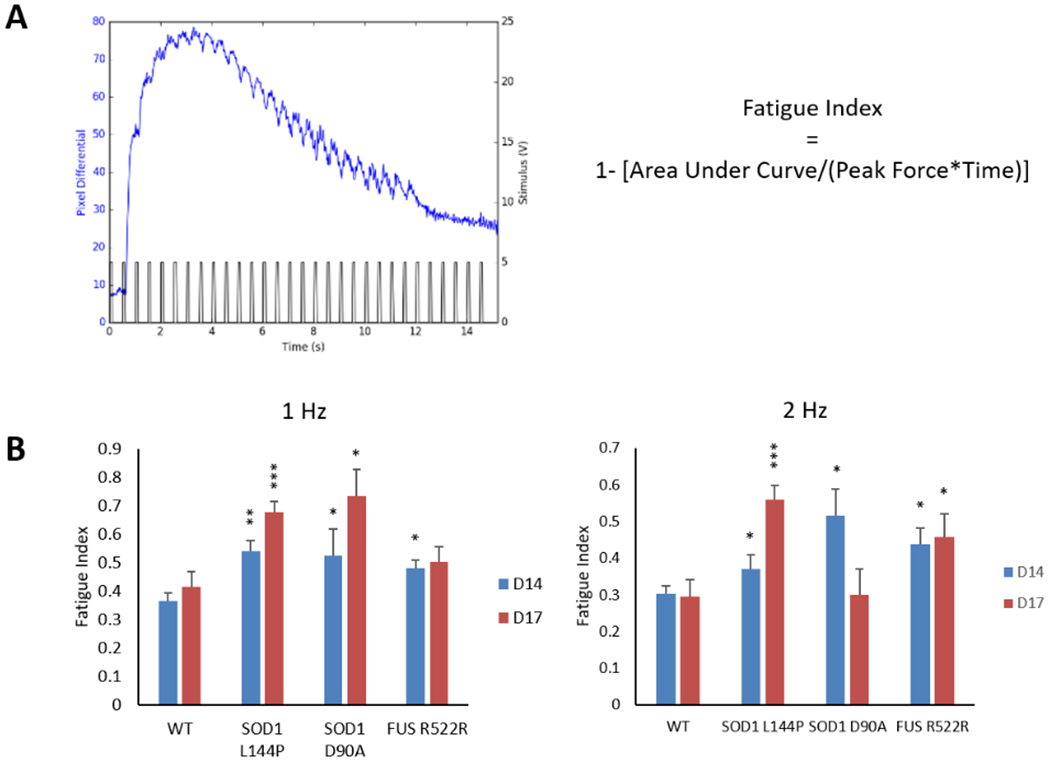
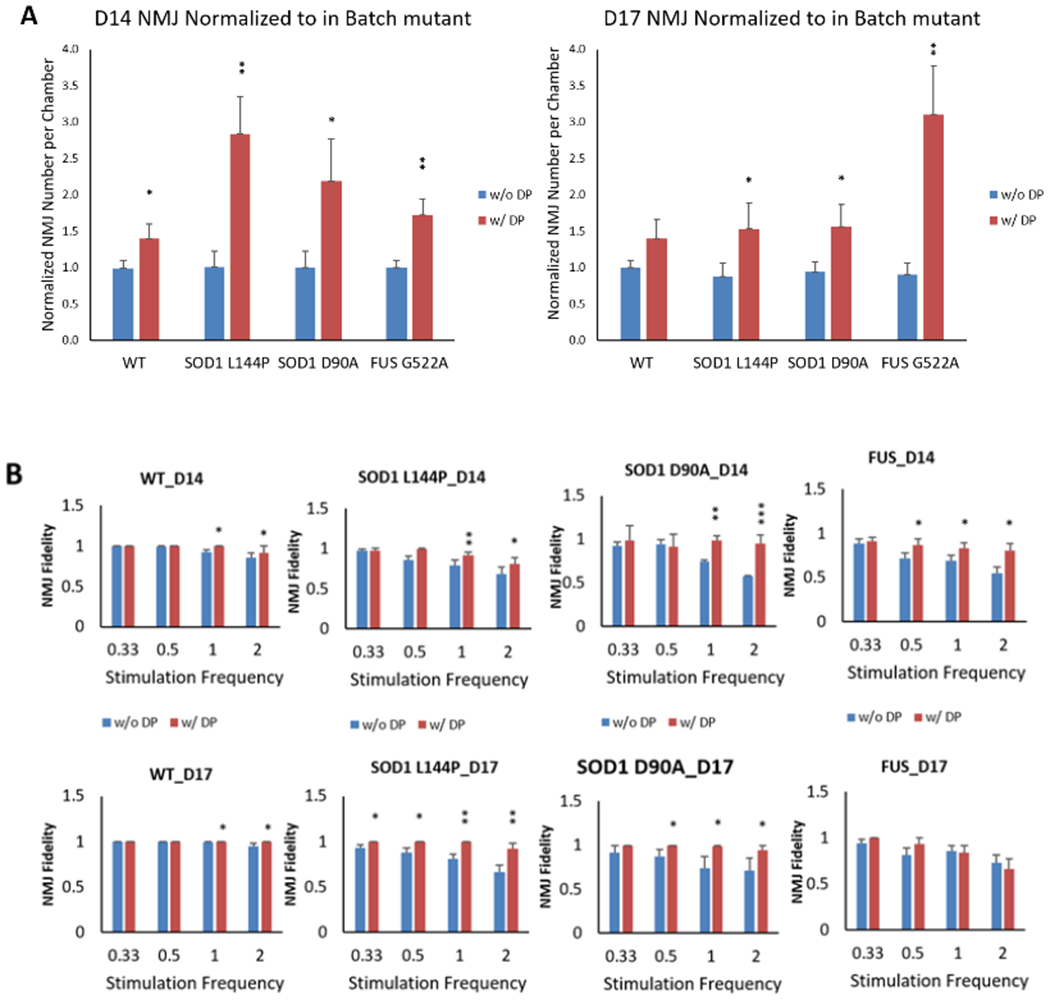
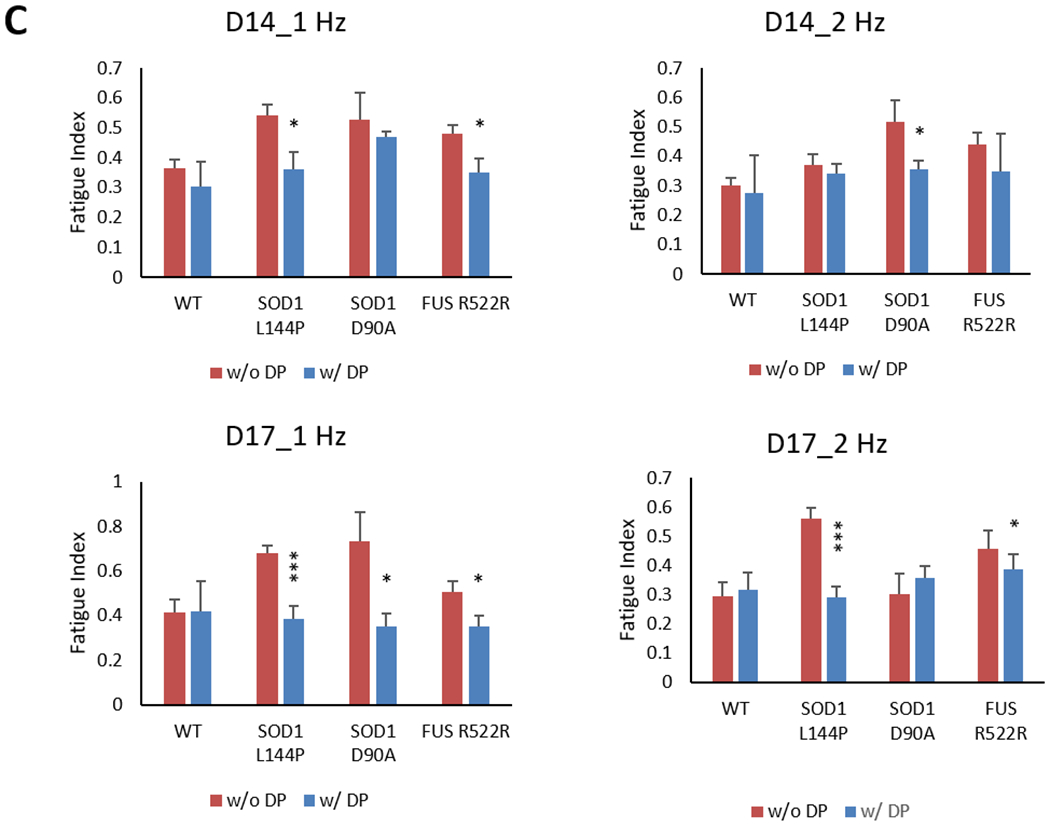
Loss of the neuromuscular junction (NMJ) is an early and critical hallmark in all forms of ALS. The study design was to develop a functional NMJ disease model by integrating motoneurons (MNs) differentiated from multiple ALS-patients' induced pluripotent stem cells (iPSCs) and primary human muscle into a chambered system. NMJ functionality was tested by recording myotube contractions while stimulating MNs by field electrodes and a set of clinically relevant parameters were defined to characterize the NMJ function. Three ALS lines were analyzed, 2 with SOD1 mutations and 1 with a FUS mutation. The ALS-MNs reproduced pathological phenotypes, including increased axonal varicosities, reduced axonal branching and elongation and increased excitability. These MNs formed functional NMJs with wild type muscle, but with significant deficits in NMJ quantity, fidelity and fatigue index. Furthermore, treatment with the Deana protocol was found to correct the NMJ deficits in all the ALS mutant lines tested. Quantitative analysis also revealed the variations inherent in each mutant lines. This functional NMJ system provides a platform for the study of both fALS and sALS and has the capability of being adapted into subtype-specific or patient-specific models for ALS etiological investigation and patient stratification for drug testing.

Keywords: ALS; functional model; human-based; neuromuscular junction; patient-specific.


Figures

Figure 1.
Figure 1.
Differentiation of functional motoneurons from human iPSCs. I. Scheme illustrating the major differentiation stages of the protocol for generating motoneurons from iPSCs. II. Immunocytochemical and electrophysiological characterization of hMNs differentiated from hiPSCs. A). Phase micrographs of the iPSC-derived hMNs. B-D). The neurons expressed motoneuron markers Islet1 (B), HB9 (C) and SMI32 (D) as well as the pan-neuronal markers MAP2 or β III Tubulin. E). Patch-clamp recordings from the differentiated neurons at Day 27 demonstrated repetitive firing during current clamp, indicating their excitability. F). Application of glutamate (500 µM) to the patched neurons elicited active firings, confirming their responsiveness to Glutamate.
Figure 2.
Figure 2.
Phenotypic analysis of ALS-MNs. MNs from 3 ALS-iPSC lines were analyzed and compared to WT. A) Viability of MNs derived from different iPSC lines. Cultures from the same batch of platings were fixed at D1 and D7 separately and immunostained with neuronal markers Neurofilament and MAP2. The number of MNs were imaged at 20X from the same area size of the coverslips, quantified and normalized to Day 1 within the same plating batch to eliminate any batch-related variation. All data from the mutant lines were then normalized to WT to eliminate cell death caused by any experimental procedure as a determinant variable. At least two coverslips were analyzed for each time point in each batch and all the data were normalized to the average of 3 coverslips from day 1 within the batch. For each genetic group, at least 2 batches of analysis were quantified. B-E) Morphological analysis of ALS-MNs. IPSC MNs from DIV1 and DIV2 were immunostained for neurofilament (NF) and MAP2 to visualize the axonal and dendritic morphology, respectively. The images were analyzed in Neuron J for quantification of branching and measurement of process length (an illustration of the morphological analysis procedure is displayed in (B)). ALS mutant MNs demonstrated reduced counts of axonal branches per neuron (C), total axonal length per neuron (D) and total dendritic length per neuron (E) on Day 1 and Day 2 of the cultures. All the comparisons were between mutant and WT on the same day for each ALS line. F-G) Quantification of axonal varicosities in each ALS-MN line. MNs on D17 were immunostained with SMI32 and axonal varicosities per neuron were counted in image J and normalized to axonal length (μm) (F). A significant increase of axonal varicosities was observed in all ALS-MN groups (G). H-I) Patch clamp analysis of ALS-MNs. (H) is a sample set of current recordings under voltage clamp. (I) Quantifications of the Na+ and K+ currents revealed a significant reduction of the K+(DR) /Na+ current ratio on week 4 in all three ALS-MN lines compared to the WT-MN line, suggesting a hyper-excitability phenotype. Data represent mean ± SEM. Asterisks indicate that the condition is significantly different than the WT at the same time point (Dunnett’s test): * p<0.1, ** p<0.01, *** P<0.001. For B-G, n≥ 30 neurons from at least 3 batches of culture were analyzed. For H-I, n≥5~17 neurons from at least 2 batches were analyzed.
Figure 3.
Figure 3.
Illustration of the NMJ system. IPSC-MNs were co-cultured separately with WT-SKM where the MN chamber and SKM chamber were connected through micro-tunnels that were axonal permissible, but chemical and electrical impermeable. A) The cell plating scheme for the NMJ cultures inside the micro-chambers. B) Diagram of NMJ chamber system illustrating the MN chamber and SKM chamber are connected via microtunnels, through which MNs sent axons to reach the muscle. MNs were stimulated by field electrodes and induced myofiber contractions were captured by pixel differentials through a phase contrast microscope connected to a video camera. C) Sample phase images of cells in the NMJ system demonstrating MNs in the MN chamber and myofibers in the muscle chamber. Red arrows indicated the tunnel openings for axonal exits and yellow arrows point to some axons in the muscle chamber. D and E) Immunocytochemistry analysis of NMJs in the chambers. D) An image from the muscle chamber indicating an axonal terminal (red, stained with neurofilament) branched at the terminal and wrapped around the myotube which was visualized with the marker myosin heavy chain (MHC, green). Ei) Co-immunostaining with Synaptophysin (red) and Bungarotoxin-488 (green) indicating potential synaptic sites. Arrow b points to a location where the presyanptic terminal is in close alignment with a post-synaptic receptor, while arrow a indicates a close apposition of the two. ii) An enlarged view of i) highlighting the detailed morphology at location a.
Figure 4.
Figure 4.
The number of functional NMJs per chamber was quantified by field-electrical stimulation of MNs in the MN chamber while recording induced myofiber contractions in the SKM chamber. A) A screen shot of an NMJ recording indicating multiple contracting myofibers upon electrical stimulation in the MN chamber. B) The number of functional NMJs per chamber were quantified and reduction of NMJ numbers was observed in all 3 mutant lines of MNs compared to WT (Dunnett’s test). Data represent Mean ± SEM. N≥ 20. Asterisks indicate that the condition is significantly different than the WT at the same time point (Dunnett’s test): *, P<0.1; **, P<0.01; ***, P<0.001.
Figure 5.
Figure 5.
NMJ fidelity was quantified as the percentage of successful induction of muscle contractions induced by motoneuron stimulation under four testing frequencies (0.3, 0.5, 1, and 2 Hz) at Days 14 & 17 in ALS-NMJ systems compared to WT controls. A) Sample traces of myofiber contractions under motoneuron stimulation and muscle direct stimulation, respectively, at four different frequencies from 3 ALS-NMJ systems and the WT controls. B) Quantification of NMJ fidelity compared between ALS mutant and WT groups (Dunnett’s test). Data represent Mean ± SEM. N≥10. Asterisks indicate that the condition is significantly different than the WT at the same time point (Dunnett’s test): * p<0.1, ** p<0.01, *** p<0.001.
Figure 6.
Figure 6.
Determination of fatigue Index in the ALS-NMJs. A) A representative myofiber contraction trace under 2 Hz stimulation from the MN chamber. The formula for calculating NMJ fatigue is the same as the physiological measurement of in vivo fatigue. B) Fatigue Index in ALS-NMJs were significantly higher than those in WT-NMJs under both 1 Hz and 2 Hz stimulations. Quantification of each ALS mutant was compared to WT for correspondent stimulation frequencies and culture days (Dunnett’s test). Data represent Mean ± SEM. N≥3. Asterisks indicate that the condition is significantly different than the WT at the same time point (Dunnett’s test): *, P<0.1; **, P<0.01; ***, P<0.001.
Figure 7.
Figure 7.
ALS-NMJ functional phenotypic deficits were improved by the DP drug treatment. A) The NMJ numbers per chamber normalized to in-batch control without DP for each genetic line. NMJ number was increased in all the ALS-NMJ conditions after DP treatment, while FUS-NMJs showed more improvement at D17 than SOD1-NMJ mutant at D14. N≥9. B) NMJ fidelity was improved by DP treatment for all the ALS mutants at D17, but only for SOD1 mutants at D14. N≥5. C) NMJ fatigue Index was corrected by DP treatment for all the mutants. Quantifications were compared between with and without DP treatment for each mutant (Student’s t-test, two-tailed). Data represent Mean ± SEM. N≥3. For all analysis, asterisks indicate that the condition is significantly different than the WT at the same time point (Dunnett’s test): *, P<0.1; **, P<0.01; ***, P<0.001.
Figure 7.
Figure 7.
ALS-NMJ functional phenotypic deficits were improved by the DP drug treatment. A) The NMJ numbers per chamber normalized to in-batch control without DP for each genetic line. NMJ number was increased in all the ALS-NMJ conditions after DP treatment, while FUS-NMJs showed more improvement at D17 than SOD1-NMJ mutant at D14. N≥9. B) NMJ fidelity was improved by DP treatment for all the ALS mutants at D17, but only for SOD1 mutants at D14. N≥5. C) NMJ fatigue Index was corrected by DP treatment for all the mutants. Quantifications were compared between with and without DP treatment for each mutant (Student’s t-test, two-tailed). Data represent Mean ± SEM. N≥3. For all analysis, asterisks indicate that the condition is significantly different than the WT at the same time point (Dunnett’s test): *, P<0.1; **, P<0.01; ***, P<0.001.

Similar articles

Cited by

References

    1. Ticozzi N, and Silani V, in Neurodegenerative Diseases: Clinical Aspects, Molecular Genetics and Biomarkers, Vol ;
    2. Beghi E, Mennini T, Bendotti C, Bigini P, Logroscino G, Chio A, Hardiman O, Mitchell D, Swingler R, Traynor BJ, and Al-Chalabi A, Curr. Med. Chem. 2007, 14, 3185–200. - PubMed
    1. Rohrer JD, Isaacs AM, Mizielinska S, Mead S, Lashley T, Wray S, Sidle K, Fratta P, Orrell RW, Hardy J, Holton J, Revesz T, Rossor MN, and Warren JD, The Lancet Neurology 2015, 14, 291–301; - PubMed
    2. Taylor JP, Brown RH, and Cleveland DW, Nature 2016, 539, 197–206. - PMC - PubMed
    1. Serio A, and Patani R, Stem Cells 2018, 36, 293–303; - PubMed
    2. Yamanaka K, Chun SJ, Boillee S, Fujimori-Tonou N, Yamashita H, D. H., Takahashi R, Misawa H, and Cleveland DW, Nat. Neurosci. 2008, 11, 251–253; - PMC - PubMed
    3. Frakes Ashley E., Ferraiuolo L, Haidet-Phillips Amanda M., Schmelzer L, Braun L, Miranda Carlos J., Ladner Katherine J., Bevan Adam K., Foust Kevin D., Godbout Jonathan P., Popovich Phillip G., Guttridge Denis C., and Kaspar Brian K., Neuron 81, 1009–1023. - PMC - PubMed
    1. Sabatelli M, Conte A, and Zollino M, Clin. Genet. 2013, 83, 408–416. - PubMed
    1. Campanari M-L, García-Ayllón M-S, Ciura S, Sáez-Valero J, and Kabashi E, Front. Mol. Neurosci. 2016, 9, 160–160. - PMC - PubMed