Devitrification reduces beam-induced movement in cryo-EM
- PMID: 33708396
- PMCID: PMC7924229
- DOI: 10.1107/S2052252520016243
Devitrification reduces beam-induced movement in cryo-EM
Abstract
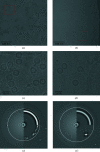
As cryo-EM approaches the physical resolution limits imposed by electron optics and radiation damage, it becomes increasingly urgent to address the issues that impede high-resolution structure determination of biological specimens. One of the persistent problems has been beam-induced movement, which occurs when the specimen is irradiated with high-energy electrons. Beam-induced movement results in image blurring and loss of high-resolution information. It is particularly severe for biological samples in unsupported thin films of vitreous water. By controlled devitrification of conventionally plunge-frozen samples, the suspended film of vitrified water was converted into cubic ice, a polycrystalline, mechanically stable solid. It is shown that compared with vitrified samples, devitrification reduces beam-induced movement in the first 5 e Å-2 of an exposure by a factor of ∼4, substantially enhancing the contribution of the initial, minimally damaged frames to a structure. A 3D apoferritin map reconstructed from the first frames of 20 000 particle images of devitrified samples resolved undamaged side chains. Devitrification of frozen-hydrated specimens helps to overcome beam-induced specimen motion in single-particle cryo-EM, as a further step towards realizing the full potential of cryo-EM for high-resolution structure determination.
Keywords: beam-induced movement; cryo-EM; devitrification.
© Wieferig et al. 2021.
Figures


Similar articles
-
Beam-induced motion of vitrified specimen on holey carbon film.J Struct Biol. 2012 Mar;177(3):630-7. doi: 10.1016/j.jsb.2012.02.003. Epub 2012 Feb 16. J Struct Biol. 2012. PMID: 22366277 Free PMC article.
-
Thon rings from amorphous ice and implications of beam-induced Brownian motion in single particle electron cryo-microscopy.Ultramicroscopy. 2015 Nov;158:26-32. doi: 10.1016/j.ultramic.2015.05.017. Epub 2015 May 27. Ultramicroscopy. 2015. PMID: 26103047 Free PMC article.
-
Specimen Behavior in the Electron Beam.Methods Enzymol. 2016;579:19-50. doi: 10.1016/bs.mie.2016.04.010. Epub 2016 May 31. Methods Enzymol. 2016. PMID: 27572722 Review.
-
A comparative study of single-particle cryo-EM with liquid-nitrogen and liquid-helium cooling.IUCrJ. 2019 Oct 22;6(Pt 6):1099-1105. doi: 10.1107/S2052252519011503. eCollection 2019 Nov 1. IUCrJ. 2019. PMID: 31709065 Free PMC article.
-
Toward Compositional Contrast by Cryo-STEM.Acc Chem Res. 2021 Oct 5;54(19):3621-3631. doi: 10.1021/acs.accounts.1c00279. Epub 2021 Sep 7. Acc Chem Res. 2021. PMID: 34491730 Review.
Cited by
-
High-resolution single-particle cryo-EM of samples vitrified in boiling nitro-gen.IUCrJ. 2021 Sep 7;8(Pt 6):867-877. doi: 10.1107/S2052252521008095. eCollection 2021 Nov 1. IUCrJ. 2021. PMID: 34804541 Free PMC article.
-
Determining protein structures in cellular lamella at pseudo-atomic resolution by GisSPA.Nat Commun. 2023 Mar 15;14(1):1282. doi: 10.1038/s41467-023-36175-y. Nat Commun. 2023. PMID: 36922493 Free PMC article.
-
Selecting optimal support grids for super-resolution cryogenic correlated light and electron microscopy.Sci Rep. 2023 May 22;13(1):8270. doi: 10.1038/s41598-023-35590-x. Sci Rep. 2023. PMID: 37217690 Free PMC article.
-
On the reduction in the effects of radiation damage to two-dimensional crystals of organic and biological molecules at liquid-helium temperature.Ultramicroscopy. 2022 Jul;237:113512. doi: 10.1016/j.ultramic.2022.113512. Epub 2022 Mar 19. Ultramicroscopy. 2022. PMID: 35367901 Free PMC article.
-
Microsecond melting and revitrification of cryo samples.Struct Dyn. 2021 Oct 26;8(5):054302. doi: 10.1063/4.0000129. eCollection 2021 Sep. Struct Dyn. 2021. PMID: 34734102 Free PMC article.
References
-
- Bartels-Rausch, T., Bergeron, V., Cartwright, J. H. E., Escribano, R., Finney, J. L., Grothe, H., Gutiérrez, P. J., Haapala, J., Kuhs, W. F., Pettersson, J. B. C., Price, S. D., Sainz-Díaz, C. I., Stokes, D. J., Strazzulla, G., Thomson, E. S., Trinks, H. & Uras-Aytemiz, N. (2012). Rev. Mod. Phys. 84, 885–944.
-
- Booy, F. P. & Pawley, J. B. (1993). Ultramicroscopy, 48, 273–280. - PubMed
Grants and funding
LinkOut - more resources
Full Text Sources
Other Literature Sources
Research Materials

