. 2021 Feb 23:11:607891.
doi: 10.3389/fimmu.2020.607891. eCollection 2020.

MAPKAP Kinase-2 Drives Expression of Angiogenic Factors by Tumor-Associated Macrophages in a Model of Inflammation-Induced Colon Cancer

Affiliations

MAPKAP Kinase-2 Drives Expression of Angiogenic Factors by Tumor-Associated Macrophages in a Model of Inflammation-Induced Colon Cancer

Lucia Suarez-Lopez et al. Front Immunol. .

Abstract

Chronic inflammation increases the risk for colorectal cancer through a variety of mechanisms involving the tumor microenvironment. MAPK-activated protein kinase 2 (MK2), a major effector of the p38 MAPK stress and DNA damage response signaling pathway, and a critical regulator of pro-inflammatory cytokine production, has been identified as a key contributor to colon tumorigenesis under conditions of chronic inflammation. We have previously described how genetic inactivation of MK2 in an inflammatory model of colon cancer results in delayed tumor progression, decreased tumor angiogenesis, and impaired macrophage differentiation into a pro-tumorigenic M2-like state. The molecular mechanism responsible for the impaired angiogenesis and tumor progression, however, has remained contentious and poorly defined. Here, using RNA expression analysis, assays of angiogenesis factors, genetic models, in vivo macrophage depletion and reconstitution of macrophage MK2 function using adoptive cell transfer, we demonstrate that MK2 activity in macrophages is necessary and sufficient for tumor angiogenesis during inflammation-induced cancer progression. We identify a critical and previously unappreciated role for MK2-dependent regulation of the well-known pro-angiogenesis factor CXCL-12/SDF-1 secreted by tumor associated-macrophages, in addition to MK2-dependent regulation of Serpin-E1/PAI-1 by several cell types within the tumor microenvironment.

Keywords: MAPKAP kinase 2; angiogenesis; colon tumors; inflammation driven tumorigenesis; signal transduction; stress signaling; tumor associated macrophage (TAM).


Conflict of interest statement

The authors declare that the research was conducted in the absence of any commercial or financial relationships that could be construed as a potential conflict of interest.

Figures
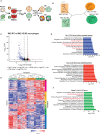
Figure 1
Figure 1
MK2 deficiency markedly alters the transcriptional program during M2 macrophage polarization. (A) Experimental scheme for polarization of bone marrow-derived cells from MK2 WT and MK2 KO mice into M0 and M2 macrophages. (B) Dendrogram visualization of unsupervised hierarchical clustering analysis of RNA-Seq data for M0 and M2-polarized macrophages derived from MK2 WT and KO mice. (C) Volcano plot showing the significantly expressed differential genes following edgeR analysis of M2 macrophages derived from MK2 WT and KO mice. (D) GSEA analysis identifies the top 12 down- and up-regulated GO terms that differ between M2-polarized macrophages derived from MK2 WT and KO mice. (E) Heatmap of RNA-Seq expression for genes that are differentially expressed between MK2 WT M0, MK2 WT M2, MK2 KO M0 and MK2 KO M2 (FDR <0.05, all pairwise comparisons). Expression values were converted to z-scores to facilitate visualization. (F) Hypergeometric test GSEA identification of the top 12 GO terms corresponding to genes in cluster 6 of panel E that are dysregulated in MK2-deficient macrophages, compared to WT macrophages, following M2 polarization.
Figure 2
Figure 2
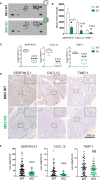
MK2 deficiency halts the production and secretion of pro-angiogenic factors. (A) Representative images of Mouse Angiogenesis Protein Array (R&D) membranes. Squares highlight the spots corresponding to Timp-1 (1), Serpin-E1 (2) and Cxcl-12 (3). (B) Protein quantification of Timp-1, Serpin-E1, and Cxcl-12 in macrophage culture supernatants from M2-polarized MK2-WT or KO macrophages. Spot intensity was quantified in ImageJ. Data corresponds to three membranes per genotype, where culture supernatants from three independent biological replicates were tested. (C) RNA quantification of Timp-1, Serpin-E1, and Cxcl-12 from M2-polarized MK2-WT or KO macrophages from the experiments shown Figure 1 . Box and whisker plots display median (line), 25th to 75th percentiles (boxes) and min and maximum (whiskers) RNA expression levels from 6 biological replicates each of MK2-WT and KO macrophages. (D) Representative pictures of angiogenic factors detected by immunohistochemistry in MK2 WT (upper panel, 10 mice) and MK2 KO (lower panel, 5 mice) colon tumors. (E) Stained slides from serial sections of Swiss-rolled entire colons were scanned and quantified in an automated manner using the positive nuclei algorithm in ImageScope and normalized by area analyzed in mm2. Each data point corresponds to a single tumor area, and all tumors from all mice with the same genotype [MK2 WT (10 mice) and MK2 KO (5 mice)] are shown. Scale bar 300 µm. In panels (B, C, E) statistical significance was determined using the Student’s t test. *p-value < 0.05; ***p-value < 0.001, ****p-value < 0.0001; ns, not significant.
Figure 3
Figure 3
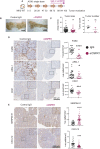
Cxcl-12 is mainly produced by tumor-associated macrophages in colon tumors. (A) Chronic colon inflammation was induced by 2.5% DSS administration in the drinking water for 5 days, every 21 days for a total of 5 cycles. 10 mg/kg AOM was intraperitoneally administered at the start of the treatment to generate colon tumors. Macrophages were immunodepleted with anti-CSFR1 once weekly from day 68 to the end of the protocol. IgG was used as isotype control. (B) Representative pictures from distal colons portions from IgG controls (left) and macrophage-depleted (right) mice at the time of tumor evaluation. Note the smaller tumor size in macrophage-depleted mice. Scale bar 5mm. (C) All tumors in all of the mice (6 mice total per group) were blindly counted under the dissecting microscope and tumor areas quantified using ImageJ. (D) Representative pictures of macrophage marker F4/80, M2 marker Arginase-1 and blood vessels marker CD31 detected by immunohistochemistry on macrophage-depleted and corresponding isotype controls. Stained slides were scanned, and positive cells were automated counted within tumor areas using the positive pixel or nuclei positive algorithm in ImageScope. Strong positive counts were normalized by area of tumor analyzed in mm2. Each data point reflects a single quantified tumor area from all tumors in all mice within the same treatment group. Scale bar 300 µm. (E) Representative pictures of angiogenic factors immunodetection on macrophage-depleted mice and corresponding isotype controls. Scanned pictures were analyzed as in (D) Scale bar 300µm *p-value < 0.05; ***p-value < 0.001; ****p-value < 0.0001; ns, not significant. Student’s t test.
Figure 4
Figure 4
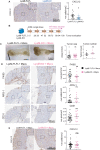
MK2 regulates macrophage production of CXCL-12 to support angiogenesis during inflammation-associated tumorigenesis. (A) Representative pictures of immunodetection of Cxcl-12 on myeloid-specific MK2 KO mice (LysM-KO, 7 mice) and corresponding littermate controls (LysM-FLFL, 4 mice). Stained slides from serial sections of swiss-rolled entire colons were scanned and positive cells were automated counted within tumor areas using the positive pixel algorithm in ImageScope. Strong positive pixels counts were normalized by area of tumor analyzed in mm2. Each data point corresponds to a single tumor area, and all tumors from all mice with the same genotype are shown. Scale bar 300μm. (B) Colon tumors were induced by AOM/DSS protocol and both LysM-KO and littermate controls LysM-FLFL mice were transferred with WT macrophages once weekly from day 68 to the end of the protocol. (C) Representative pictures from distal colons portions from LysM-FLFL (left) and myeloid-specific MK KO LysM-KO (right) mice after WT macrophage transfer. Note the similar size of tumor generated in both groups. Scale bar 5mm. Tumors from macrophage transferred LysM-FLFL (7 mice) and LysM-KO (9 mice) were blindly counted under the dissecting scope and areas were quantified using ImageJ. (D) Representative pictures of macrophage marker F4/80, M2 marker Arginase-1 and blood vessels marker CD31 immunodetection on colon tumors from macrophage transferred LysM-KO and LysM-FLFL mice. Stained slides from serial sections of swiss-rolled entire colons were quantified as in panel (A) Scale bar 300 µm. (E) Representative pictures of Cxcl-12 detection by immunohistochemistry on tumors from macrophage-transferred mice, and serial sections of swiss-rolled entire colons analyzed as in panels (A, D) Scale bar 300 µm *p-value < 0.05; ns, not significant. Student’s t test.
Figure 5
Figure 5
MK2 regulates the expression of Cxcl-12 in TAMs to promote angiogenesis and tumor progression. MK2 activity is required for expression of Cxcl-12 in tumor associated macrophages, and for Serpin-E1 expression within the tumor microenvironment, promoting tumor angiogenesis and progression. Mouse images courtesy of Clker/Barretto. Tumor angiogenesis, macrophages, and carcinoma images adapted from Servier Medical Art.

Similar articles

Cited by

References

    1. Bray F, Ferlay J, Soerjomataram I, Siegel RL, Torre LA, Jemal A. Global cancer statistics 2018: GLOBOCAN estimates of incidence and mortality worldwide for 36 cancers in 185 countries. CA Cancer J Clin (2018) 68:394–424. 10.3322/caac.21492 - DOI - PubMed
    1. Axelrad JE, Lichtiger S, Yajnik V. Inflammatory bowel disease and cancer: The role of inflammation, immunosuppression, and cancer treatment. World J Gastroenterol (2016) 22:4794–801. 10.3748/wjg.v22.i20.4794 - DOI - PMC - PubMed
    1. Joyce JA, Pollard JW. Microenvironmental regulation of metastasis. Nat Rev Cancer (2009) 9:239–52. 10.1038/nrc2618 - DOI - PMC - PubMed
    1. Murdoch C, Muthana M, Coffelt SB, Lewis CE. The role of myeloid cells in the promotion of tumour angiogenesis. Nat Rev Cancer (2008) 8:618–31. 10.1038/nrc2444 - DOI - PubMed
    1. Mantovani A, Allavena P, Sica A, Balkwill F. Cancer-related inflammation. Nature (2008) 454:436–44. 10.1038/nature07205 - DOI - PubMed

Publication types

MeSH terms

Substances