. 2021 Mar 16;118(11):e2021963118.
doi: 10.1073/pnas.2021963118.

Super-resolution mapping of cellular double-strand break resection complexes during homologous recombination

Affiliations

Super-resolution mapping of cellular double-strand break resection complexes during homologous recombination

Donna R Whelan et al. Proc Natl Acad Sci U S A. .

Abstract

Homologous recombination (HR) is a major pathway for repair of DNA double-strand breaks (DSBs). The initial step that drives the HR process is resection of DNA at the DSB, during which a multitude of nucleases, mediators, and signaling proteins accumulates at the damage foci in a manner that remains elusive. Using single-molecule localization super-resolution (SR) imaging assays, we specifically visualize the spatiotemporal behavior of key mediator and nuclease proteins as they resect DNA at single-ended double-strand breaks (seDSBs) formed at collapsed replication forks. By characterizing these associations, we reveal the in vivo dynamics of resection complexes involved in generating the long single-stranded DNA (ssDNA) overhang prior to homology search. We show that 53BP1, a protein known to antagonize HR, is recruited to seDSB foci during early resection but is spatially separated from repair activities. Contemporaneously, CtBP-interacting protein (CtIP) and MRN (MRE11-RAD51-NBS1) associate with seDSBs, interacting with each other and BRCA1. The HR nucleases EXO1 and DNA2 are also recruited and colocalize with each other and with the repair helicase Bloom syndrome protein (BLM), demonstrating multiple simultaneous resection events. Quantification of replication protein A (RPA) accumulation and ssDNA generation shows that resection is completed 2 to 4 h after break induction. However, both BRCA1 and BLM persist later into HR, demonstrating potential roles in homology search and repair resolution. Furthermore, we show that initial recruitment of BRCA1 and removal of Ku are largely independent of MRE11 exonuclease activity but dependent on MRE11 endonuclease activity. Combined, our observations provide a detailed description of resection during HR repair.

Keywords: BRCA1; DNA damage; DNA repair; homologous recombination; resection.


Conflict of interest statement

The authors declare no competing interest.

Figures

Fig. 1.
Fig. 1.
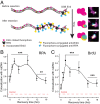
SR imaging of repair proteins recruited to individual seDSBs in human cells. (A) The experimental protocol used to label and break RFs into seDSBs in order to capture snapshots of the arrivals, accumulations, and departures of repair proteins. TopI, Topoisomerase I; DDR, DNA damage response. (B) Representative epifluorescence (upper left) and SR (lower right) images of a single nucleus damaged and labeled for naDNA (using EdU; magenta), MRE11 (cyan), and CtIP (yellow). (B, i and ii) Representative zoomed-in epifluorescence and (B, iii and iv) SR foci are shown. (Scale bars: i and ii, 500 nm; iii and iv, 250 nm.) (C) Schematic showing the analytical process for quantifying protein colocalization with repair foci by generating Monte Carlo randomized simulation images for each SR nucleus image and then using the number of overlaps in the random simulations to normalize the real data. For each cell, this normalized “colocalization ratio” can be plotted (e.g., one normalized cell value is circled in red) and compared with truly random levels (=1) and with control levels in untreated control cells. (D) The interrelationships between proteins localized to repair foci were further quantified by calculating the percentage of naDNA foci positive for one or both stained proteins. This determined the degree of colocalization between proteins at repair sites, as well as exclusion and dependence relationships. (E) The spatial relationship of pairs of proteins colocalized at repair foci could be determined by measuring the distance between the protein foci centers of mass and generating a histogram. This was then extrapolated to generate a protein–protein association distribution two-dimensional heat map. By staining RAD51 with two different fluorophores, we could model the expected association distribution for proximally associated proteins for comparison with proteins that are distally associated at repair foci. Representative foci show proximal and distal overlaps as observed in dual-stained RAD51 (proximal; magenta: naDNA, cyan/yellow: RAD51) and in MRE11 (cyan) and CtIP (yellow; distal; magenta: naDNA). (FH) Scatterplots showing quantification of colocalization between (F) MRE11, (G) CtIP, (H) BRCA1, and (I) 53BP1 with naDNA in untreated control cells and cells treated with 100 nM CPT for 1 h. Black bars depict medians, and diamonds show the means. ***P < 0.001 in a two-sample Student’s t test; ****P < 0.0001 in a two-sample Student’s t test.
Fig. 2.
Fig. 2.
Quantification of RPA and BrdU overlap signals with naDNA shows resection progression. (A) A schematic model showing labeling for RPA and ssDNA as resection progresses. (B) Kinetic trace of RPA colocalization with naDNA 0 to 16 h after 1 h of 100 nM CPT treatment. (C) Kinetic trace of ssDNA (detected as undenatured BrdU) colocalization with naDNA 0 to 16 h after 1 h of 100 nM CPT treatment. SEs are shown. *P < 0.05 based on two-sample Student’s t test comparing damaged time point data with control undamaged cell colocalization levels; **P < 0.01 based on two-sample Student’s t test comparing damaged time point data with control undamaged cell colocalization levels; ***P < 0.001 based on two-sample Student’s t test comparing damaged time point data with control undamaged cell colocalization levels.
Fig. 3.
Fig. 3.
MRN, BRCA1, and CtIP associate with DSBs to orchestrate resection during the first 2 h of repair. (A) Kinetic trace of MRE11 colocalization with naDNA 0 to 16 h after 1 h of 100 nM CPT treatment. (B) Kinetic trace of BRCA1 colocalization with naDNA 0 to 16 h after 1 h of 100 nM CPT treatment. (C) Kinetic trace of CtIP colocalization with naDNA 0 to 16 h after 1 h of 100 nM CPT treatment. (D) Kinetic trace of 53BP1 colocalization with naDNA 0 to 16 h after 1 h of 100 nM CPT treatment. (E) Kinetic trace of EXO1 colocalization with naDNA 0 to 16 h after 1 h of 100 nM CPT treatment. (F) Kinetic trace of DNA2 colocalization with naDNA 0 to 16 h after 1 h of 100 nM CPT treatment. SEs are shown. ns shows P > 0.05 based on two-sample Student’s t test against undamaged cell colocalization levels. *P < 0.05 based on two-sample Student’s t test against undamaged cell colocalization levels; **P < 0.01 based on two-sample Student’s t test against undamaged cell colocalization levels; ***P < 0.001 based on two-sample Student’s t test against undamaged cell colocalization levels; ****P < 0.0001 based on two-sample Student’s t test against undamaged cell colocalization levels.
Fig. 4.
Fig. 4.
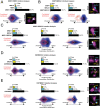
The spatial organization of NBS1, 53BP1, MRE11, BRCA1, and CtIP demonstrates high levels of colocalization at the same repair foci with dynamic spatially proximal and distal arrangements. (A) Analysis of the internal organization of MRE11 and NBS1 costained and colocalized with naDNA after 1 h of 100 nM CPT treatment. MRE11/NBS1 shows a high level of colocalization at repair foci with a minor fraction (12.0%) MRE11 only (cumulative bar graph). Colocalized MRE11 and NBS1 have a strongly proximal association distribution at 0 h, indicative of closely associated proteins. (B) Analysis of the internal organization of 53BP1 and BRCA1 costained and colocalized with naDNA at 0 and 1 h after 1 h of 100 nM CPT treatment; 53BP1/BRCA1 shows a high level of colocalization at repair foci with minor fractions (5 to 25%) demonstrably MRE11-only or 53BP1-only foci (cumulative bar graph). Colocalized 53BP1 and BRCA1 have a moderately distal association distribution at 0 h that increases in separation at 1 h. (C) Analysis of the internal organization of MRE11 and BRCA1 costained and colocalized with naDNA at 0, 1, and 2 h after 1 h of 100 nM CPT treatment. MRE11/BRCA1 shows a high level of colocalization at repair foci with minor fractions (9 to 24%) demonstrably MRE11-only or BRCA1-only foci (cumulative bar graph). Colocalized MRE11 and BRCA1 have a predominantly proximal association distribution at 0 h, both proximal and distal subpopulations at 1 h, and a predominantly distal distribution by 2 h. (D) Analysis of the internal organization of CtIP and BRCA1 costained and colocalized with naDNA at 0, 1, and 2 h after 1 h of 100 nM CPT treatment. BRCA1/CtIP shows a similarly high degree of colocalization across time points and even smaller fractions (<8 to 16%) as CtIP-only and BRCA1-only foci. Colocalized CtIP and BRCA1 are predominantly proximal in their association distribution across all times with a persistent population of distal, uncomplexed species. (E) Analysis of the internal organization of MRE11 and CtIP costained and colocalized with naDNA at 0, 1, and 2 h after 1 h of 100 nM CPT treatment. CtIP/MRE11 also shows a high degree of colocalization and minor fractions (8 to 26%) of CtIP-only and MRE11-only foci. Colocalized CtIP and MRE11 initially displayed almost equal fractions in distal and proximal arrangements before a shift toward a more proximal distribution at 1 h and then, toward a predominantly distal distribution at 2 h. In all images, the overlaid red contour map outline shows the modeled distribution of closely associated proteins. Representative distal and proximal foci are also shown. (Scale bars: 250 nm.)
Fig. 5.
Fig. 5.
BLM is involved dynamically with nucleases EXO1, DNA2, and MRE11 during resection. (A) Kinetic trace of BLM colocalization with naDNA 0 to 16 h after 1 h of 100 nM CPT treatment. **P < 0.01 based on two-sample Student’s t test against undamaged cell colocalization levels; ***P < 0.001 based on two-sample Student’s t test against undamaged cell colocalization levels. (B) Analysis of the internal organization of MRE11 and BLM costained and colocalized with naDNA 0, 1, and 2 h after 1 h of 100 nM CPT treatment. MRE11/BLM shows a moderate, increasing to high level of colocalization at repair foci, with significant MRE11 only observed at the 0-h time point. Colocalized MRE11 and BLM have a mixed proximal and distal arrangement immediately following damage, indicating both complexed and spatially separated species. At 1 and 2 h, the spatial arrangement indicates separation of MRE11 and BLM. (C) Analysis of the internal organization of EXO1 and BLM costained and colocalized with naDNA 1 h after treatment with 100 nM CPT for 1 h. Significant levels of EXO1/BLM colocalization at damage foci are detected along with EXO1 and BLM localizations independent of each other. Spatially, colocalized EXO1/BLM shows a moderately distal arrangement indicating the predominance of spatial independence. (D) Analysis of the internal organization of DNA2 and BLM costained and colocalized with naDNA 1 h after treatment with 100 nM CPT for 1 h. Significant levels of DNA2/BLM colocalization at damage foci are detected along with BLM localizations independent of DNA2 presence. Minimal DNA2 localization to damage foci is detected independent of BLM, indicating DNA2’s dependence on BLM. Spatially, colocalized DNA2/BLM shows a more proximal arrangement compared with EXO1/BLM, indicating increased interaction, although still with some proteins spatially separated within the foci. (E) Analysis of the internal organization of EXO1 and DNA2 costained and colocalized with naDNA 1 h after treatment with 100 nM CPT for 1 h. Significant levels of EXO1/DNA2 colocalization at damage foci are detected along with EXO1 and DNA2 localizations independent of each other. Spatially, colocalized EXO1/DNA2 shows a moderately proximal arrangement similar to DNA2/BLM, indicating some instances of both interaction and spatial separation. SEs are shown.
Fig. 6.
Fig. 6.
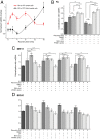
MRE11 nuclease inhibition using Mirin and PFM01 completely abrogates resection at DSBs, causing delayed repair and apoptosis even after removal of Mirin. (A) Kinetic trace of RPA colocalization with naDNA 0 to 16 h after 1 h of CPT treatment in combination with Mirin (black trace) or with a DMSO control (red). Adapted with permission from ref. , which is licensed under CC BY 4.0. (B) Quantification of Ku association with repair foci in control cells, cells treated with CPT, both CPT + Mirin, both CPT + PFM01, and with CPT + Mirin + PFM01. (C) Quantification of MRE11 association with repair foci in control cells, cells treated with CPT, both CPT + Mirin, both CPT + PFM01, and with CPT + Mirin + PFM01. (D) Quantification of BRCA1 association with repair foci in control cells, cells treated with CPT, both CPT + Mirin, both CPT + PFM01, and with CPT + Mirin + PFM01. Controls are shown for comparison. DMSO signifies dimethyl sulfoxide controls. Student’s t test results show significance of difference between CPT-only and CPT + Mirin treatments at indicated times post-CPT. SEs are shown. ns shows P > 0.05. *P < 0.05; **P < 0.01; ***P < 0.001; ****P < 0.0001.

Similar articles

Cited by

References

    1. Brambati A., Colosio A., Zardoni L., Galanti L., Liberi G., Replication and transcription on a collision course: Eukaryotic regulation mechanisms and implications for DNA stability. Front. Genet. 6, 166 (2015). - PMC - PubMed
    1. Mehta A., Haber J. E., Sources of DNA double-strand breaks and models of recombinational DNA repair. Cold Spring Harb. Perspect. Biol. 6, a016428 (2014). - PMC - PubMed
    1. Vilenchik M. M., Knudson A. G., Endogenous DNA double-strand breaks: Production, fidelity of repair, and induction of cancer. Proc. Natl. Acad. Sci. U.S.A. 100, 12871–12876 (2003). - PMC - PubMed
    1. Sonoda E., Morrison C., Yamashita Y. M., Takata M., Takeda S., Reverse genetic studies of homologous DNA recombination using the chicken B-lymphocyte line, DT40. Philos. Trans. R. Soc. Lond. B Biol. Sci. 356, 111–117 (2001). - PMC - PubMed
    1. Aparicio T., Baer R., Gautier J., DNA double-strand break repair pathway choice and cancer. DNA Repair (Amst.) 19, 169–175 (2014). - PMC - PubMed

Publication types

MeSH terms

LinkOut - more resources