

Endometrium On-a-Chip Reveals Insulin- and Glucose-induced Alterations in the Transcriptome and Proteomic Secretome
- PMID: 33693651
- PMCID: PMC8143652
- DOI: 10.1210/endocr/bqab054
Endometrium On-a-Chip Reveals Insulin- and Glucose-induced Alterations in the Transcriptome and Proteomic Secretome
Abstract
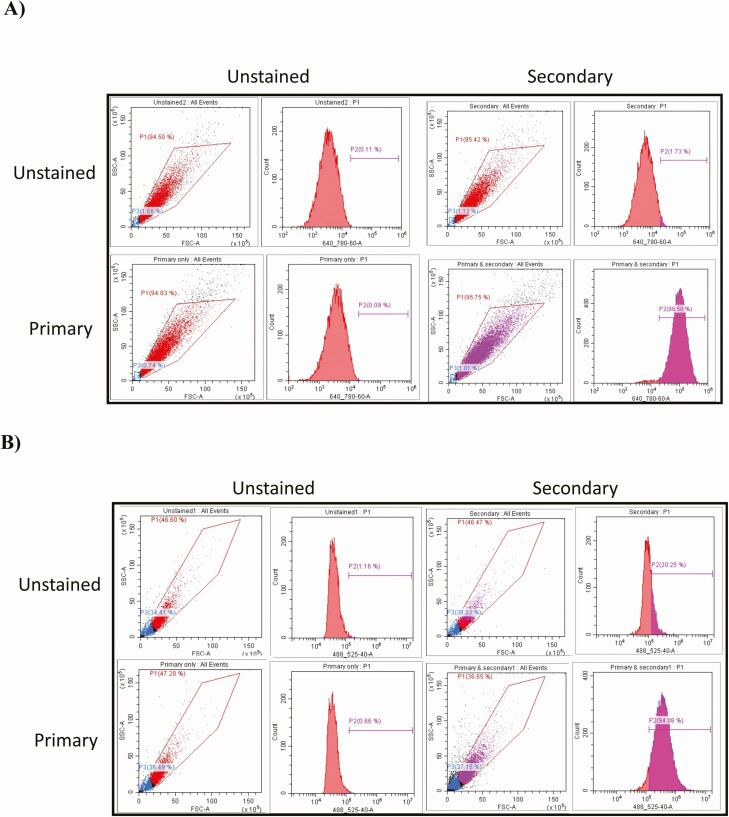
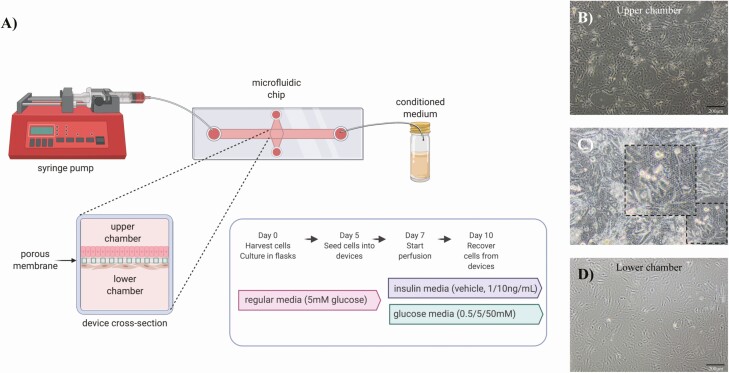
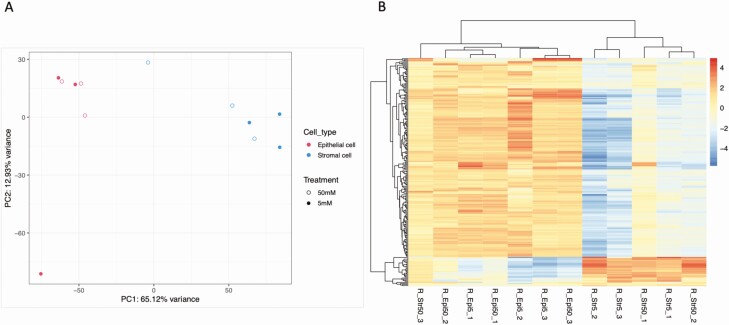
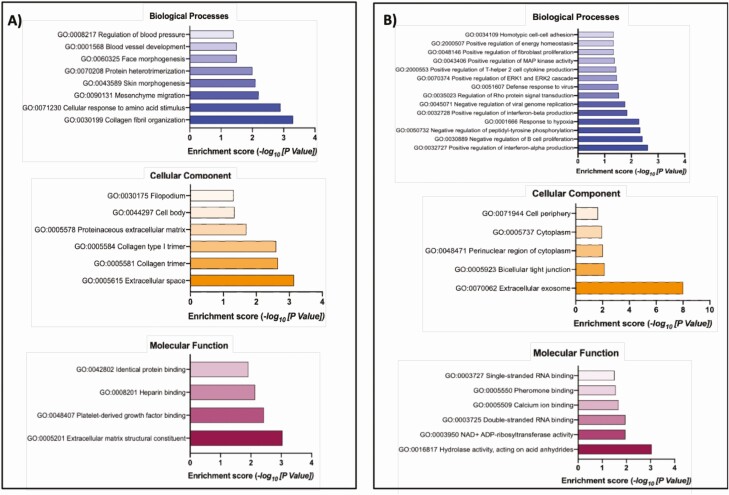
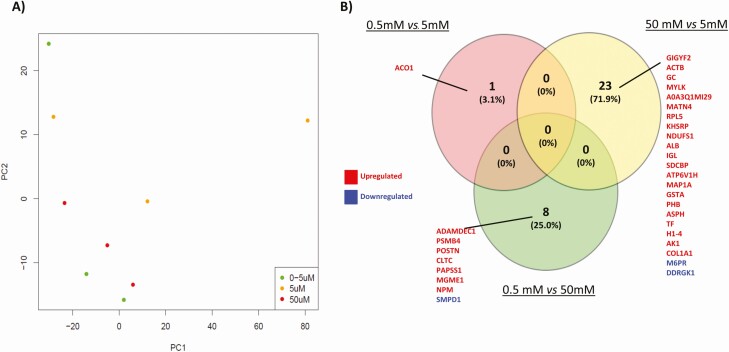
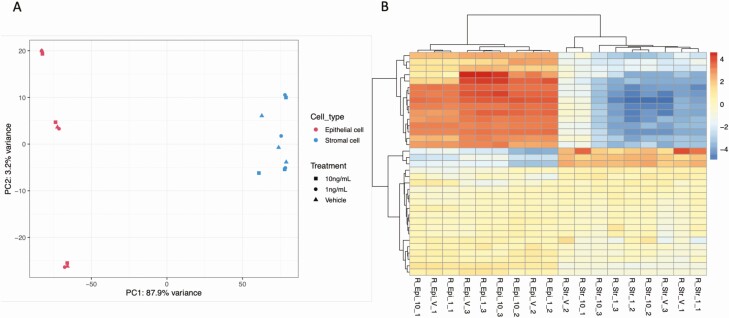
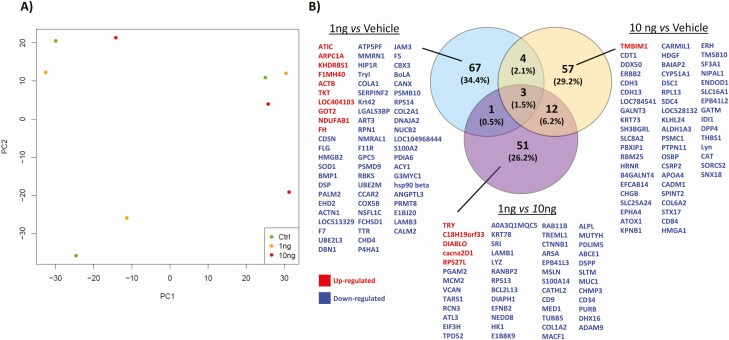
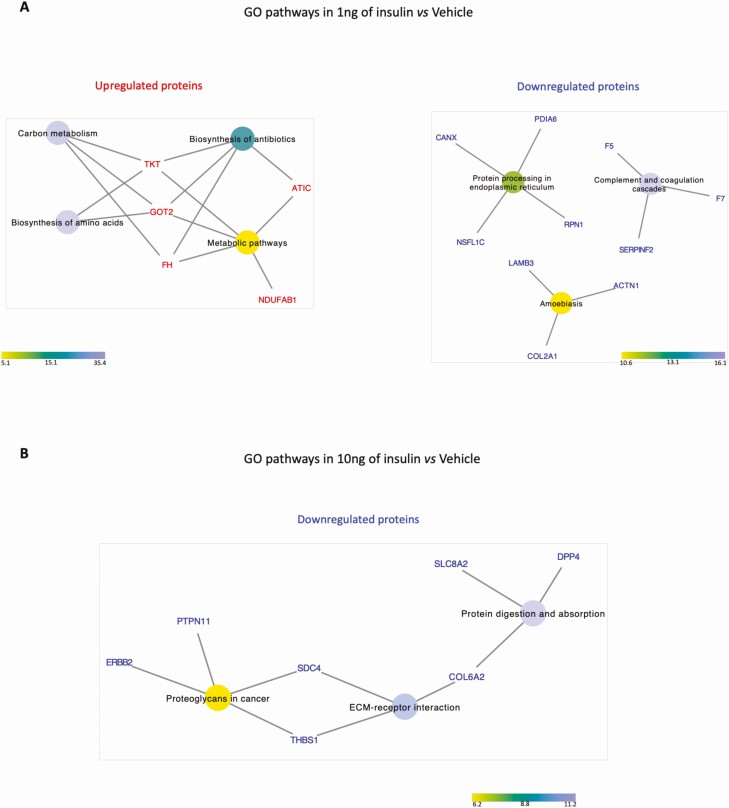
The molecular interactions between the maternal environment and the developing embryo are key for early pregnancy success and are influenced by factors such as maternal metabolic status. Our understanding of the mechanism(s) through which these individual nutritional stressors alter endometrial function and the in utero environment for early pregnancy success is, however, limited. Here we report, for the first time, the use of an endometrium-on-a-chip microfluidics approach to produce a multicellular endometrium in vitro. Isolated endometrial cells (epithelial and stromal) from the uteri of nonpregnant cows in the early luteal phase (Days 4-7) were seeded in the upper chamber of the device (epithelial cells; 4-6 × 10⁴ cells/mL) and stromal cells seeded in the lower chamber (1.5-2 × 10⁴ cells/mL). Exposure of cells to different concentrations of glucose (0.5, 5.0, or 50 mM) or insulin (Vehicle, 1 or 10 ng/mL) was performed at a flow rate of 1 µL/minute for 72 hours. Quantitative differences in the cellular transcriptome and the secreted proteome of in vitro-derived uterine luminal fluid were determined by RNA-sequencing and tandem mass tagging mass spectrometry, respectively. High glucose concentrations altered 21 and 191 protein-coding genes in epithelial and stromal cells, respectively (P < .05), with a dose-dependent quantitative change in the protein secretome (1 and 23 proteins). Altering insulin concentrations resulted in limited transcriptional changes including transcripts for insulin-like binding proteins that were cell specific but altered the quantitative secretion of 196 proteins. These findings highlight 1 potential mechanism by which changes to maternal glucose and insulin alter uterine function.
Keywords: Endometrium on-a-chip; bovine; cattle; microfluidics; uterine luminal fluid; uterus.
© The Author(s) 2021. Published by Oxford University Press on behalf of the Endocrine Society.
Figures
Similar articles
-
Modulating the endometrial epithelial proteome and secretome in preparation for pregnancy: The role of ovarian steroid and pregnancy hormones.J Proteomics. 2016 Jul 20;144:99-112. doi: 10.1016/j.jprot.2016.05.026. Epub 2016 Jun 2. J Proteomics. 2016. PMID: 27262222
-
The role of CAPG in molecular communication between the embryo and the uterine endometrium: Is its function conserved in species with different implantation strategies?FASEB J. 2020 Aug;34(8):11015-11029. doi: 10.1096/fj.202000882RR. Epub 2020 Jul 3. FASEB J. 2020. PMID: 32619075
-
Progesterone-dependent and progesterone-independent modulation of luminal epithelial transcription to support pregnancy in cattle.Physiol Genomics. 2022 Feb 1;54(2):71-85. doi: 10.1152/physiolgenomics.00108.2021. Epub 2021 Dec 10. Physiol Genomics. 2022. PMID: 34890509 Free PMC article.
-
Transcriptomic analysis of the bovine endometrium: What is required to establish uterine receptivity to implantation in cattle?J Reprod Dev. 2012;58(2):189-95. doi: 10.1262/jrd.2011-021. J Reprod Dev. 2012. PMID: 22738902 Review.
-
Transcriptome studies of bovine endometrium reveal molecular profiles characteristic for specific stages of estrous cycle and early pregnancy.Exp Clin Endocrinol Diabetes. 2008 Jul;116(7):371-84. doi: 10.1055/s-2008-1076714. Epub 2008 Jun 17. Exp Clin Endocrinol Diabetes. 2008. PMID: 18561091 Review.
Cited by
-
The Roles of Extracellular Vesicles and Organoid Models in Female Reproductive Physiology.Int J Mol Sci. 2022 Mar 16;23(6):3186. doi: 10.3390/ijms23063186. Int J Mol Sci. 2022. PMID: 35328607 Free PMC article. Review.
-
Bioengineering trends in female reproduction: a systematic review.Hum Reprod Update. 2022 Nov 2;28(6):798-837. doi: 10.1093/humupd/dmac025. Hum Reprod Update. 2022. PMID: 35652272 Free PMC article.
-
Homeostatic Model Assessment for Insulin Resistance Is Associated With Late Miscarriage in Non-Dyslipidemic Women Undergoing Fresh IVF/ICSI Embryo Transfer.Front Endocrinol (Lausanne). 2022 Jun 17;13:880518. doi: 10.3389/fendo.2022.880518. eCollection 2022. Front Endocrinol (Lausanne). 2022. PMID: 35784578 Free PMC article.
-
Shifting early embryology paradigms: Applications of stem cell-based embryo models in bioengineering.Curr Opin Genet Dev. 2023 Aug;81:102069. doi: 10.1016/j.gde.2023.102069. Epub 2023 Jun 29. Curr Opin Genet Dev. 2023. PMID: 37392541 Free PMC article. Review.
-
Effects of high-normal fasting blood glucose on ART outcomes of frozen-thawed single blastocyst transfer in women with normal BMI.J Assist Reprod Genet. 2024 Oct;41(10):2615-2623. doi: 10.1007/s10815-024-03191-w. Epub 2024 Jul 6. J Assist Reprod Genet. 2024. PMID: 38970737
References
-
- Rizos D, Clemente M, Bermejo-Alvarez P, de La Fuente J, Lonergan P, Gutiérrez-Adán A. Consequences of in vitro culture conditions on embryo development and quality. Reprod Domest Anim. 2008;43(Suppl 4):44-50. - PubMed
-
- Rizos D, Ward F, Duffy P, Boland MP, Lonergan P. Consequences of bovine oocyte maturation, fertilization or early embryo development in vitro versus in vivo: implications for blastocyst yield and blastocyst quality. Mol Reprod Dev. 2002;61(2):234-248. - PubMed
-
- Maillo V, Lopera-Vasquez R, Hamdi M, Gutierrez-Adan A, Lonergan P, Rizos D. Maternal-embryo interaction in the bovine oviduct: Evidence from in vivo and in vitro studies. Theriogenology. 2016;86(1):443-450. - PubMed
-
- de Ávila ACFCM, da Silveira JC. Role of extracellular vesicles during oocyte maturation and early embryo development. Reprod Fertil Dev. 2019;32(2):56-64. - PubMed
Publication types
MeSH terms
Substances
Grants and funding
LinkOut - more resources
Full Text Sources
Other Literature Sources
Medical
Molecular Biology Databases
