. 2021 Mar 25;125(11):2886-2897.
doi: 10.1021/acs.jpcb.0c11460. Epub 2021 Mar 8.

Structural Arrangement within a Peptide Fibril Derived from the Glaucoma-Associated Myocilin Olfactomedin Domain

Structural Arrangement within a Peptide Fibril Derived from the Glaucoma-Associated Myocilin Olfactomedin Domain

Yuan Gao et al. J Phys Chem B. .

Abstract

Myocilin-associated glaucoma is a new addition to the list of diseases linked to protein misfolding and amyloid formation. Single point variants of the ∼257-residue myocilin olfactomedin domain (mOLF) lead to mutant myocilin aggregation. Here, we analyze the 12-residue peptide P1 (GAVVYSGSLYFQ), corresponding to residues 326-337 of mOLF, previously shown to form amyloid fibrils in vitro and in silico. We applied solid-state NMR structural measurements to test the hypothesis that P1 fibrils adopt one of three predicted structures. Our data are consistent with a U-shaped fibril arrangement for P1, one that is related to the U-shape predicted previously in silico. Our data are also consistent with an antiparallel fibril arrangement, likely driven by terminal electrostatics. Our proposed structural model is reminiscent of fibrils formed by the Aβ(1-40) Iowa mutant peptide, but with a different arrangement of molecular turn regions. Taken together, our results strengthen the connection between mOLF fibrils and the broader amylome and contribute to our understanding of the fundamental molecular interactions governing fibril architecture and stability.


Figures

Figure 1:
Figure 1:. The crystal structure of mOLF and fibrils formed by P1 peptide.
A) The β-hairpin formed by residues in the P1 peptide are highlighted in teal within the context of the mOLF propeller fold. The green and purple spheres are calcium and sodium ions, respectively. B) AFM image of P1 fibrils prepared under conditions as those for the NMR experiments presented in this manuscript. Reproduced with permission.
Figure 2.
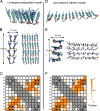
Figure 2.. Hypothesized structures for P1 peptide amyloids.
A) The native β-hairpin conformation adopted by the P1 residues within the mOLF folded protein (see also Figure 1). B and C) U-shaped and S-shaped parallel β-sheet models predicted by cgMD simulations of Wang et. al. Each model is represented with ribbons rendered from all-atom (Panel A) or course-grained (Panels B and C) models (left side of each panel) and a schematic (right of each panel). The ovals in the schematics represent sidechains of indicated amino acids. Black ovals with white letters correspond to residues that were isotopically labeled in 2D NMR experiments.
Figure 3:
Figure 3:. Predicted patterns of inter-residue proximity, which would be detectable by 2D solid-state NMR measurements.
Panels 3A, 3B, and 3C correspond to the models in Figure 2A, 2B, and 2C, respectively. Each square in the chart corresponds to a pair of residues. Orange color indicates that the structural model predicts 2D NMR crosspeaks (defined in the text) between the corresponding residues, provided that both residues are isotopically labeled with 13C uniformly. For such an inter-residue contact to be predicted by a model, at least one pair of 13C atoms, one on each residue, would need to be separated by 0.6 nm or less. As indicated on the left, the color scale (white to dark orange) indicates the fraction of pairs of corresponding residues predicted to contribute to inter-residue 2D NMR crosspeak intensity; the darkest orange squares correspond to the strongest expected crosspeaks. If all molecules in a sample have the same isotopic labels, contacts between residues that are 2 units apart or less in the primary structure would not report on molecular conformation; these combinations of residues are indicated by gray squares.
Figure 4:
Figure 4:. 2D fpRFDR and 2D DARR spectra of Sample A.
A) 2D fpRFDR spectrum of amyloid fibril formed by P1 peptide uniformly labeled with 13C at A2, V3, S8, F11, and Q12. Colored lines indicate residue-level spectral assignments based on crosspeaks between directly bonded 13C atoms. B) A 2D DARR spectrum taken on the same sample with 500 ms mixing. Colored lines indicate intra-residue crosspeak patterns as in Panel A. The summary of all the inter-residue crosspeaks is in Table 3. C) A table of detected proximities between isotopically labeled residues, interpreted based on the detected crosspeak patterns detailed in Table 3.
Figure 5:
Figure 5:. PITHIRDS-CT, R2W and 2D CHHC measurements indicate antiparallel β-sheet.
A) PITHIRDS-CT measures the distance-dependent homonuclear inter-molecular dipolar couplings between equivalent 13C labeled sites through loss of NMR peak intensity as a function of dipolar recoupling time. B) R2W measures the effect of dipolar coupling between 13C-labeled A2 Cβ and F11 CO, through relative attenuation of NMR peak intensity as a function of magic angle spinning speed. The solid lines are simulated curves for different spin relations times and inter-atomic distances. C) 2D CHHC spectrum of Sample A. D) An all-atom model of an antiparallel β-sheet, showing the expected distances between the 13C-labeled sites and Hα atoms.
Figure 6:
Figure 6:. Candidate models inspired by experimental constraints and their expected patterns of 2D DARR contacts.
In the depictions of all-atom models, the backbones are drawn as ribbons and the V3 and S8 residues are shown in blue and red, respectively. In the 2D DARR contact charts, the orange and gray coloring is as defined in Figure 3, and the symbols indicate detected (stars) and undetected (circles) 2D DARR contacts between 13C-labeled residues in the 2D DARR spectrum in Figure 4B. A) U-shaped P1 peptide molecules arranged into antiparallel β-sheets. B) Stacked U-shaped antiparallel β-sheets in a P1 amyloid fibril. C) The predicted pattern of 2D DARR contacts for the U-shaped antiparallel model. D) P1 peptide molecules in the non-native β-hairpin conformation described in Figure S6 arranged into a syn β-sheet. E) A pair of the β-sheets from Panel D stacked into an amyloid fibril. F) The predicted 2D DARR contact pattern for the non-native β-hairpin model.
Figure 7:
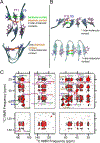
Figure 7:. Effects of isotopic dilution on the 2D DARR spectrum.
A) Two views of the U-shaped antiparallel structural model, with backbones drawn as ribbons and V3 and F11 drawn with ball-and-stick representations (blue and purple, respectively). Double-headed arrows indicate selected pairs of 13C atoms that would correspond to 2D NMR crosspeaks between V3 and F11 NMR peaks. The green arrows indicate NMR-detectable crosspeaks between V3 and F11 backbone atoms (CO, Cα) and orange arrows indicate crosspeaks between sidechain atoms. Dashing indicates that the arrowheads point to atoms on different molecules, such that the 2D NMR crosspeaks would be attenuated in the isotopically diluted sample (Sample C). B) Similar diagrams to those shown in Panel A, but for the non-native β-hairpin model. C) Overlaid 2D DARR spectra from Sample A (black contours) and C (red contours). The samples were isotopically labeled at the same residues, but Sample C was isotopically diluted by co-assembly of labeled peptide (30%) with unlabeled peptide (70%). The measured effects of isotopic dilution are tabulated in Table S1 and Table 4.
Figure 8:
Figure 8:. Comparison of measured dilution ratios with the expected values from the U-shaped antiparallel and non-native β-hairpin models.
The solid horizonal lines indicate where the models both predict the same amount of isotopic dilution. The dashed and dotted lines indicate where the models predict different degrees of isotopic dilution.
Figure 9.
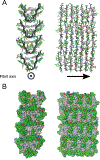
Figure 9.. The U-shaped antiparallel model of the P1 amyloid fibril, which agrees best with the data.
A) Two views of a ball-and-stick representation including all non-hydrogen atoms in the model. The backbone of each peptide is colored black. The hydrophilic sidechains are drawn in green and the hydrophobic sidechains are drawn in gray. B) The models drawn with each atom depicted as a sphere with its van der Waals radius. The hydrophobic residues are colored gray and the hydrophilic residues are drawn in green. The positively charged N-termini are drawn in blue, and the negatively charged C-termini are red.

Similar articles

Cited by

  • Myocilin misfolding and glaucoma: A 20-year update.
    Saccuzzo EG, Youngblood HA, Lieberman RL. Saccuzzo EG, et al. Prog Retin Eye Res. 2023 Jul;95:101188. doi: 10.1016/j.preteyeres.2023.101188. Epub 2023 May 20. Prog Retin Eye Res. 2023. PMID: 37217093 Free PMC article. Review.

References

    1. Chiti F; Dobson CM, Protein misfolding, functional amyloid, and human disease. Annu. Rev. Biochem 2006, 75, 333–366. - PubMed
    1. Dobson CM, The Amyloid Phenomenon and Its Links with Human Disease. Cold Spring Harb. Perspect. Biol 2017, 9 (6), a023648. - PMC - PubMed
    1. Stewart KL; Radford SE, Amyloid plaques beyond Abeta: a survey of the diverse modulators of amyloid aggregation. Biophys. Rev 2017, 9 (4), 405–419. - PMC - PubMed
    1. Iadanza MG; Jackson MP; Hewitt EW; Ranson NA; Radford SE, A new era for understanding amyloid structures and disease. Nat. Rev. Mol. Cell Biol 2018, 19 (12), 755–773. - PubMed
    1. Rambaran RN; Serpell LC, Amyloid fibrils: abnormal protein assembly. Prion 2008, 2 (3), 112–117. - PMC - PubMed

Publication types