

Global Profiling of Lysine Accessibility to Evaluate Protein Structure Changes in Alzheimer's Disease
- PMID: 33683887
- PMCID: PMC8255072
- DOI: 10.1021/jasms.0c00450
Global Profiling of Lysine Accessibility to Evaluate Protein Structure Changes in Alzheimer's Disease
Abstract
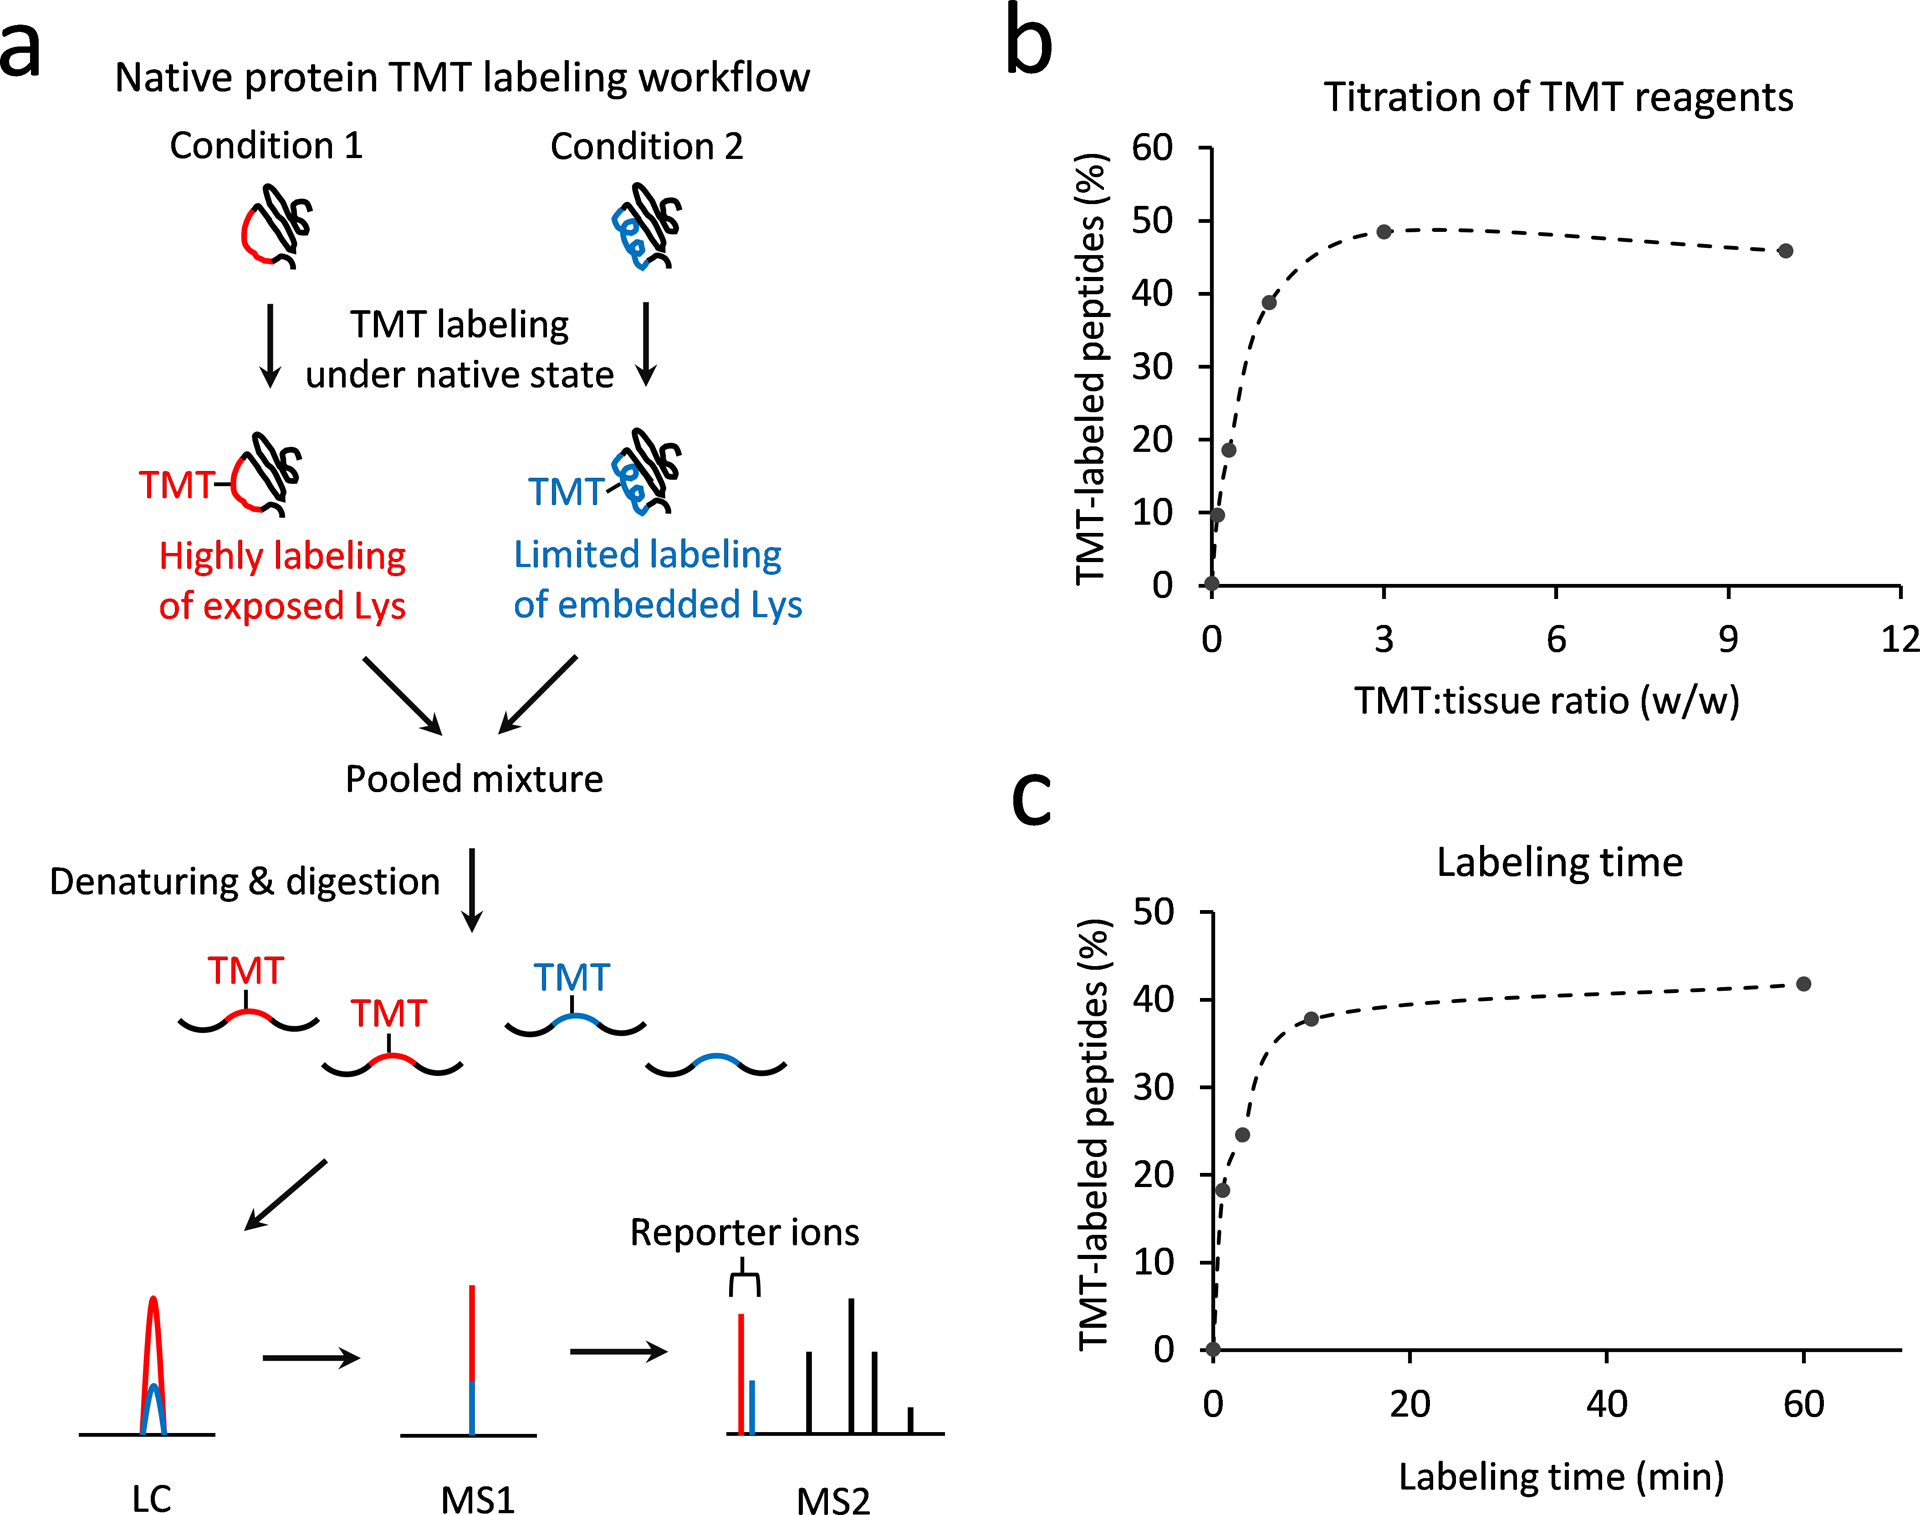
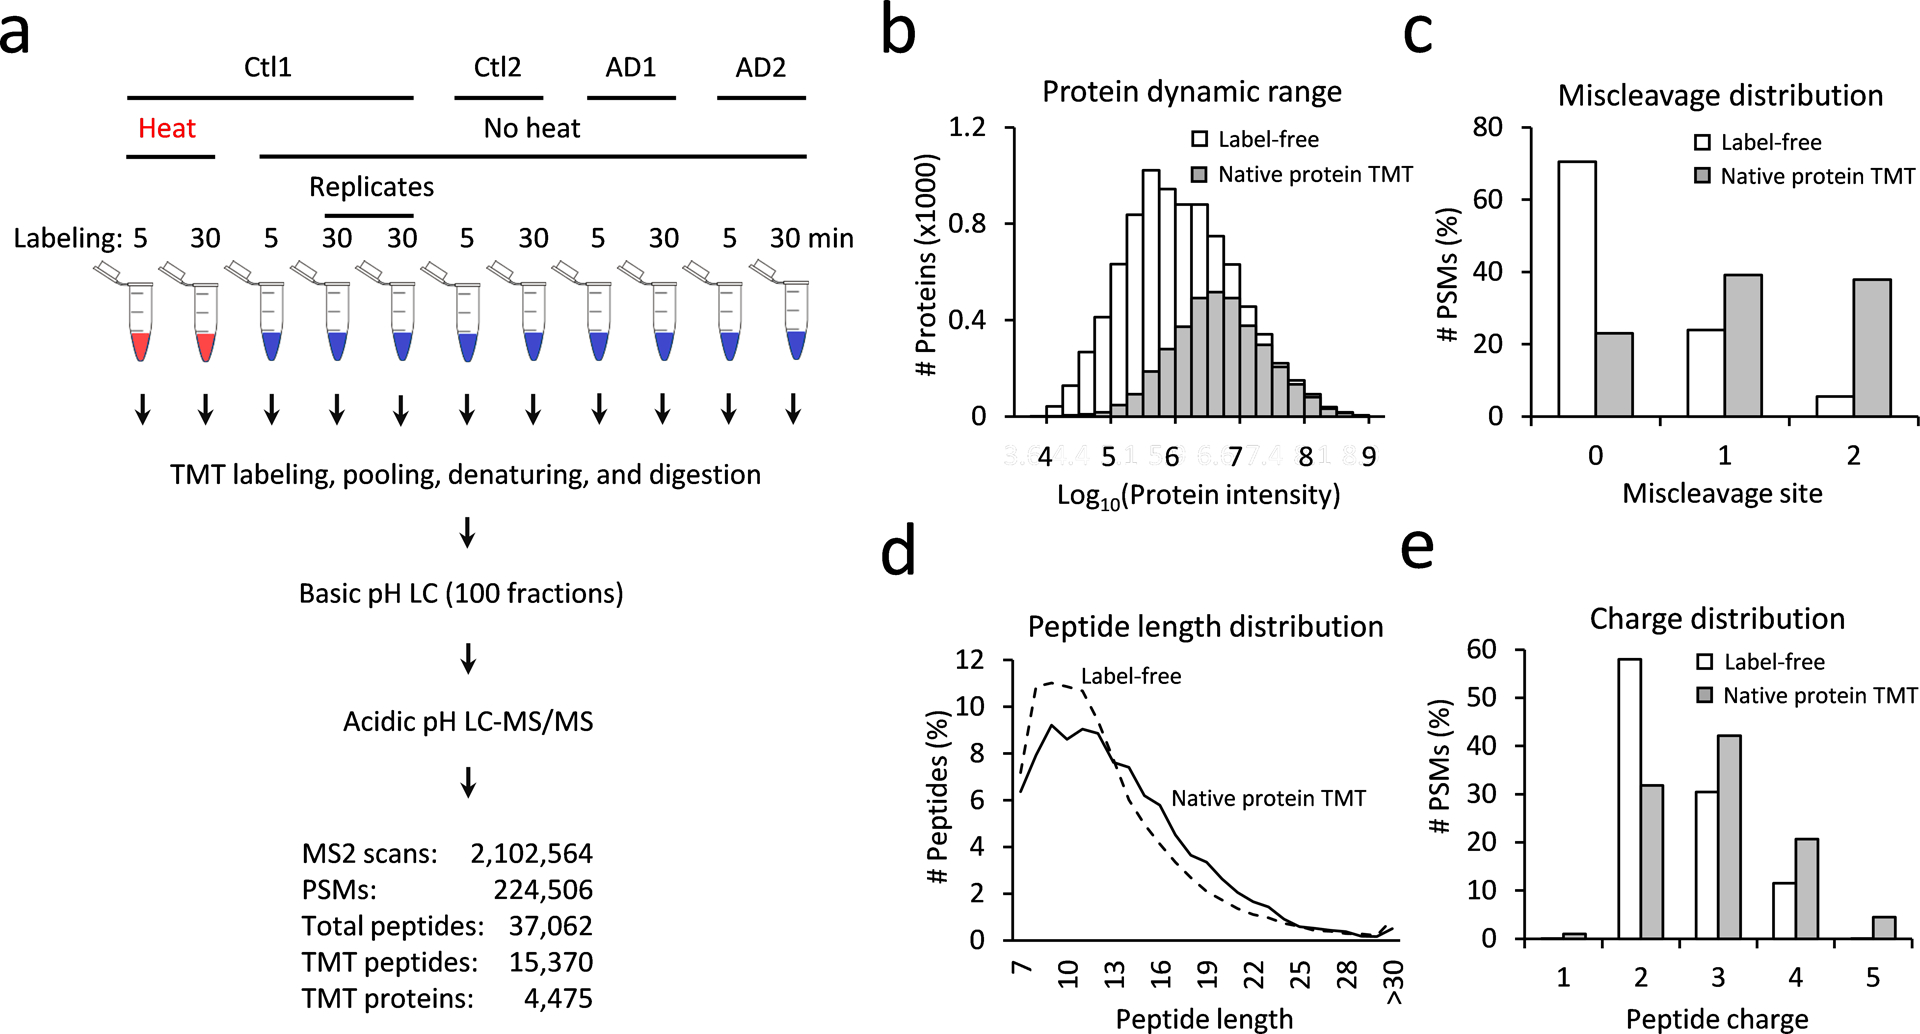
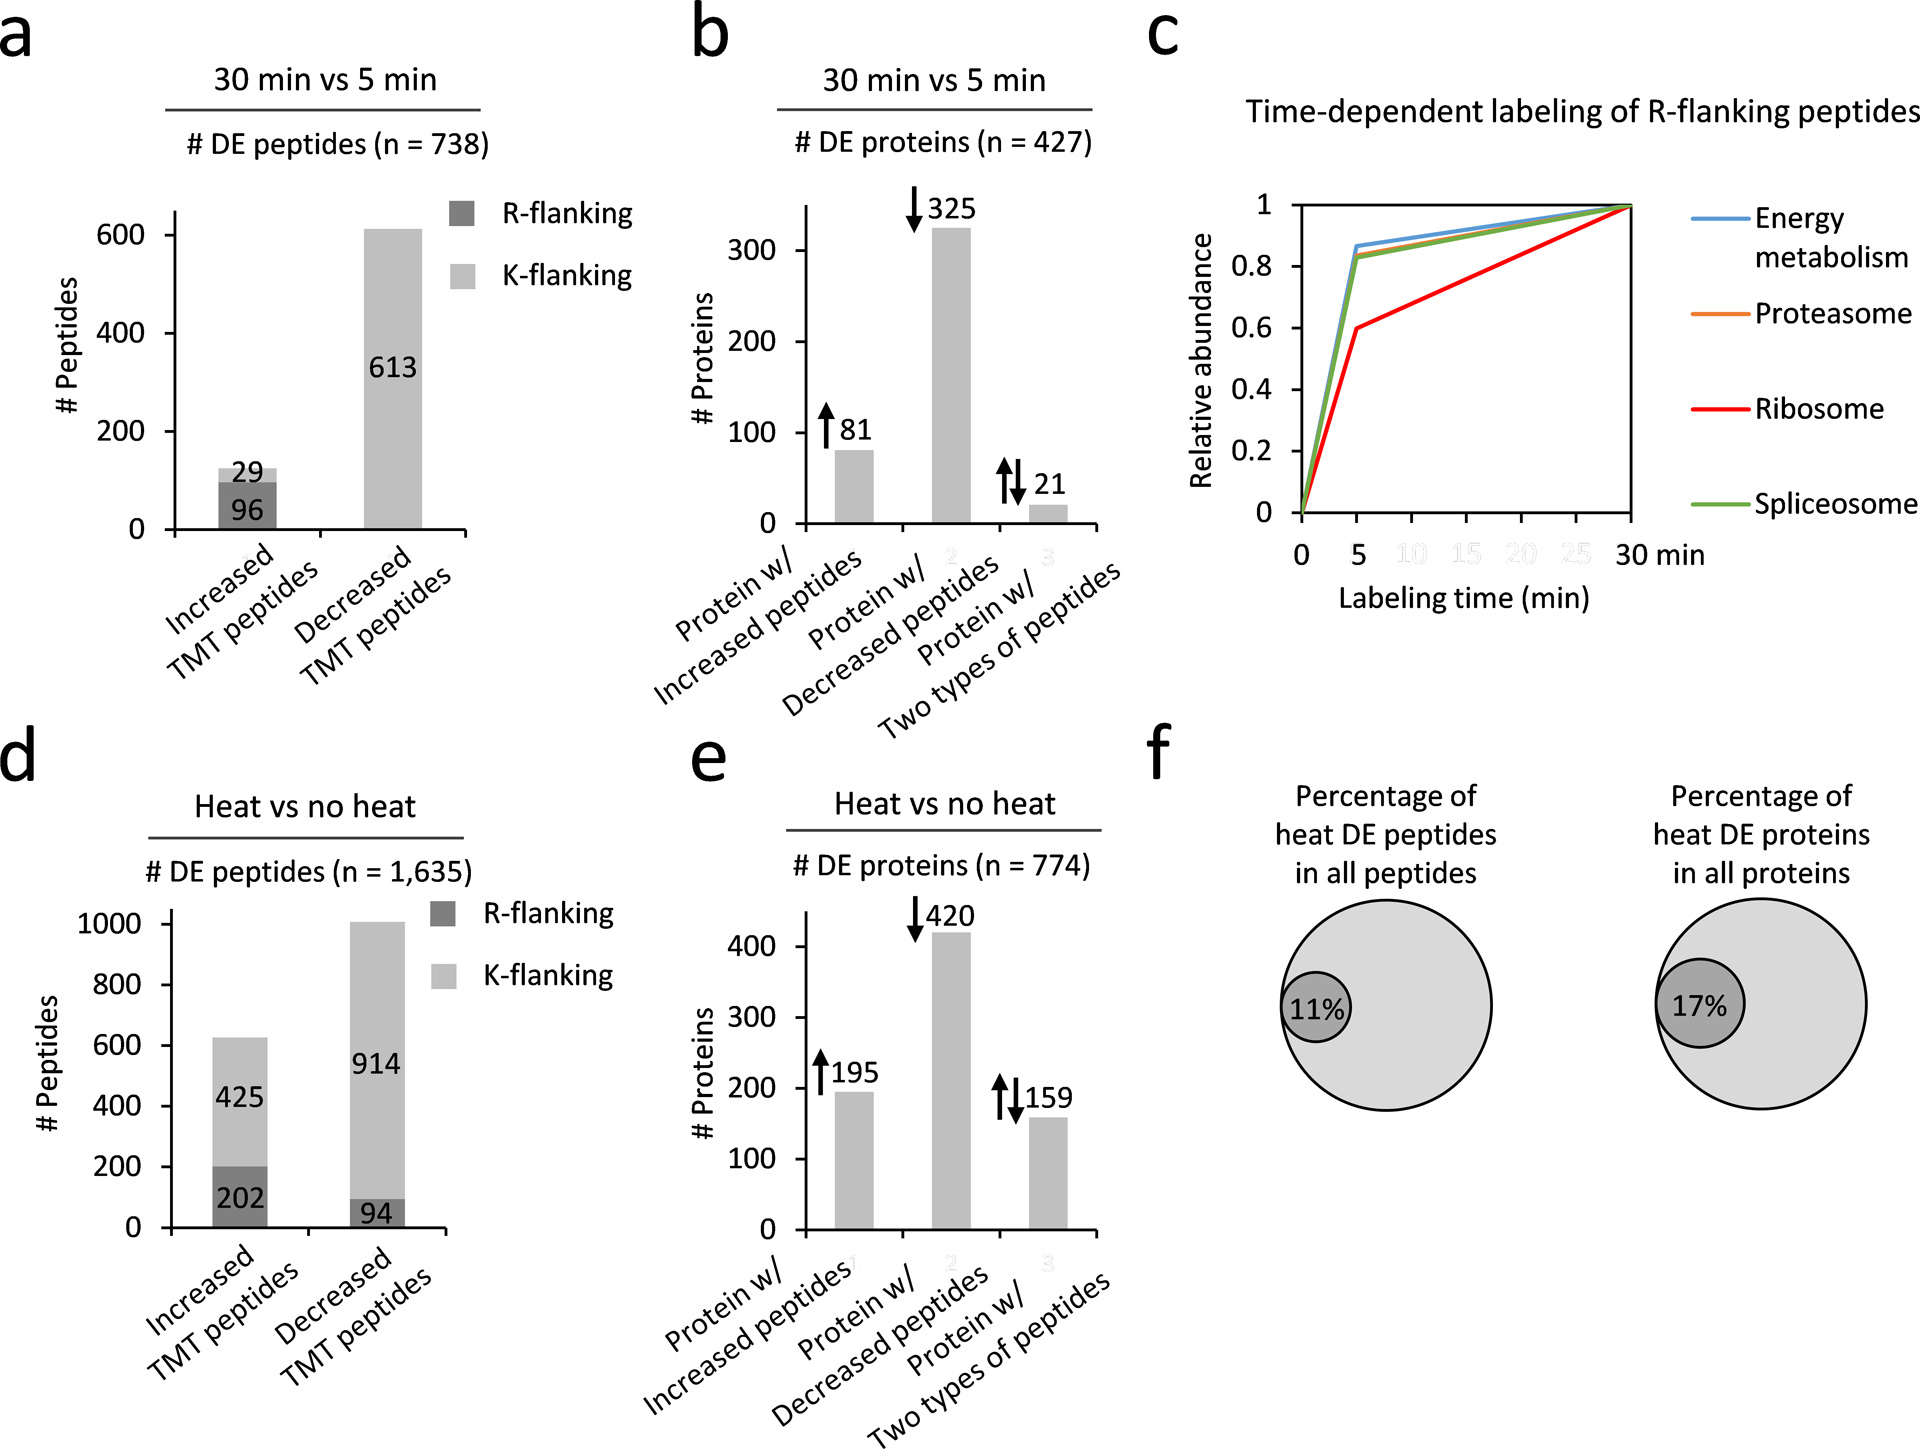
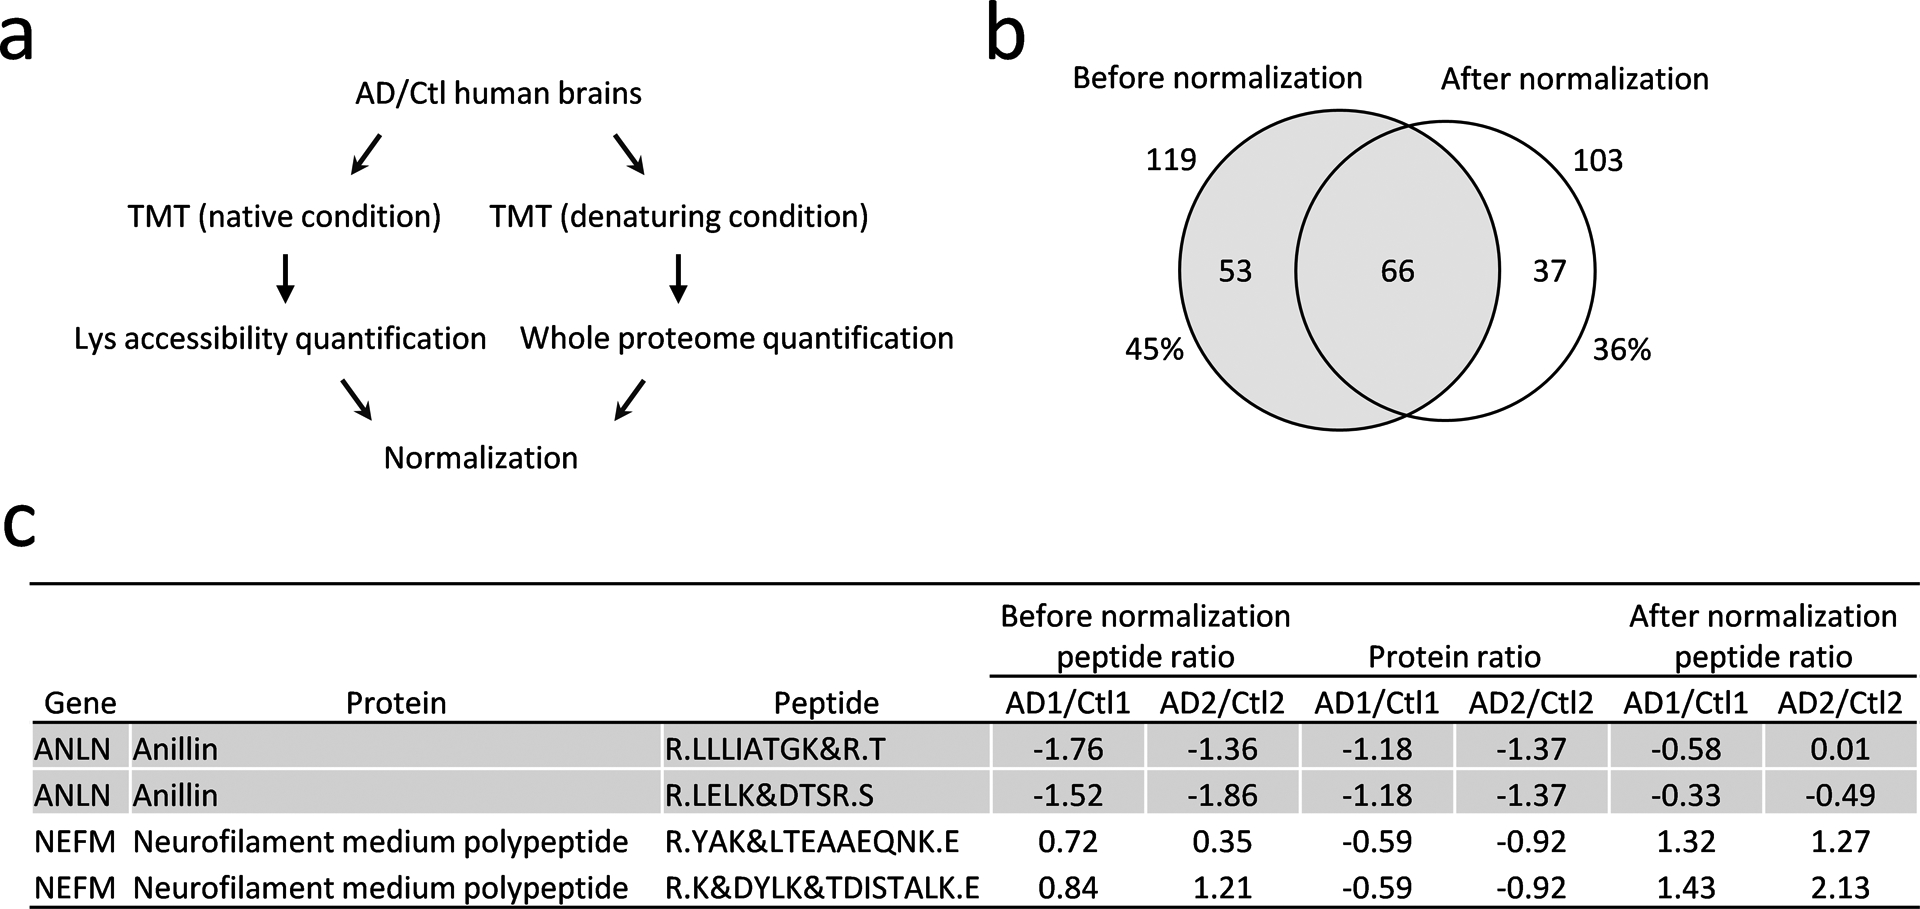
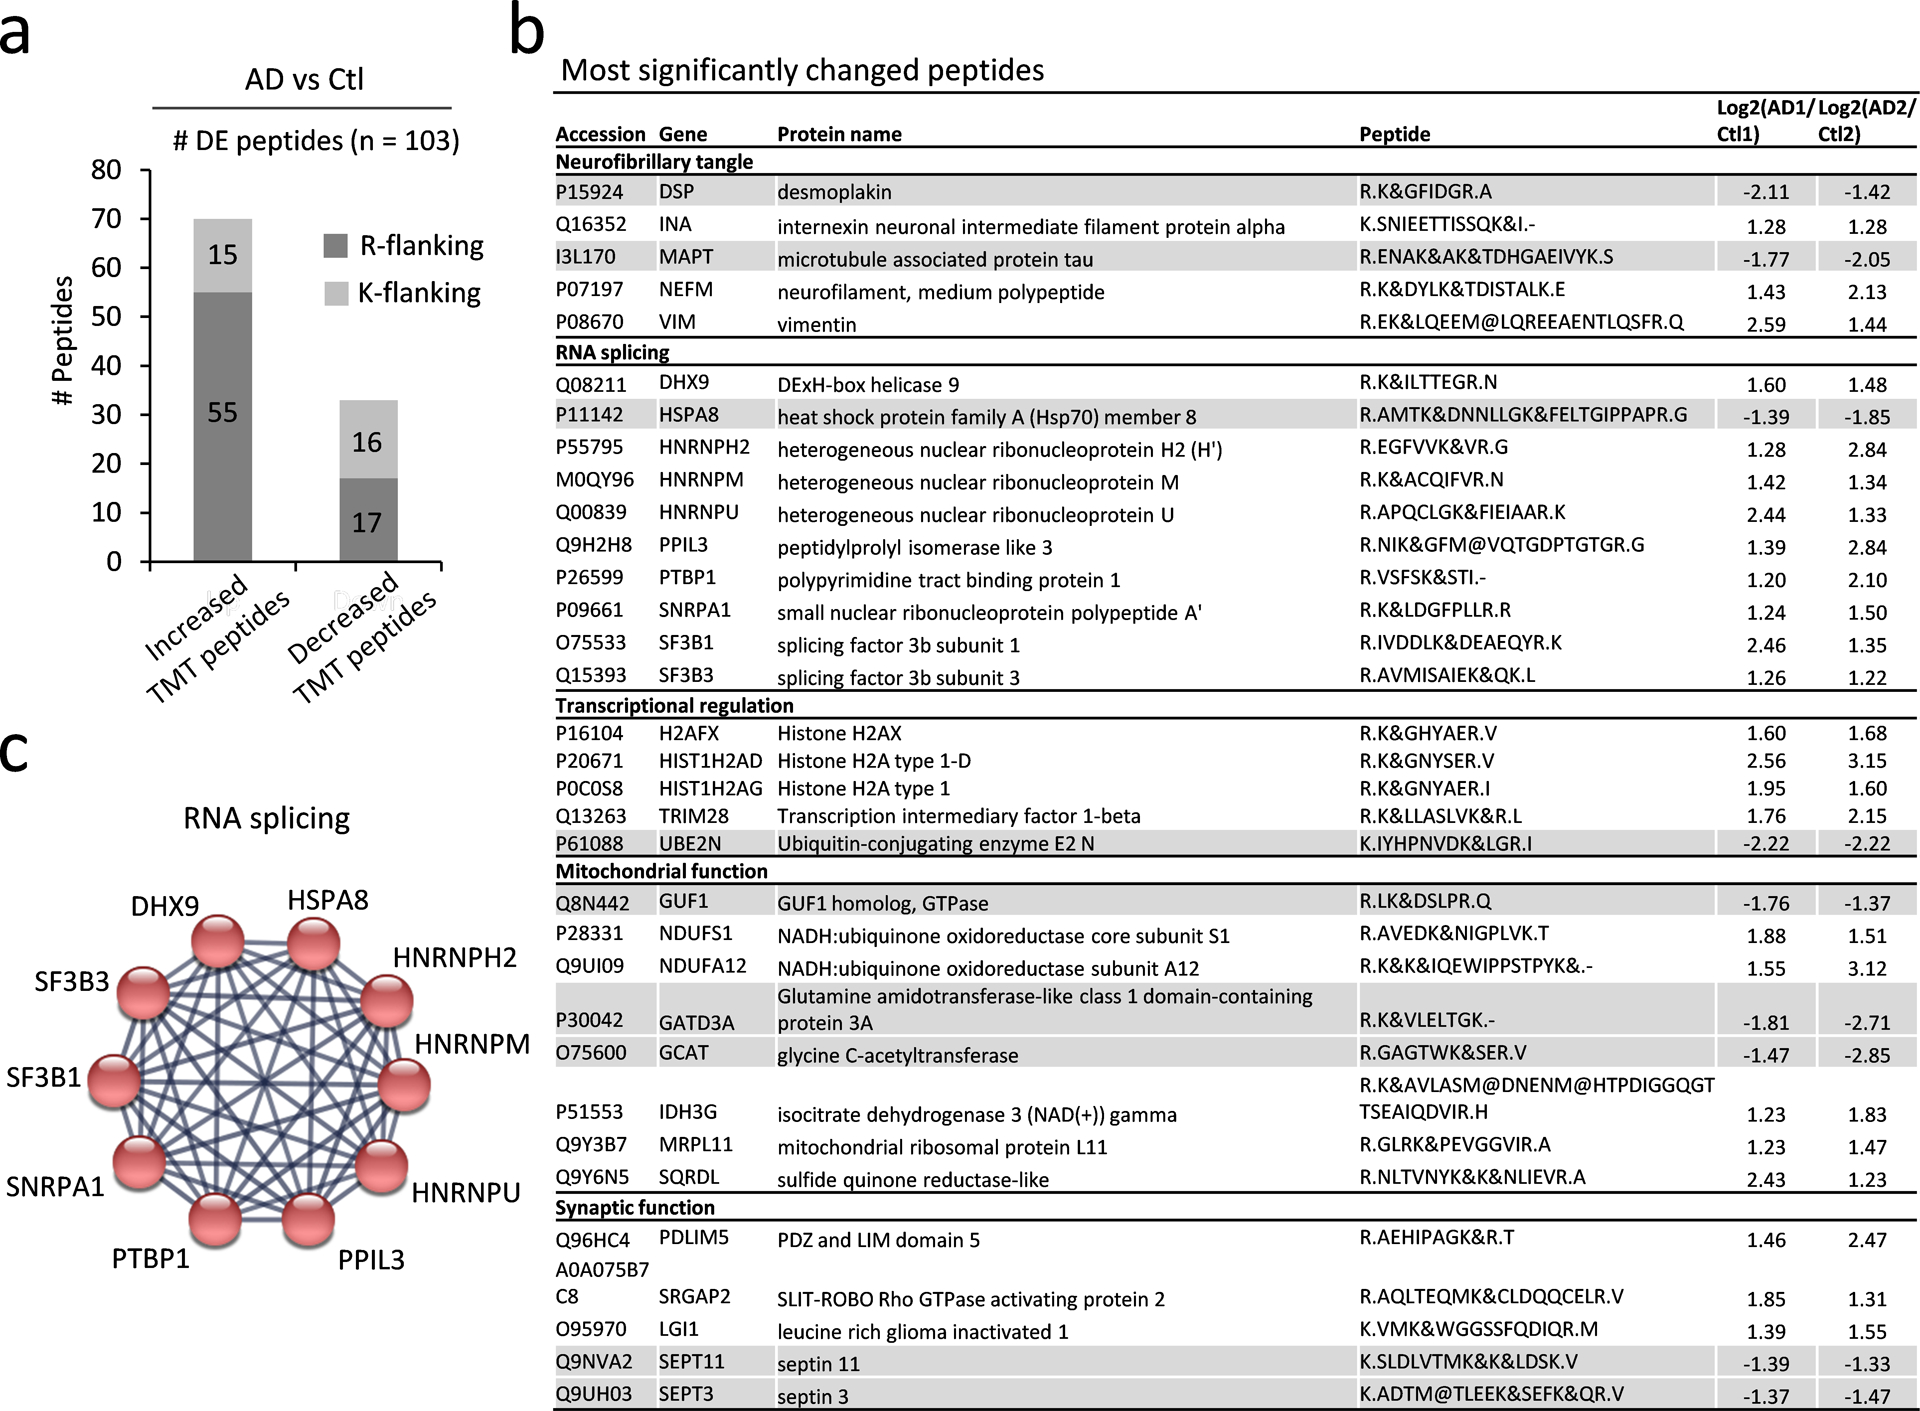
The linear sequence of amino acids in a protein folds into a 3D structure to execute protein activity and function, but it is still challenging to profile the 3D structure at the proteome scale. Here, we present a method of native protein tandem mass tag (TMT) profiling of Lys accessibility and its application to investigate structural alterations in human brain specimens of Alzheimer's disease (AD). In this method, proteins are extracted under a native condition, labeled by TMT reagents, followed by trypsin digestion and peptide analysis using two-dimensional liquid chromatography and tandem mass spectrometry (LC/LC-MS/MS). The method quantifies Lys labeling efficiency to evaluate its accessibility on the protein surface, which may be affected by protein conformations, protein modifications, and/or other molecular interactions. We systematically optimized the amount of TMT reagents, reaction time, and temperature and then analyzed protein samples under multiple conditions, including different labeling time (5 and 30 min), heat treatment, AD and normal human cases. The experiment profiled 15370 TMT-labeled peptides in 4475 proteins. As expected, the heat treatment led to extensive changes in protein conformations, with 17% of the detected proteome displaying differential labeling. Compared to the normal controls, AD brain showed different Lys accessibility of tau and RNA splicing complexes, which are the hallmarks of AD pathology, as well as proteins involved in transcription, mitochondrial, and synaptic functions. To eliminate the possibility that the observed differential Lys labeling was caused by protein level change, the whole proteome was quantified with standard TMT-LC/LC-MS/MS for normalization. Thus, this native protein TMT method enables the proteome-wide measurement of Lys accessibility, representing a straightforward strategy to explore protein structure in any biological system.
Keywords: Alzheimer’s disease; and tau; proteomics; structural mass spectrometry; structuromics; tandem mass tag.
Conflict of interest statement
Competing interests
The authors declare that they have no competing interests.
Figures
Similar articles
-
Proteomic landscape of Alzheimer's Disease: novel insights into pathogenesis and biomarker discovery.Mol Neurodegener. 2021 Aug 12;16(1):55. doi: 10.1186/s13024-021-00474-z. Mol Neurodegener. 2021. PMID: 34384464 Free PMC article. Review.
-
27-Plex Tandem Mass Tag Mass Spectrometry for Profiling Brain Proteome in Alzheimer's Disease.Anal Chem. 2020 May 19;92(10):7162-7170. doi: 10.1021/acs.analchem.0c00655. Epub 2020 May 7. Anal Chem. 2020. PMID: 32343560 Free PMC article.
-
Dissecting Detergent-Insoluble Proteome in Alzheimer's Disease by TMTc-Corrected Quantitative Mass Spectrometry.Mol Cell Proteomics. 2023 Aug;22(8):100608. doi: 10.1016/j.mcpro.2023.100608. Epub 2023 Jun 24. Mol Cell Proteomics. 2023. PMID: 37356496 Free PMC article.
-
Quantifying Proteome and Protein Modifications in Activated T Cells by Multiplexed Isobaric Labeling Mass Spectrometry.Methods Mol Biol. 2021;2285:297-317. doi: 10.1007/978-1-0716-1311-5_23. Methods Mol Biol. 2021. PMID: 33928561
-
Quantitative, high-resolution proteomics for data-driven systems biology.Annu Rev Biochem. 2011;80:273-99. doi: 10.1146/annurev-biochem-061308-093216. Annu Rev Biochem. 2011. PMID: 21548781 Review.
Cited by
-
DiLeu Isobaric Labeling Coupled with Limited Proteolysis Mass Spectrometry for High-Throughput Profiling of Protein Structural Changes in Alzheimer's Disease.Anal Chem. 2023 Jul 4;95(26):9746-9753. doi: 10.1021/acs.analchem.2c05731. Epub 2023 Jun 12. Anal Chem. 2023. PMID: 37307028 Free PMC article.
-
Proteomic landscape of Alzheimer's Disease: novel insights into pathogenesis and biomarker discovery.Mol Neurodegener. 2021 Aug 12;16(1):55. doi: 10.1186/s13024-021-00474-z. Mol Neurodegener. 2021. PMID: 34384464 Free PMC article. Review.
-
Optimization of protein-level tandem mass tag (TMT) labeling conditions in complex samples with top-down proteomics.Anal Chim Acta. 2022 Aug 15;1221:340037. doi: 10.1016/j.aca.2022.340037. Epub 2022 Jun 7. Anal Chim Acta. 2022. PMID: 35934336 Free PMC article.
-
Using in vivo intact structure for system-wide quantitative analysis of changes in proteins.Nat Commun. 2024 Oct 29;15(1):9310. doi: 10.1038/s41467-024-53582-x. Nat Commun. 2024. PMID: 39468068 Free PMC article.
-
Measuring Protein Shapes in Living Cells.J Proteome Res. 2021 Jun 4;20(6):3017. doi: 10.1021/acs.jproteome.1c00376. Epub 2021 May 14. J Proteome Res. 2021. PMID: 33988997 Free PMC article. No abstract available.
References
-
- Hipp MS; Kasturi P; Hartl FU, The proteostasis network and its decline in ageing. Nat Rev Mol Cell Biol 2019, 20, 421–435. - PubMed
-
- Bai B; Hales CM; Chen PC; Gozal Y; Dammer EB; Fritz JJ; Wang X; Xia Q; Duong DM; Street C; Cantero G; Cheng D; Jones DR; Wu Z; Li Y; Diner I; Heilman CJ; Rees HD; Wu H; Lin L; Szulwach KE; Gearing M; Mufson EJ; Bennett DA; Montine TJ; Seyfried NT; Wingo TS; Sun YE; Jin P; Hanfelt J; Willcock DM; Levey A; Lah JJ; Peng J, U1 small nuclear ribonucleoprotein complex and RNA splicing alterations in Alzheimer’s disease. Proc Natl Acad Sci U S A 2013, 110, 16562–16567. - PMC - PubMed
-
- Bai B; Wang X; Li Y; Chen PC; Yu K; Dey KK; Yarbro JM; Han X; Lutz BM; Rao S; Jiao Y; Sifford JM; Han J; Wang M; Tan H; Shaw TI; Cho JH; Zhou S; Wang H; Niu M; Mancieri A; Messler KA; Sun X; Wu Z; Pagala V; High AA; Bi W; Zhang H; Chi H; Haroutunian V; Zhang B; Beach TG; Yu G; Peng J, Deep Multilayer Brain Proteomics Identifies Molecular Networks in Alzheimer’s Disease Progression. Neuron 2020, 105, 975–991.e7. - PMC - PubMed
MeSH terms
Substances
Grants and funding
LinkOut - more resources
Full Text Sources
Other Literature Sources
Medical
Molecular Biology Databases
Research Materials
