. 2021 Feb 22;10(2):466.
doi: 10.3390/cells10020466.

Chemically Defined Xeno- and Serum-Free Cell Culture Medium to Grow Human Adipose Stem Cells

Affiliations

Chemically Defined Xeno- and Serum-Free Cell Culture Medium to Grow Human Adipose Stem Cells

Stefano Panella et al. Cells. .

Abstract

Adipose tissue is an abundant source of stem cells. However, liposuction cannot yield cell quantities sufficient for direct applications in regenerative medicine. Therefore, the development of GMP-compliant ex vivo expansion protocols is required to ensure the production of a "cell drug" that is safe, reproducible, and cost-effective. Thus, we developed our own basal defined xeno- and serum-free cell culture medium (UrSuppe), specifically formulated to grow human adipose stem cells (hASCs). With this medium, we can directly culture the stromal vascular fraction (SVF) cells in defined cell culture conditions to obtain hASCs. Cells proliferate while remaining undifferentiated, as shown by Flow Cytometry (FACS), Quantitative Reverse Transcription PCR (RT-qPCR) assays, and their secretion products. Using the UrSuppe cell culture medium, maximum cell densities between 0.51 and 0.80 × 10⁵ cells/cm2 (=2.55-4.00 × 10⁵ cells/mL) were obtained. As the expansion of hASCs represents only the first step in a cell therapeutic protocol or further basic research studies, we formulated two chemically defined media to differentiate the expanded hASCs in white or beige/brown adipocytes. These new media could help translate research projects into the clinical application of hASCs and study ex vivo the biology in healthy and dysfunctional states of adipocytes and their precursors. Following the cell culture system developers' practice and obvious reasons related to the formulas' patentability, the defined media's composition will not be disclosed in this study.

Keywords: UrSuppe; adipogenic differentiated adipose-derived stromal cells; defined cell culture; platelet lysate; white and beige/brown adipocyte; xeno- and serum-free cell culture.


Conflict of interest statement

The authors declare no conflict of interest regarding this paper’s publication.

Figures

Figure 1
Figure 1
Representative flow cytometry analysis of stromal vascular fraction (SVF) cells based on our seven-color staining procedure. (A) The gating strategy used to find viable target cells is shown. Syto 40 marks all nucleated cells, and 7-AAD discriminates between living and dead (plot A1 and A2, respectively). In the next two gates (plot A3 and A4, respectively), we selected cells that are relatively small and CD45. (B) Representative analysis of the SVF cells extracted from human subcutaneous adipose tissue. CD45 target cells were first analyzed for the expression of CD34-BV650 and CD146-PE. This leads to four sub-populations of cells (plot B1). Except for the lower left quadrant of plot B1, the cells present in the three other quadrants were further investigated for the expression of three pairs of new markers: (1) CD31-FITC/CD144-APC (plots B2, B7, & B10). (2) CD26-FITC/CD36-APC (plots B3, B6, B9). (3) CD73-FITC/CD36-APC (plots B4, B5, B8). Data in A and B are from a representative patient. See the Supplementary Information (S2: Characterization of the cells of the SVF from adipose tissue and Table S2) for more details about the markers used for this flow cytometry analysis.
Figure 1
Figure 1
Representative flow cytometry analysis of stromal vascular fraction (SVF) cells based on our seven-color staining procedure. (A) The gating strategy used to find viable target cells is shown. Syto 40 marks all nucleated cells, and 7-AAD discriminates between living and dead (plot A1 and A2, respectively). In the next two gates (plot A3 and A4, respectively), we selected cells that are relatively small and CD45. (B) Representative analysis of the SVF cells extracted from human subcutaneous adipose tissue. CD45 target cells were first analyzed for the expression of CD34-BV650 and CD146-PE. This leads to four sub-populations of cells (plot B1). Except for the lower left quadrant of plot B1, the cells present in the three other quadrants were further investigated for the expression of three pairs of new markers: (1) CD31-FITC/CD144-APC (plots B2, B7, & B10). (2) CD26-FITC/CD36-APC (plots B3, B6, B9). (3) CD73-FITC/CD36-APC (plots B4, B5, B8). Data in A and B are from a representative patient. See the Supplementary Information (S2: Characterization of the cells of the SVF from adipose tissue and Table S2) for more details about the markers used for this flow cytometry analysis.
Figure 2
Figure 2
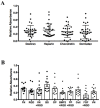
Identifying attachment substrates necessary for human adipose stem cells’ (hASCs) adherence to cell culture surface, spreading, and growth under serum-free conditions. Human ASCs obtained from three different donors were used to screen a 96-well plate coated with 24 different peptides non-covalently linked to four different highly sulphated glycosaminoglycans (GAGs: synthetic dextran sulfate, heparin, chondroitin, and dermatan) [47,48]. The cells’ growth in the 96-well plate was evaluated using a commercial colorimetric cell viability assay. (A) Values of relative absorbance measured at 450 nm and classified according to the four types of sulphated GAGs (synthetic dextran sulfate, heparin, chondroitin, and dermatan) were used as a backbone for the formation of the different coating matrices. The four GAGs do not have a great influence on cell attachment and growth. (B) Ten different peptides non-covalently linked to highly sulphated GAGs strongly influence the ability of hASCs to attach and grow in the test micro-wells. The results obtained with the 14 poor-performing peptide-combinations are not shown. As in Figure 2A, cell proliferation was measured using a commercial colorimetric kit. Histograms show the means ± standard deviations of the measured relative absorbances for hASCs obtained from three different donors. FN = fibronectin; VN = vitronectin; BS = bone sialoprotein; OP = osteopontin peptide; BMP2 = bone morphogenetic protein; PP = perlacan peptide; ColI = collagen I peptide; FGF = fibroblast growth factor.
Figure 3
Figure 3
Light microscopic pictures of patient-derived hASCs during cell growth in T25-flasks. Scale bar = 275 μm. d1 = after cell attachment, d5 = nearly fully confluent, d10 = hyperconfluent.
Figure 4
Figure 4
Time-dependent profiles of cell densities (left) and substrate/metabolite concentrations (right) in T25-flasks (n = 2 per donor). D-I (a), D-II (b), D-III (c), and D-IV (d). Partial medium exchanges of 40% and 60% were performed on days 4 and 8, respectively. The symbols represent the experimentally measured values collected from offline measurements. The lines represent the simulated time courses.
Figure 5
Figure 5
Flow cytometry analysis of cells at P0, P1, and P2 (A) Flow cytometry expression profile of selected markers. Data represent an average of three different samples. During culture passaging, the profile of the cells remains similar except for CD34. Data of positive cells are calculated on specific isotype controls. (B) Size distribution after isolation, during passages, and after differentiation (FCS: forward scatter and SSC: side scatter). P0, P1, P2: Indication of the passage number of hASCs grown in UrSuppe medium; ASCs found in the SVF as described and explained in Section 3.1; white adipose tissue (WAT) and beige adipose tissue (BAT) represent white or beige induction, respectively. Each point’s coordinate is the mean of three different samples; bars represent standard deviation.
Figure 6
Figure 6
(A) Factors that positively or negatively regulate the adipocyte differentiation process. Different regulatory proteins act at early and later stages to control adipogenesis. (B) Expression levels measured by RT-qPCR of genes involved in cell stemness or cell differentiation: (B1) stemness maintenance genes; (B2) differentiation regulators/markers; and (B3) lineage hierarchy markers. Primary hASCs from three different donors were analyzed at passages P0, P1, and P2. The three upper bar graphs show the relative fold-expression change of the different markers at P2 compared with hASCs at P0 (n = 3, error bars represent S.E.M.). The three lower figures represent the same data as the heatmap for the three different categories.
Figure 7
Figure 7
Adipose conversion shown by lipid staining with Oil Red O. Human ASCs at early passage (P3) expanded in Ursuppe basal medium are easily induced to differentiate into early adipocytes. Two different xeno- and serum-free induction media developed in our laboratory were used for these assays. Fold magnification 100×. Scale bar 100 µm. (A) Not induced hASC, grown on UrSuppe basal medium (negative control); (B) hASCs after ten days of white adipogenic induction with UrSuppe-white adipose tissue (US-WAT) medium; (C) hASCs after seven days of beige adipogenic induction with UrSuppe-beige/brown adipose tissue (US-BAT) medium. (D) Evaluation of the adipogenic differentiation based on the quantification of the Oil Red O absorbance, normalized for the number of cells present in the cell culture vessel. Data represent the mean absorbance ± SEM. To detect significant differences, a one-way analysis of variance (ANOVA) test was performed. * p-value < 0.05.
Figure 8
Figure 8
JC-10 staining shows mitochondrial depolarization after culturing confluent hASCs in the US-BAT medium. (A1A3) Negative control: not induced hASC, grown on UrSuppe basal medium. (B1B3) BAT induction, green fluorescence: changes of the membrane potential (caused by UCP1 expression). (1) Representative microphotograph taken with a 590 nm filter showing JC-10 aggregates in normal cells. (2) Representative microphotograph taken with a 525 nm filter showing JC-10 monomer in depolarized mitochondria. (3) Merged. Fold magnification 100×. Scale bar 150 µm.
Figure 9
Figure 9
RT-qPCR analysis of different genes involved in WAT and BAT differentiation. (A) Expression of seven common genes involved in adipogenesis regulation. (B) Expression of the two main common genes involved in the maturation of brown/beige adipose tissue. Data represent the mean fold-increase expression in different medium ± SD versus ASC. Gene expression is normalized to undifferentiated ASC (indicated on the “Expression” y-axis), the different expression of genes in WAT or BAT differentiation medium are indicated on the “Fold Increase” y-axis on the logarithmic scale. To detect a significant difference, a one-way ANOVA was performed for each gene. * p-value < 0.05; ** p-value < 0.01 *** p-value < 0.001.
Figure 10
Figure 10
Percentages of cells found to be positive for the 13 surface markers chosen for this analysis. Bar chart of summarized flow cytometry data for hASCs cultured in UrSuppe basal medium (white bar) or for cells differentiated in either US-WAT (grey bar) or US-BAT (black bar) medium. The chart shows the mean percentage of positive cells for the indicated surface markers. Average of data obtained from three different donors (n = 3, error bars represent S.E.M.).
Figure 11
Figure 11
Proteome profiler of hASCs grown in UrSuppe medium (blue bar), US-WAT (red bar), or US-BAT (green bar) induction medium. Data are represented as mean pixel intensity (MPI) of fluorescence measured by the Licor acquisition system. Measured values were normalized on background fluorescence and on positive control to obtain a relative MPI. This experiment was performed with hASCs obtained from the biopsy of one donor. The following factors are not shown in the graph because of a very low expression in undifferentiated hASCS: Chemerin, Fibrinogen, IGFBP-2, LIF, PAPP-A, PCSK9, Aerpin A8.
Figure 12
Figure 12
Oil Red O staining and quantification to evaluate the effect of hPL on adipogenic differentiation. hASCs after 10 days of adipogenic induction with or without hPL supplement (0.5%, 1%, 3%). (A) Representative phase-contrast microphotographs illustrating triglycerides accumulation: (A1) US-WAT only, (A2) US-WAT + 0.5% hPL, (A3) US-WAT + 1% hPL, and (A4) US-WAT + 3% hPL. Fold magnification 100×. Scale bar 100 µm. (B) Quantification of Oil Red O staining. 100% 2-propanol was used as background control and subtracted to the four test samples’ measured optical densities (ODs), which were then normalized on the number of nuclei present on every dish. The data refer to the value obtained with cells grown with US-WAT only, thus this bar chart shows the fold variation of absorbance related to this sample. The results represent the average ± SD of three different samples. Statistical analyses were performed as one-way ANOVA using Prism7 software, ** p < 0.01.
Figure 13
Figure 13
Preadipocytes’ dedifferentiation induced by the ex vivo cell culture conditions.

Similar articles

Cited by

References

    1. Zwick R.K., Guerrero-Juarez C.F., Horsley V., Plikus M.V. Anatomical, Physiological, and Functional Diversity of Adipose Tissue. Cell Metab. 2018;27:68–83. doi: 10.1016/j.cmet.2017.12.002. - DOI - PMC - PubMed
    1. Rosen E.D., Spiegelman B.M. What we talk about when we talk about fat. Cell. 2014;156:20–44. doi: 10.1016/j.cell.2013.12.012. - DOI - PMC - PubMed
    1. Luong Q., Huang J., Lee K.Y. Deciphering white adipose tissue heterogeneity. Biology. 2019;8:23. doi: 10.3390/biology8020023. - DOI - PMC - PubMed
    1. Chusyd D.E., Wang D., Huffman D.M., Nagy T.R. Relationships between Rodent White Adipose Fat Pads and Human White Adipose Fat Depots. Front. Nutr. 2016:3. doi: 10.3389/fnut.2016.00010. - DOI - PMC - PubMed
    1. Gesta S., Blühet M., Yamamoto Y., Norris A.W., Berndt J., Kralisch S., Boucher J., Lewis C., Kahn C.R. Evidence for a role of developmental genes in the origin of obesity and body fat distribution. Proc. Natl. Acad. Sci. USA. 2006;103:6676–6681. doi: 10.1073/pnas.0601752103. - DOI - PMC - PubMed

Publication types