

Guide Cells Support Muscle Regeneration and Affect Neuro-Muscular Junction Organization
- PMID: 33669272
- PMCID: PMC7920023
- DOI: 10.3390/ijms22041939
Guide Cells Support Muscle Regeneration and Affect Neuro-Muscular Junction Organization
Abstract
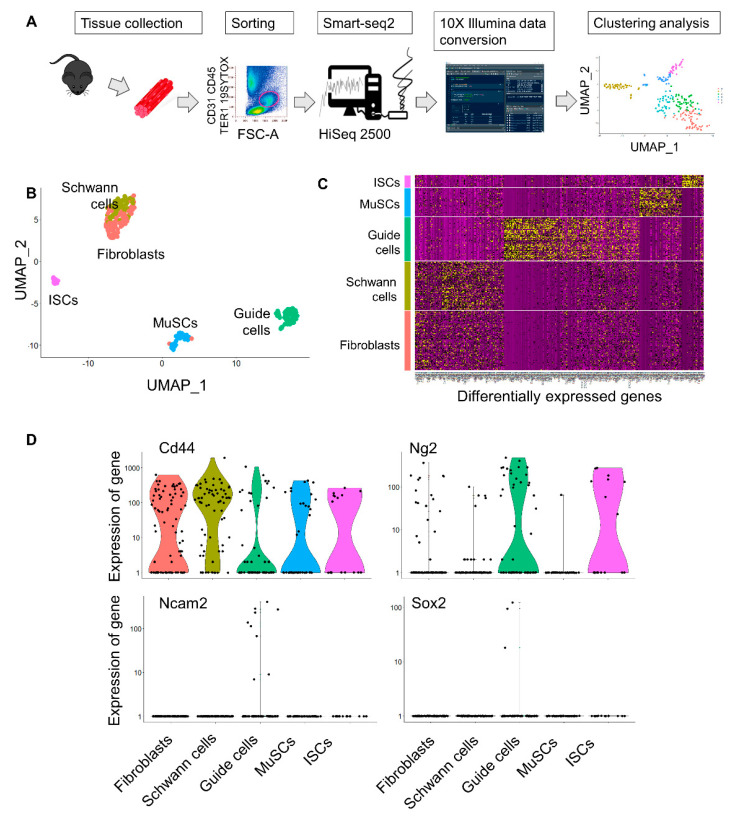
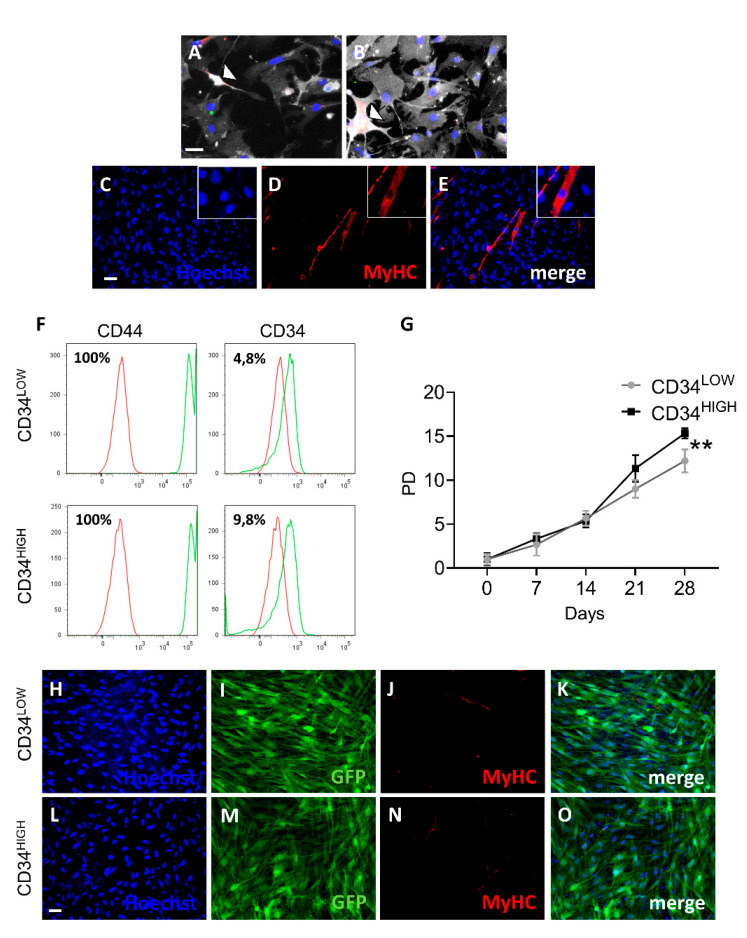
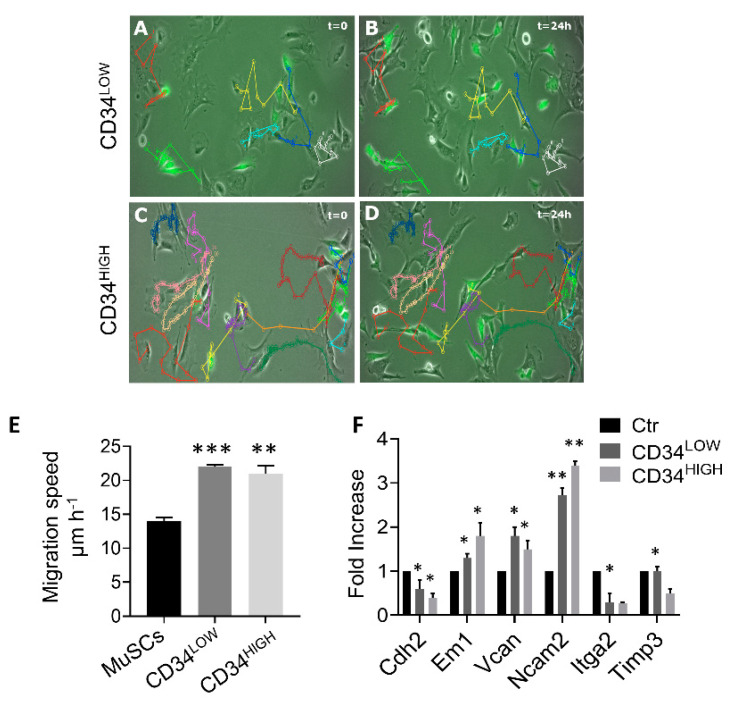
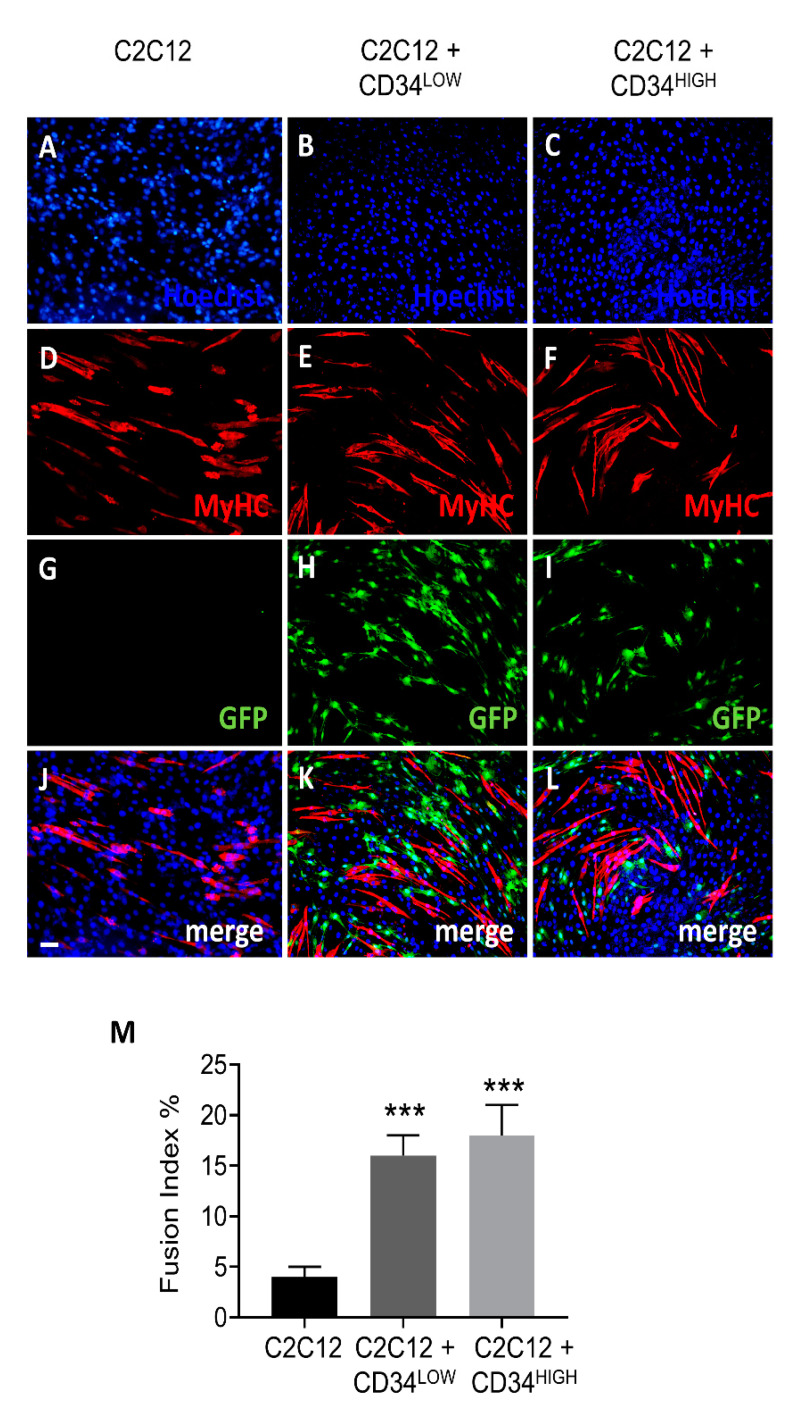
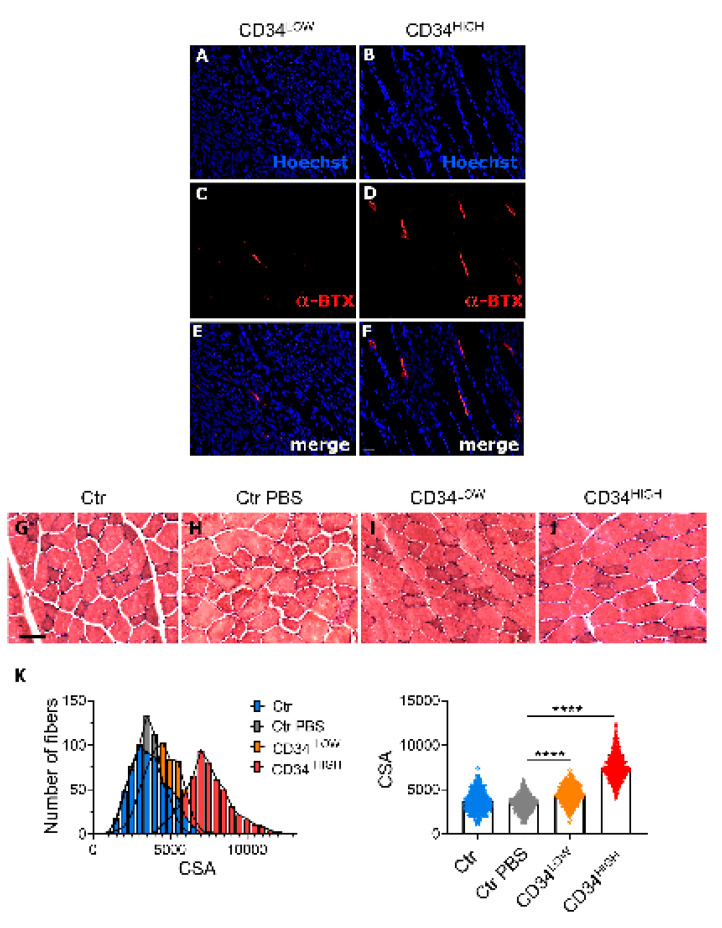
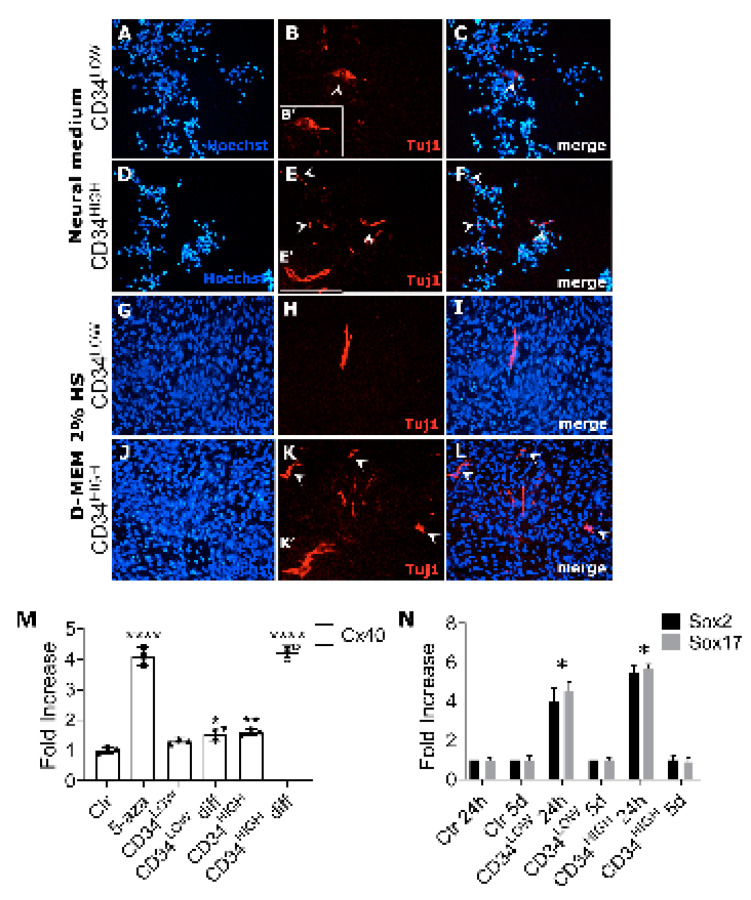
Muscular regeneration is a complex biological process that occurs during acute injury and chronic degeneration, implicating several cell types. One of the earliest events of muscle regeneration is the inflammatory response, followed by the activation and differentiation of muscle progenitor cells. However, the process of novel neuromuscular junction formation during muscle regeneration is still largely unexplored. Here, we identify by single-cell RNA sequencing and isolate a subset of vessel-associated cells able to improve myogenic differentiation. We termed them 'guide' cells because of their remarkable ability to improve myogenesis without fusing with the newly formed fibers. In vitro, these cells showed a marked mobility and ability to contact the forming myotubes. We found that these cells are characterized by CD44 and CD34 surface markers and the expression of Ng2 and Ncam2. In addition, in a murine model of acute muscle injury and regeneration, injection of guide cells correlated with increased numbers of newly formed neuromuscular junctions. Thus, we propose that guide cells modulate de novo generation of neuromuscular junctions in regenerating myofibers. Further studies are necessary to investigate the origin of those cells and the extent to which they are required for terminal specification of regenerating myofibers.
Keywords: guide cells; mesoangioblasts; muscle injury; neuro-muscular junctions; scRNA-seq.
Conflict of interest statement
The authors declare no conflict of interest.
Figures
Similar articles
-
Premature satellite cell activation before injury accelerates myogenesis and disrupts neuromuscular junction maturation in regenerating muscle.Am J Physiol Cell Physiol. 2020 Jul 1;319(1):C116-C128. doi: 10.1152/ajpcell.00121.2020. Epub 2020 May 6. Am J Physiol Cell Physiol. 2020. PMID: 32374678
-
Laminin alpha4 and integrin alpha6 are upregulated in regenerating dy/dy skeletal muscle: comparative expression of laminin and integrin isoforms in muscles regenerating after crush injury.Exp Cell Res. 2000 May 1;256(2):500-14. doi: 10.1006/excr.2000.4842. Exp Cell Res. 2000. PMID: 10772822
-
Neuromuscular electrical stimulation improves skeletal muscle regeneration through satellite cell fusion with myofibers in healthy elderly subjects.J Appl Physiol (1985). 2017 Sep 1;123(3):501-512. doi: 10.1152/japplphysiol.00855.2016. Epub 2017 Jun 1. J Appl Physiol (1985). 2017. PMID: 28572500
-
The Composition, Development, and Regeneration of Neuromuscular Junctions.Curr Top Dev Biol. 2018;126:99-124. doi: 10.1016/bs.ctdb.2017.08.005. Epub 2017 Nov 10. Curr Top Dev Biol. 2018. PMID: 29305005 Review.
-
Muscle regeneration: cellular and molecular events.In Vivo. 2009 Sep-Oct;23(5):779-96. In Vivo. 2009. PMID: 19779115 Review.
Cited by
-
Degenerative and regenerative peripheral processes are associated with persistent painful chemotherapy-induced neuropathies in males and females.Sci Rep. 2024 Jul 30;14(1):17543. doi: 10.1038/s41598-024-68485-6. Sci Rep. 2024. PMID: 39080341 Free PMC article.
-
Mesoangioblasts at 20: From the embryonic aorta to the patient bed.Front Genet. 2023 Jan 4;13:1056114. doi: 10.3389/fgene.2022.1056114. eCollection 2022. Front Genet. 2023. PMID: 36685855 Free PMC article. Review.
-
Upregulation of miR181a/miR212 Improves Myogenic Commitment in Murine Fusion-Negative Rhabdomyosarcoma.Front Physiol. 2021 Aug 6;12:701354. doi: 10.3389/fphys.2021.701354. eCollection 2021. Front Physiol. 2021. PMID: 34421639 Free PMC article.
-
Myoblast 3D bioprinting to burst in vitro skeletal muscle differentiation.J Tissue Eng Regen Med. 2022 May;16(5):484-495. doi: 10.1002/term.3293. Epub 2022 Mar 4. J Tissue Eng Regen Med. 2022. PMID: 35246958 Free PMC article.
-
Therapeutic Implications of miRNAs for Muscle-Wasting Conditions.Cells. 2021 Nov 5;10(11):3035. doi: 10.3390/cells10113035. Cells. 2021. PMID: 34831256 Free PMC article. Review.
References
-
- Cossu G., Previtali S.C., Napolitano S., Cicalese M.P., Tedesco F.S., Nicastro F., Noviello M., Roostalu U., Sora M.G.N., Scarlato M., et al. Intra-arterial transplantation of HLA-matched donor mesoangioblasts in Duchenne muscular dystrophy. EMBO Mol. Med. 2015;7:1513–1528. doi: 10.15252/emmm.201505636. - DOI - PMC - PubMed
-
- Mathiasen A.B., Qayyum A.A., Jørgensen E., Helqvist S., Fischer-Nielsen A., Kofoed K.F., Haack-Sørensen M., Ekblond A., Kastrup J. Bone marrow-derived mesenchymal stromal cell treatment in patients with severe ischaemic heart failure: A randomized placebo-controlled trial (MSC-HF trial) Eur. Heart J. 2015;36:1744–1753. doi: 10.1093/eurheartj/ehv136. - DOI - PubMed
-
- Périé S., Trollet C., Mouly V., Vanneaux V., Mamchaoui K., Bouazza B., Marolleau J.P., Laforêt P., Chapon F., Eymard B., et al. Autologous Myoblast Transplantation for Oculopharyngeal Muscular Dystrophy: A Phase I/Iia Clinical Study. Mol. Ther. 2014;22:219–225. doi: 10.1038/mt.2013.155. - DOI - PMC - PubMed
MeSH terms
Substances
Grants and funding
LinkOut - more resources
Full Text Sources
Other Literature Sources
Miscellaneous
