Biphasic spatiotemporal regulation of GRB2 dynamics by p52SHC for transient RAS activation
- PMID: 33665062
- PMCID: PMC7902154
- DOI: 10.2142/biophysico.bppb-v18.001
Biphasic spatiotemporal regulation of GRB2 dynamics by p52SHC for transient RAS activation
Abstract
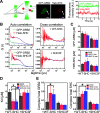
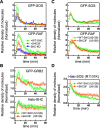
RTK-RAS-MAPK systems are major signaling pathways for cell fate decisions. Among the several RTK species, it is known that the transient activation of ERK (MAPK) stimulates cell proliferation, whereas its sustained activation induces cell differentiation. In both instances however, RAS activation is transient, suggesting that the strict temporal regulation of its activity is critical in normal cells. RAS on the cytoplasmic side of the plasma membrane is activated by SOS through the recruitment of GRB2/SOS complex to the RTKs that are phosphorylated after stimulation with growth factors. The adaptor protein GRB2 recognizes phospho-RTKs both directly and indirectly via another adaptor protein, SHC. We here studied the regulation of GRB2 recruitment under the SHC pathway using single-molecule imaging and fluorescence correlation spectroscopy in living cells. We stimulated MCF7 cells with a differentiation factor, heregulin, and observed the translocation, complex formation, and phosphorylation of cell signaling molecules including GRB2 and SHC. Our results suggest a biphasic regulation of the GRB2/SOS-RAS pathway by SHC: At the early stage (<10 min) of stimulation, SHC increased the amplitude of RAS activity by increasing the association sites for the GRB2/SOS complex on the plasma membrane. At the later stage however, SHC suppressed RAS activation and sequestered GRB2 molecules from the membrane through the complex formation in the cytoplasm. The latter mechanism functions additively to other mechanisms of negative feedback regulation of RAS from MEK and/or ERK to complete the transient activation dynamics of RAS.
Keywords: FCCS; RTK-RAS-MAPK; cell signaling; single-molecule imaging; temporal regulation.
2021 THE BIOPHYSICAL SOCIETY OF JAPAN.
Figures


Similar articles
-
p52Shc regulates the sustainability of ERK activation in a RAF-independent manner.Mol Biol Cell. 2021 Sep 1;32(19):1838-1848. doi: 10.1091/mbc.E21-01-0007. Epub 2021 Jul 14. Mol Biol Cell. 2021. PMID: 34260260 Free PMC article.
-
Signaling molecules involved in coupling growth hormone receptor to mitogen-activated protein kinase activation.Endocrinology. 1997 Oct;138(10):4301-7. doi: 10.1210/endo.138.10.5453. Endocrinology. 1997. PMID: 9322943
-
Mechanism of SHIP-mediated inhibition of insulin- and platelet-derived growth factor-stimulated mitogen-activated protein kinase activity in 3T3-L1 adipocytes.Mol Endocrinol. 2005 Feb;19(2):421-30. doi: 10.1210/me.2004-0096. Epub 2004 Oct 14. Mol Endocrinol. 2005. PMID: 15486046
-
High affinity IgG receptor activation of Src family kinases is required for modulation of the Shc-Grb2-Sos complex and the downstream activation of the nicotinamide adenine dinucleotide phosphate (reduced) oxidase.J Immunol. 1999 Dec 1;163(11):6023-34. J Immunol. 1999. PMID: 10570290
-
Inhibitors of Ras signal transduction as antitumor agents.Biochem Pharmacol. 2000 Oct 15;60(8):1165-9. doi: 10.1016/s0006-2952(00)00428-7. Biochem Pharmacol. 2000. PMID: 11007954 Review.
Cited by
-
p52Shc regulates the sustainability of ERK activation in a RAF-independent manner.Mol Biol Cell. 2021 Sep 1;32(19):1838-1848. doi: 10.1091/mbc.E21-01-0007. Epub 2021 Jul 14. Mol Biol Cell. 2021. PMID: 34260260 Free PMC article.
-
Changes of Signaling Pathways in Hypothalamic Neurons with Aging.Curr Issues Mol Biol. 2023 Oct 12;45(10):8289-8308. doi: 10.3390/cimb45100523. Curr Issues Mol Biol. 2023. PMID: 37886966 Free PMC article. Review.
-
Announcement of BPPB paper awards 2022.Biophys Physicobiol. 2022 Oct 13;19:e190042. doi: 10.2142/biophysico.bppb-v19.0042. eCollection 2022. Biophys Physicobiol. 2022. PMID: 36349324 Free PMC article. No abstract available.
-
Dynamic regulation of RAS and RAS signaling.Biochem J. 2023 Jan 13;480(1):1-23. doi: 10.1042/BCJ20220234. Biochem J. 2023. PMID: 36607281 Free PMC article.
-
Editors' Roundup: June 2022.Biophys Rev. 2022 Jun 19;14(3):619-623. doi: 10.1007/s12551-022-00970-6. eCollection 2022 Jun. Biophys Rev. 2022. PMID: 35791384 Free PMC article.
References
-
- Marshall, C. J. Specificity of receptor tyrosine kinase signaling: transient versus sustained extracellular signal-regulated kinase activation. Cell 80, 179–185 (1995). DOI: 10.1016/0092-8674(95)90401-8 - PubMed
-
- Kao, S., Jaiswal, R. K., Kolch, W. & Landreth, G. E.. Identification of the mechanisms regulating the differential activation of the mapk cascade by epidermal growth factor and nerve growth factor in PC12 cells. J. Biol. Chem. 276, 18169–18177 (2001). DOI: 10.1074/jbc.M008870200 - PubMed
-
- Nagashima, T., Shimodaira, H., Ide, K., Nakakuki, T., Tani, Y., Takahashi, K., et al. . Quantitative transcriptional control of ErbB receptor signaling undergoes graded to biphasic response for cell differentiation. J. Biol. Chem. 282, 4045–4056 (2007). DOI: 10.1074/jbc.M608653200 - PubMed
-
- Sharma, S. V., Bell, D. W., Settleman, J. & Haber, D. A.. Epidermal growth factor receptor mutations in lung cancer. Nat. Rev. Cancer 7, 169–181 (2007). DOI: 10.1038/nrc2088 - PubMed
LinkOut - more resources
Full Text Sources
Other Literature Sources
Research Materials
Miscellaneous

