. 2021 Mar 4;16(1):14.
doi: 10.1186/s13024-021-00434-7.

Enhancing GABAergic signaling ameliorates aberrant gamma oscillations of olfactory bulb in AD mouse models

Affiliations

Enhancing GABAergic signaling ameliorates aberrant gamma oscillations of olfactory bulb in AD mouse models

Ming Chen et al. Mol Neurodegener. .

Abstract

Background: Before the deposition of amyloid-beta plaques and the onset of learning memory deficits, patients with Alzheimer's disease (AD) experience olfactory dysfunction, typified by a reduced ability to detect, discriminate, and identify odors. Rodent models of AD, such as the Tg2576 and APP/PS1 mice, also display impaired olfaction, accompanied by aberrant in vivo or in vitro gamma rhythms in the olfactory pathway. However, the mechanistic relationships between the electrophysiological, biochemical and behavioral phenomena remain unclear.

Methods: To address the above issues in AD models, we conducted in vivo measurement of local field potential (LFP) with a combination of in vitro electro-olfactogram (EOG), whole-cell patch and field recordings to evaluate oscillatory and synaptic function and pharmacological regulation in the olfactory pathway, particularly in the olfactory bulb (OB). Levels of protein involved in excitation and inhibition of the OB were investigated by western blotting and fluorescence staining, while behavioral studies assessed olfaction and memory function.

Results: LFP measurements demonstrated an increase in gamma oscillations in the OB accompanied by altered olfactory behavior in both APP/PS1 and 3xTg mice at 3-5 months old, i.e. an age before the onset of plaque formation. Fewer olfactory sensory neurons (OSNs) and a reduced EOG contributed to a decrease in the excitatory responses of M/T cells, suggesting a decreased ability of M/T cells to trigger interneuron GABA release indicated by altered paired-pulse ratio (PPR), a presynaptic parameter. Postsynaptically, there was a compensatory increase in levels of GABAAR α1 and β3 subunits and subsequent higher amplitude of inhibitory responses. Strikingly, the GABA uptake inhibitor tiagabine (TGB) ameliorated abnormal gamma oscillations and levels of GABAAR subunits, suggesting a potential therapeutic strategy for early AD symptoms. These findings reveal increased gamma oscillations in the OB as a core indicator prior to onset of AD and uncover mechanisms underlying aberrant gamma activity in the OB.

Conclusions: This study suggests that the concomitant dysfunction of both olfactory behavior and gamma oscillations have important implications for early AD diagnosis: in particular, awareness of aberrant GABAergic signaling mechanisms might both aid diagnosis and suggest therapeutic strategies for olfactory damage in AD.

Keywords: 3xTg; APP/PS1; Alzheimer’s disease; GABAAR; Gamma oscillations; Olfactory bulb; Tiagabine.


Conflict of interest statement

The authors declare that they have no competing interests.

Figures

Fig. 1
Fig. 1
Impaired olfactory behavior in APP/PS1 and 3xTg mice. a Representative tracking paths in the cookie-finding test. b Illustration of buried-food test. c APP/PS1 mice showed significantly more entries into the wrong arms in the cookie-finding test compared to WT littermates (n = 16 for WT and 15 for APP/PS1, p = 0.02). d APP/PS1 mice spent significantly more time to find the food in the buried-food test (n = 10 for both WT and APP/PS1, p = 0.04). e Aged (11–12 months) APP/PS1 mice showed significantly more entries into the wrong arms (n = 12 for both WT and APP/PS1, p = 0.03). f Aged APP/PS1 mice showed significantly increased time spent in finding the food (n = 11 for both WT and APP/PS1, p = 0.0003). g-h 3xTg mice showed impaired olfactory behavior as well (n = 7 for WT and 3xTg, p = 0.04 for cookie-finding test and 0.03 for buried-food test). Values represent mean ± SEM. Two-sample t-test. *p < 0.05, *** p < 0.001
Fig. 2
Fig. 2
Altered oscillatory activities in the OB of APP/PS1 mice. a Schematic diagram showing in vivo LFP recording in the OB. b-c Representative traces of extracellular recordings showing theta, beta and gamma oscillations in the OB of 3–5 month-old WT and APP/PS1 mice. d Oscillatory power in the theta band is significantly reduced in the OB of APP/PS1 mice compared to WT controls (p = 0.004). e Identical power in the beta band of WT and APP/PS1 mice (p = 0.386). f Significantly increased power in the low-gamma band (p = 0.011). g High-gamma power did not differ significantly in APP/PS1 mice compared to WT controls (p = 0.06) (n = 17 for WT and 18 for APP/PS1). Values represent mean ± SEM. Two-sample t-test. *p < 0.05, **p < 0.01
Fig. 3
Fig. 3
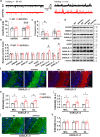
Altered miniature synaptic responses and levels of GABAAR subunits in the OB of APP/PS1 mice. a Representative mEPSC and mIPSC traces. b Significantly increased mIPSC amplitude in the OB of APP/PS1 compared to WT mice (n = 19 cells from 3 WT mice and 16 cells from 3 APP/PS1 mice, p = 0.0003). c Significantly decreased mEPSC frequency in the OB of APP/PS1 compared to WT mice (n = 13 cells from 3 WT mice and n = 10 cells from 3 APP/PS1 mice, p = 0.03). d-e Representative immunoblots and quantification of excitation- and inhibition-related protein levels in the OB (n = 3–9 per genotype, GABAAR β3: p = 0.03; GABAAR α1: p = 0.03). f-i Representative images and statistical analysis of immunofluorescent staining of GABAAR α1 and β3 subunits in the OB of WT and APP/PS1 mice at 3–5 months (n = 3 slices/mouse, 3 mice for WT and 4 mice for APP/PS1; GABAARα1: p = 0.036 for MCL, p = 0.032 for EPL, p = 0.021 for GL; GABAARβ3: p = 0.021 for MCL, p = 0.019 for EPL, p = 0.033 for GL). j-k Representative images and statistical analysis of immunofluorescent staining of GABAAR α5 subunit (n = 3 sections/mouse, 3 mice for WT and 4 mice for APP/PS1; p = 0.793 for MCL, p = 0.529 for EPL, p = 0.597 for GL). Scale bar: 100 μm. Values represent mean ± SEM. Two-sample t-test. *p < 0.05; ***p < 0.001
Fig. 4
Fig. 4
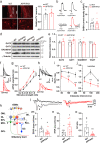
Abnormal PPR and field IPSP in APP/PS1 mice. a Identical numbers of PV-positive interneurons in the OB of APP/PS1 and WT mice (n = 3 slices/mouse, 3 mice for each genotype). b Representative traces showing evoked GABA current of WT mice in response to puffing brain lysates obtained from WT and APP/PS1 OB, respectively. Each trace represents an average of five sweeps. c Quantification showing similar GABA current density induced by puffing OB supernatant of APP/PS1 and WT mice, indicating total GABA content in the OB did not differ significantly between the two genotypes (n = 13 cells for WT-, and n = 11 for APP/PS1-supernatants). d-e Representative immunoblots and quantification of several GABAergic transporters in the OB. f-g Sample traces of whole-cell patch recording of single eIPSC and quantification showing a significant increase in the amplitude of eIPSCs in APP/PS1 mice (n = 8 cells from 3 WT and 9 cells from 3 APP/PS1, p = 3 × 10− 7 for interaction of genotype and stimulus strength, two-way ANOVA with Bonferroni’s post-hoc test). h-i Representative traces and quantification of paired-pulse responses. PPR decreased significantly at 100- and 200-ms interpulse intervals (n = 8 cells from 3 WT and 9 cells from 3 APP/PS1; 100 ms: p = 0.004; 200 ms: p = 0.004, one-way ANOVA with Tukey’s post-hoc test). j Similar effect of baclofen on PPR of both groups (n = 11 cells from 5 WT and 8 cells from 3 APP/PS1; 50 ms: p = 0.157; 100 ms: p = 0.006; 200 ms: p = 0.011, one-way ANOVA with Tukey’s post-hoc test). k Diagram showing field EPSP recording in slice. P: periglomerular cell, S: short axon cell. l Representative traces of ONL stimulation induced mixed EPSP (indicated as 1), pure EPSP (2) and IPSP (3). (m-o) Significantly reduced slope of pure EPSP (n = 8 slices from 4 WT and 10 slices from 4 APP/PS1, p = 0.045, two-sample t-test), increased area of IPSP (p = 0.044, two-sample t-test) and reduced E/I ratio (p = 0.003, nonparametric Kolmogorov-Smirnov test). Values represent mean ± SEM. *p < 0.05; **p < 0.01; ***p < 0.001
Fig. 5
Fig. 5
Reduction in the EOG and numbers of mature OSNs in APP/PS1 OE. a Diagram showing EOG recording in the olfactory turbinate. b Representative EOG traces from olfactory turbinate of WT and APP/PS1 mice in response to odor (amyl acetate) application. c Significantly decreased EOG amplitude (p = 3 × 10− 5), increased rise time (p = 0.008) and unchanged decay time of EOG (p = 0.583) (n = 7, per genotype). d-e Immunofluorescent staining of OMP and quantification showing marked reduction in numbers of mature OSNs in the APP/PS1 OE (n = 5 slices from 3 mice, per genotype, p = 0.005). Scale bar: 20 μm. Values represent mean ± SEM. Two-sample t-test. **p < 0.01; ***p < 0.001
Fig. 6
Fig. 6
TGB attenuates aberrant gamma power and levels of GABAARs. a Diagram illustrating simultaneous in vivo microinjection and LFP recording in the OB. b-c Representative traces and quantification of gamma oscillations in APP/PS1 OB before (baseline) and after microinjection of GBZ at 500 μM. GBZ injection has no significant effect on gamma power (n = 5 mice, p = 0.33, paired sample t-test). d Representative traces of gamma oscillation in WT and APP/PS1 before and after microinjection of TGB. e Increased gamma oscillatory power in APP/PS1 OB is ameliorated after acute TGB microinjection compared to baseline (n = 9 for WT and n = 6 for APP/PS1, p = 0.002 for WT vs APP/PS1; p = 0.02 for APP/PS1 baseline vs APP/PS1 + TGB; p = 0.06 for WT + TGB vs APP/PS1 + TGB, two-way ANOVA with Bonferroni’s post-hoc test). f-g Representative immunoblots and quantification of GABAAR α1, β3 subunits and GluR1 in the OB of TGB- and vehicle-treated mice. TGB significantly reduced levels of GABAAR α1 and β3 subunits (n = 5–8 mice/group, GABAAR β3: p = 0.03 for WT vs APP/PS1; p = 0.009 for APP/PS1 vs APP/PS1 + TGB; GABAAR α1: p = 0.001 for WT vs APP/PS1; p = 0.0002 for APP/PS1 vs APP/PS1 + TGB, two-sample t-test). h One-week TGB did not improve olfactory behavior in APP/PS1 mice (n = 7–9 mice/group; p = 0.0002 for WT + PBS vs APP/PS1 + PBS; p = 0.037 for WT + TGB vs APP/PS1 + TGB; p = 0.52 for APP/PS1 + PBS vs APP/PS1 + TGB, two-sample t-test). Values represent mean ± SEM. *p < 0.05; **p < 0.01; ***p < 0.001
Fig. 7
Fig. 7
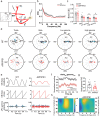
Altered synchronization and coupling between OB and aPC in APP/PS1 mice. a Schematic diagram showing in vivo dual-site extracellular recordings in the OB and aPC. b-c Cross coherence of simultaneous LFPs in the OB and aPC indicating significantly decreased consistency between OB and aPC in both low-gamma and high-gamma bands in APP/PS1 mice (n = 11 for WT and 9 for APP/PS1; theta: p = 0.761; beta: p = 0.197; low gamma: p = 0.04; high gamma: p = 0.024, Wilcoxon rank-sum test). d Significantly shorter mean vector length of PSC in beta (p = 1.51 × 10− 10) and high gamma (p = 0.034, Wilcoxon rank-sum test) phases, and significantly different distributions of phase differences showing decreased phase synchronization between OB and aPC. The resultant vector across animals is shown as blue arrows and values represent individual PSCs of identical frequency band. e Typical examples of instantaneous phases derived from OB theta oscillations and aPC gamma oscillations’ amplitude, which were used for cross frequency PAC calculation. f Dynamic changing curves of 1-s interval PAC in both genotypes. Note that APP/PS1 differed largely from WT in normalized units. g Quantification showing significantly decreased theta-gamma cross-band PAC between the OB and aPC in APP/PS1 mice (n = 15 epochs from 11 WT and 18 epochs from 9 APP/PS1, p = 0.016, Wilcoxon rank-sum test). h APP/PS1 displayed less strength of information flow than WT mice. Directionality confirmed PAC mainly from the OB to aPC with more positive values. Values represent mean ± SEM. *p < 0.05
Fig. 8
Fig. 8
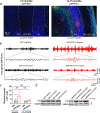
Reducing interstitial fluid levels of Aβ reverses the abnormalities of gamma power in APP/PS1 OB. a Representative images of Aβ deposition in the OB of APP/PS1 mice aged 3–5 and 14–15 months, suggesting a lack of obvious amyloid plaques in 3–5 month-old APP/PS1 OB. Scale bar: 50 μm. b-c Two-day IP injection of LY-411575 significantly decreased gamma power (n = 11 for vehicle-treated WT and 12 for LY-411575-treated WT, n = 9 for vehicle-treated APP/PS1 and 12 for LY-411575-treated APP/PS1; p = 0.006 for WT + vehicle vs APP/PS1 + vehicle; p = 0.001 for APP/PS1 + vehicle vs APP/PS1 + LY-411575, two-way ANOVA with Bonferroni’s post-hoc test). d Increased levels of CTFs specifically in APP/PS1 OB confirming the effect of LY-411575 in reducing Aβ production. Values represent mean ± SEM. **p < 0.01
Fig. 9
Fig. 9
Abnormal oscillatory activities and the effect of TGB in the OB of 3xTg mice. a Representative gamma oscillation in the OB of 3–5 month-old WT and 3xTg mice. b-c Unchanged power in the theta and beta band of 3xTg compared to WT mice. d-e Significantly increased power in low-gamma band (p = 0.0007) and similar power in high-gamma band (p = 0.195) of WT and 3xTg mice. f TGB significantly reduced gamma power and normalized the difference of gamma oscillation between 3xTg and WT (n = 11 for WT and n = 13 for 3xTg; p = 0.0001, WT vs 3xTg; p = 0.0001, 3xTg vs 3xTg + TGB; p = 1, WT + TGB vs 3xTg + TGB). g-h Representative immunoblots and quantification of excitation- and inhibition-related protein levels in the OB (n = 3, per genotype, two repeats, GluR1: p = 0.032; GABAARβ2: p = 0.026; GABAARβ3: p = 0.001; GABAARα1: p = 0.02). (i-l) Representative images and statistical analysis of immunofluorescent staining of GABAAR α1 and β3 subunits in the OB of WT and 3xTg mice at 3–5 months (n = 3–4 sections/mouse, 3 mice for WT and 5 mice for 3xTg; GABAAR α1: p = 0.036 for MCL, p = 0.032 for EPL, p = 0.021 for GL; GABAAR β3: p = 0.021 for MCL, p = 0.019 for EPL, p = 0.033 for GL). Values represent mean ± SEM. Two-sample t-test. *p < 0.05; **p < 0.01; *** p < 0.001
Fig. 10
Fig. 10
Schematic illustration of the neural mechanism underlying aberrant gamma oscillation. APP/PS1 mice exhibit a reduction in both the number of OSNs and in EOG amplitude (Fig. 5), resulting in a decreased OE → OB glutamatergic innervation (Fig. 3c, Fig. 4i-j) and subsequent reduction in the capacity of M/T cells to trigger GC and other interneurons to release GABA, accompanied with a compensatory increase in GABAAR subunits (Fig. 3d-i) that resulted in increased amplitude of inhibitory responses (Fig. 3b, Fig. 4f-g and n). Together, these alterations lead to reduction of E/I (Fig. 4o) and subsequent increase in gamma oscillation

Similar articles

Cited by

References

    1. Goedert M, Spillantini MG. A century of Alzheimer’s disease. Science. 2006;314:777–781. - PubMed
    1. Perrin RJ, Fagan AM, Holtzman DM. Multimodal techniques for diagnosis and prognosis of Alzheimer's disease. Nature. 2009;461:916–922. - PMC - PubMed
    1. Canter RG, Penney J, Tsai LH. The road to restoring neural circuits for the treatment of Alzheimer's disease. Nature. 2016;539:187–196. - PubMed
    1. Sevigny J, Chiao P, Bussiere T, Weinreb PH, Williams L, Maier M, et al. The antibody aducanumab reduces Abeta plaques in Alzheimer's disease. Nature. 2016;537:50–56. - PubMed
    1. Hettinger JC, Lee H, Bu G, Holtzman DM, Cirrito JR. AMPA-ergic regulation of amyloid-beta levels in an Alzheimer’s disease mouse model. Mol Neurodegener. 2018;13:22. - PMC - PubMed

Publication types

Substances

LinkOut - more resources