. 2021 Mar;591(7851):659-664.
doi: 10.1038/s41586-021-03309-5. Epub 2021 Mar 3.

Actin cables and comet tails organize mitochondrial networks in mitosis

Affiliations

Actin cables and comet tails organize mitochondrial networks in mitosis

Andrew S Moore et al. Nature. 2021 Mar.

Abstract

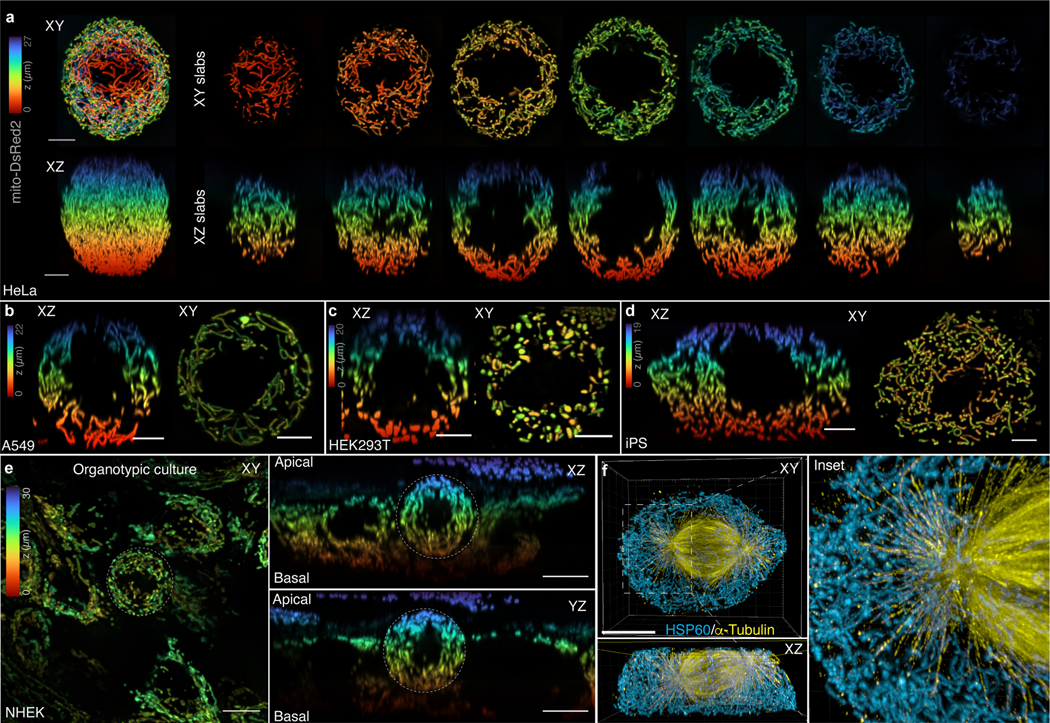
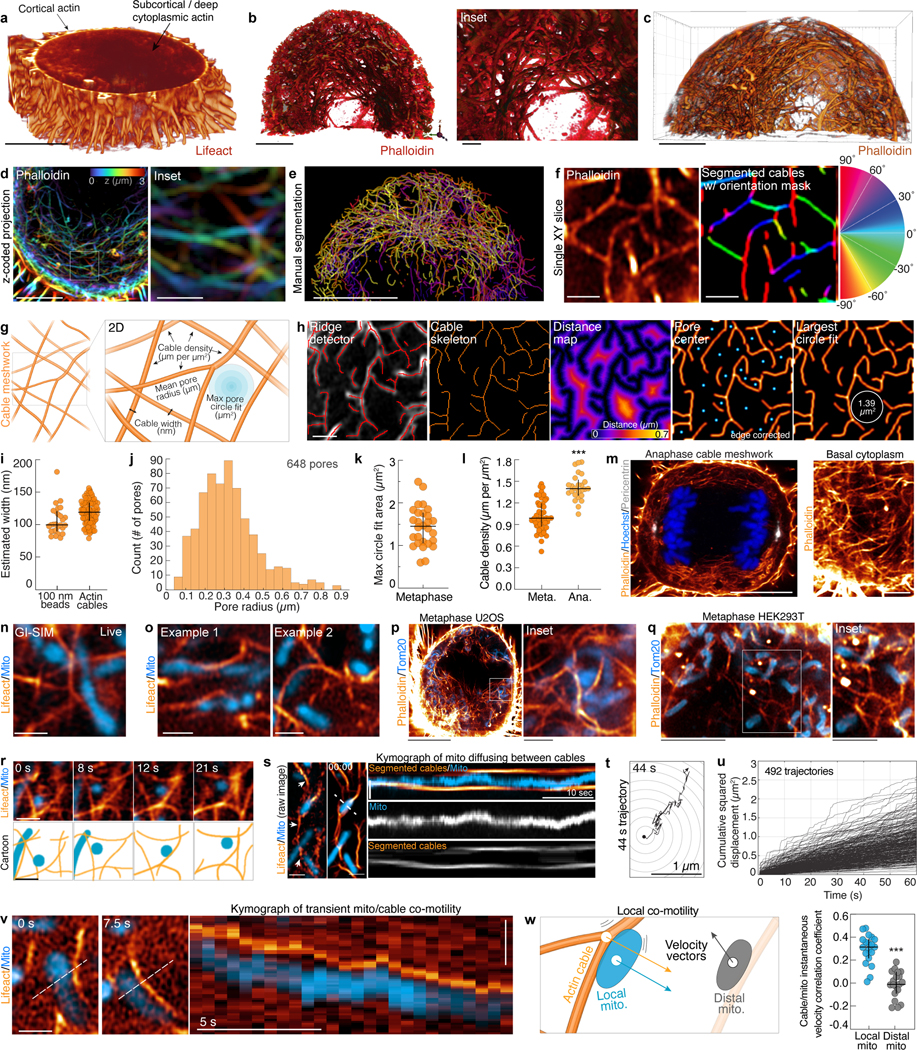
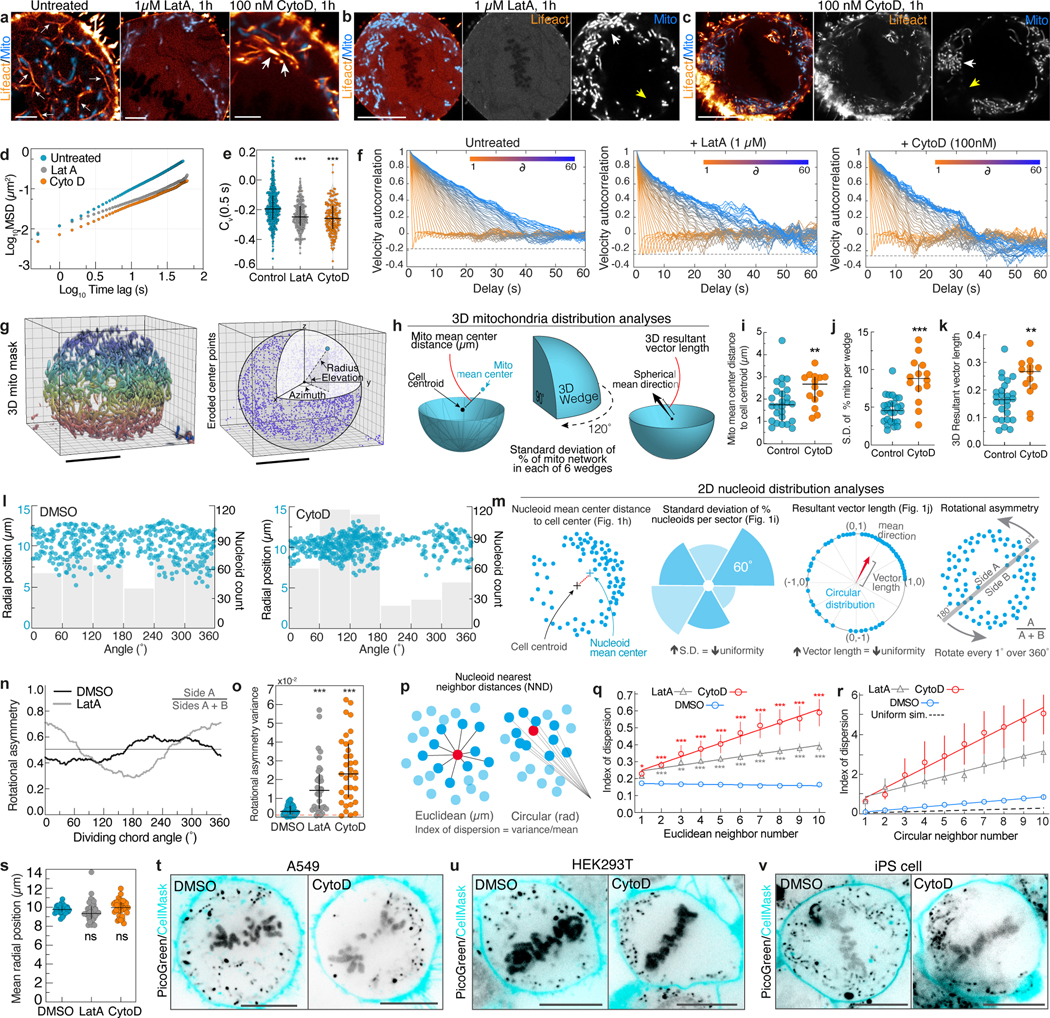
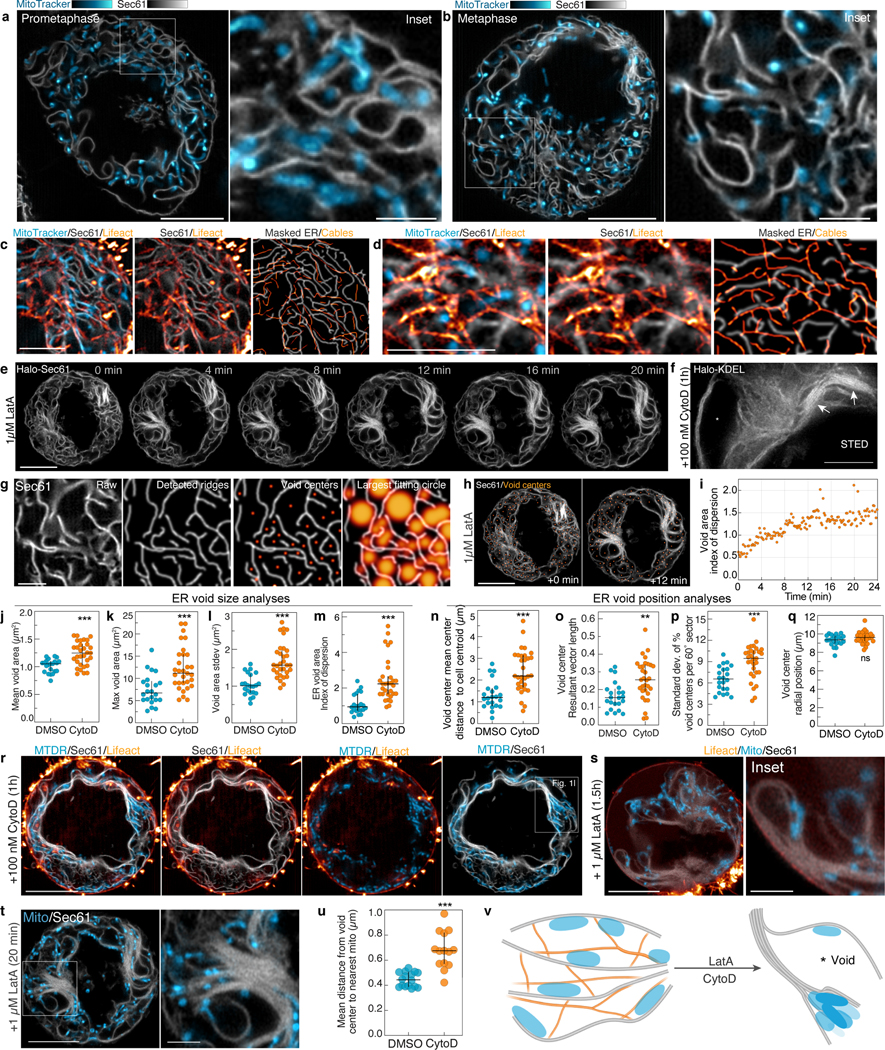
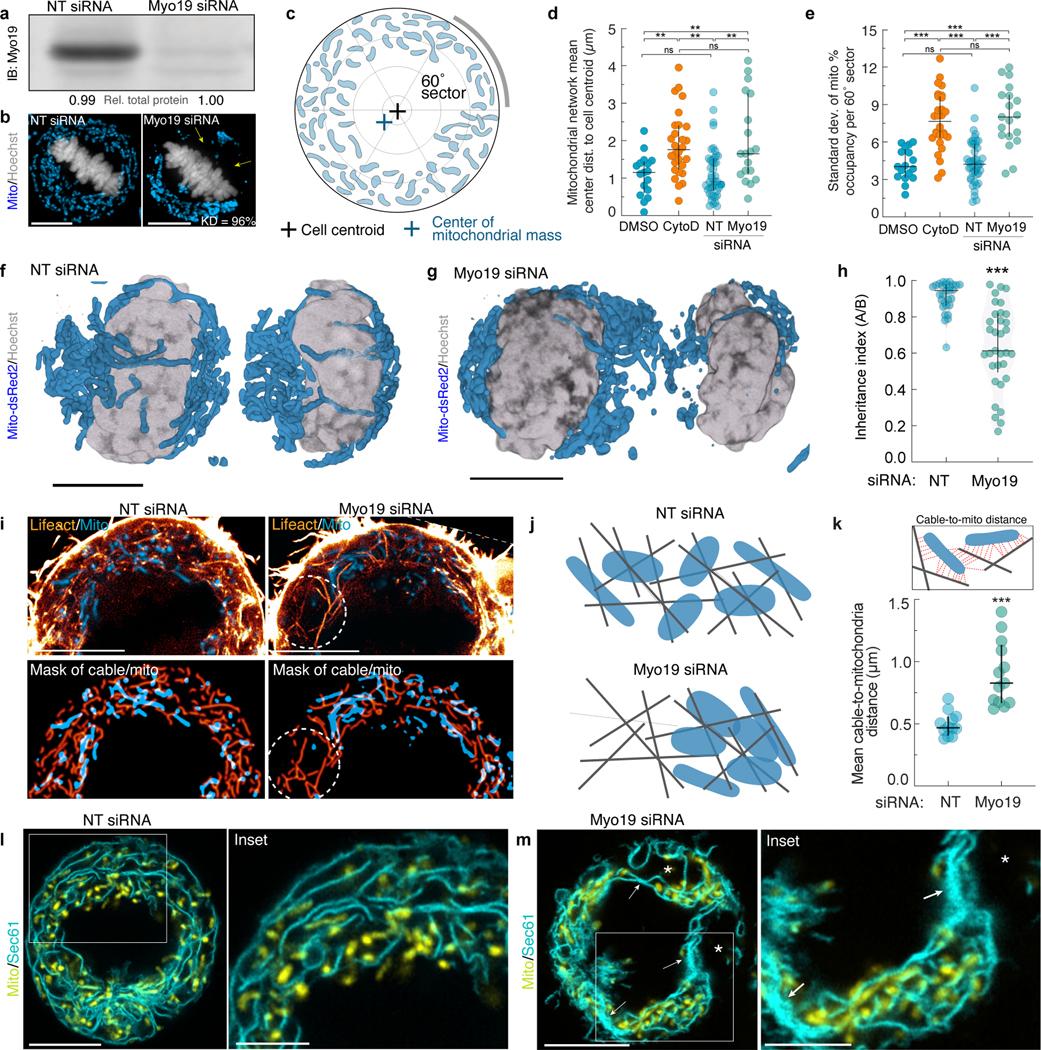
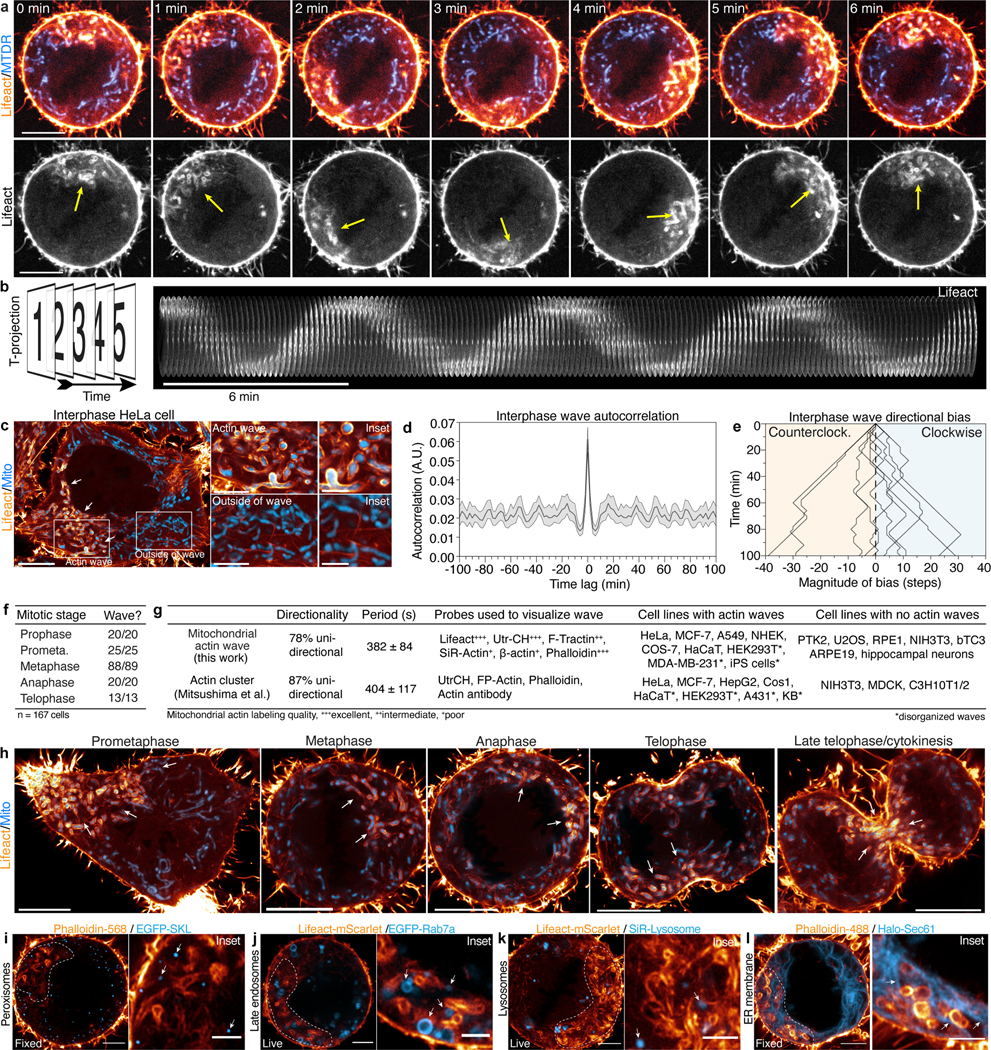
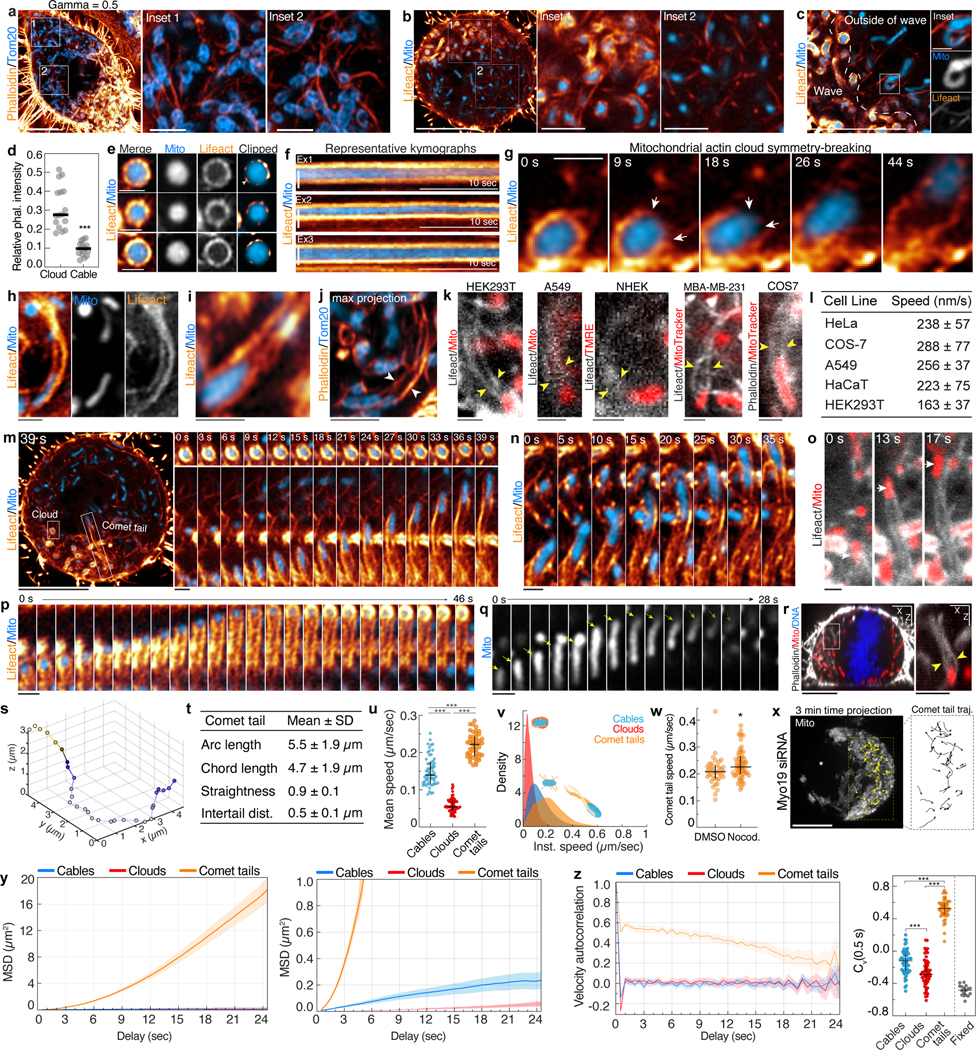
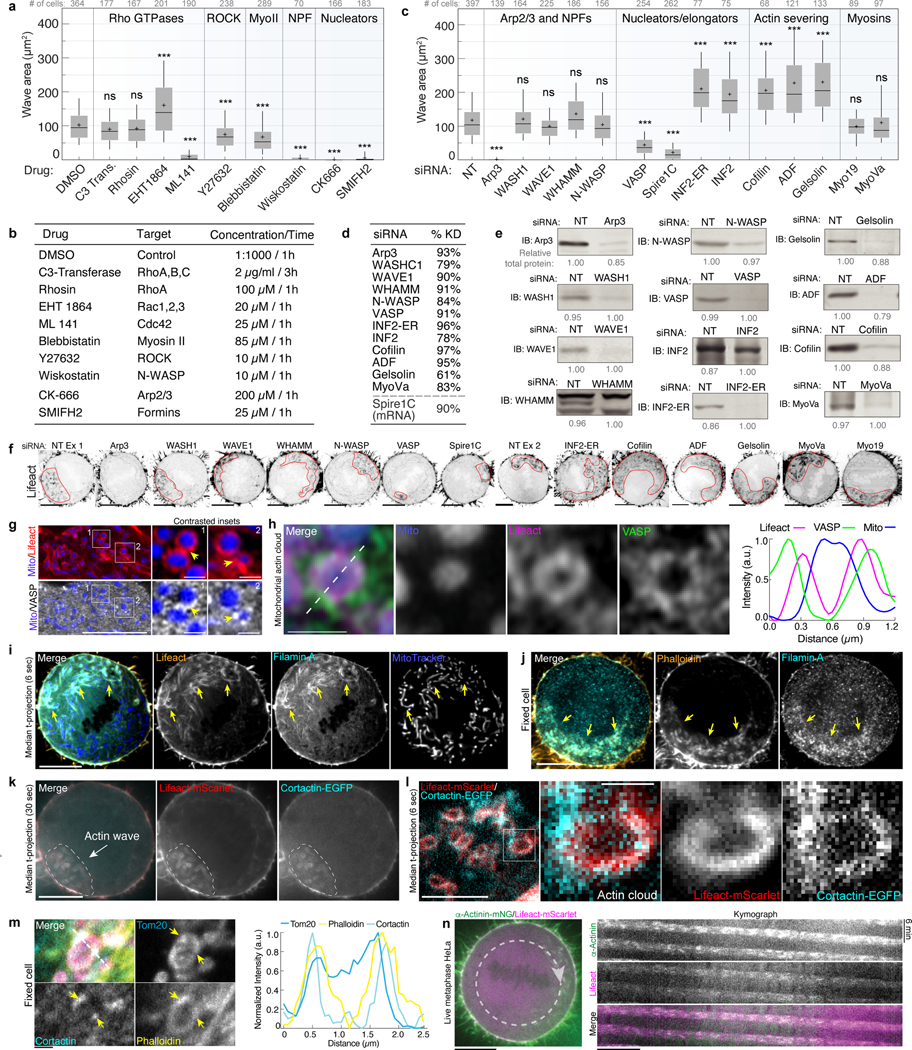
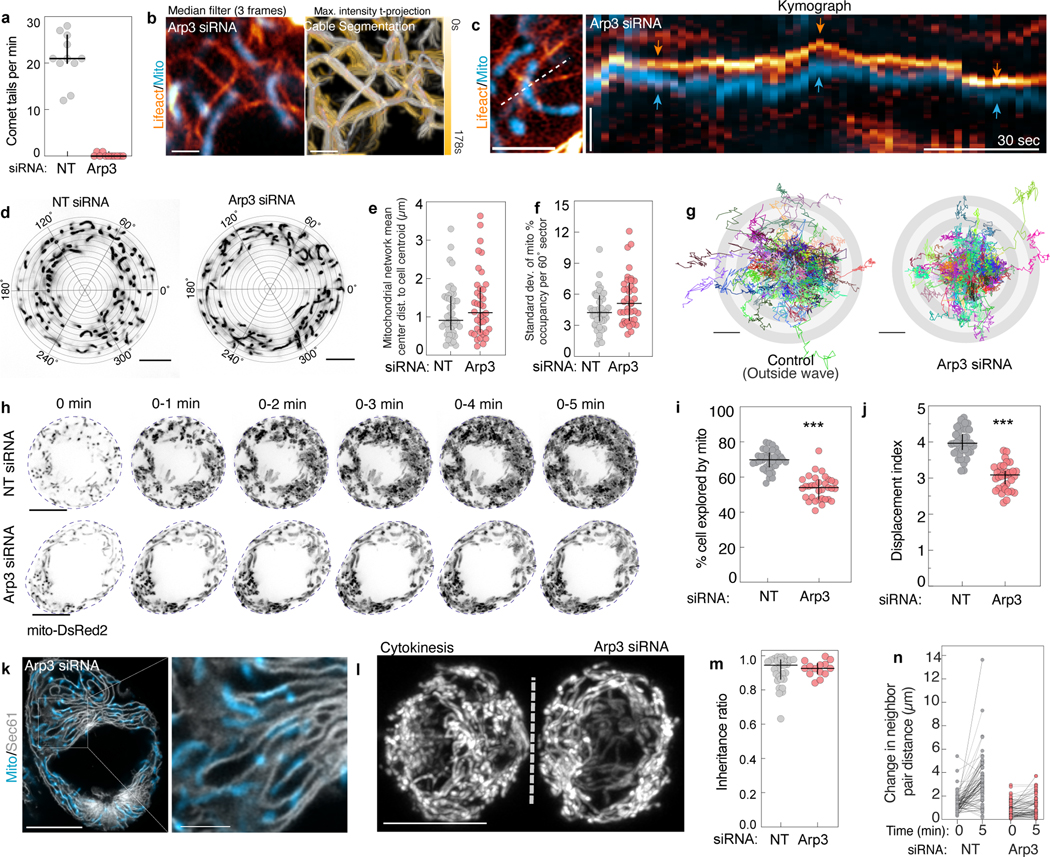
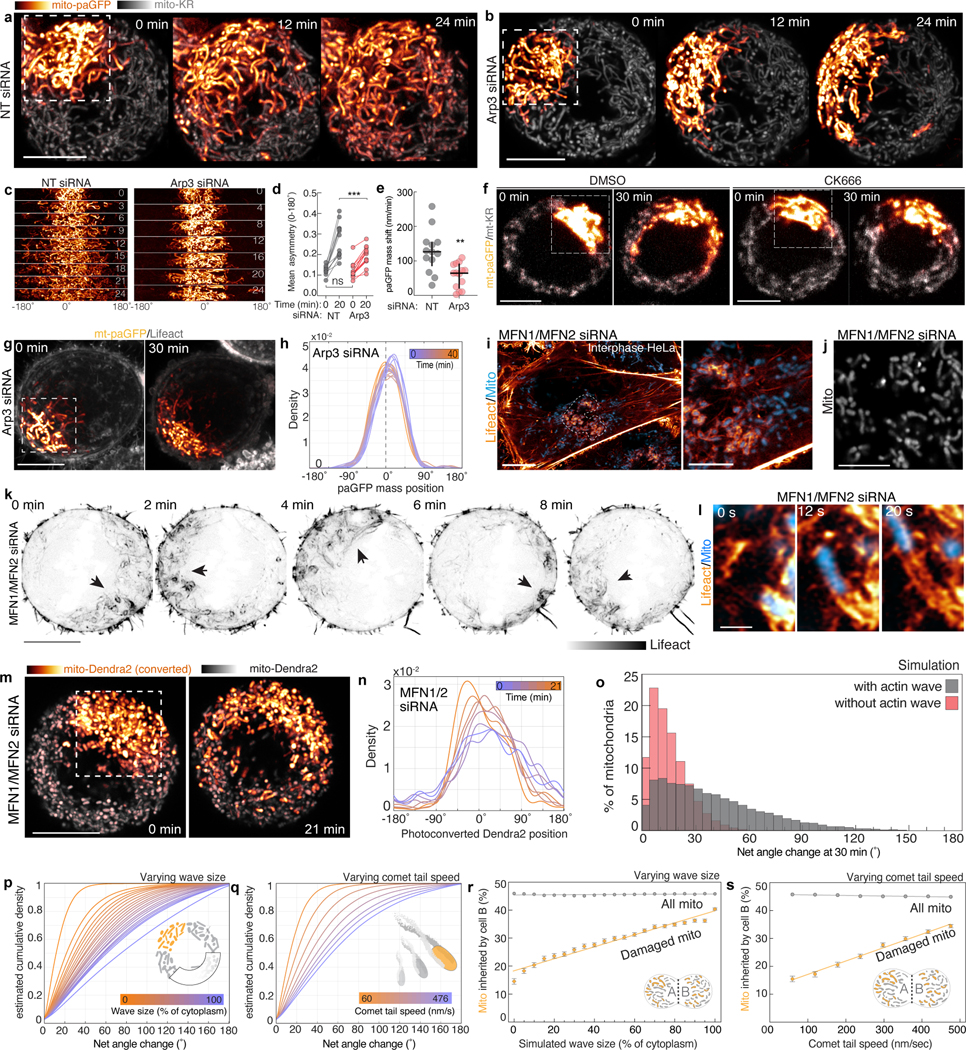
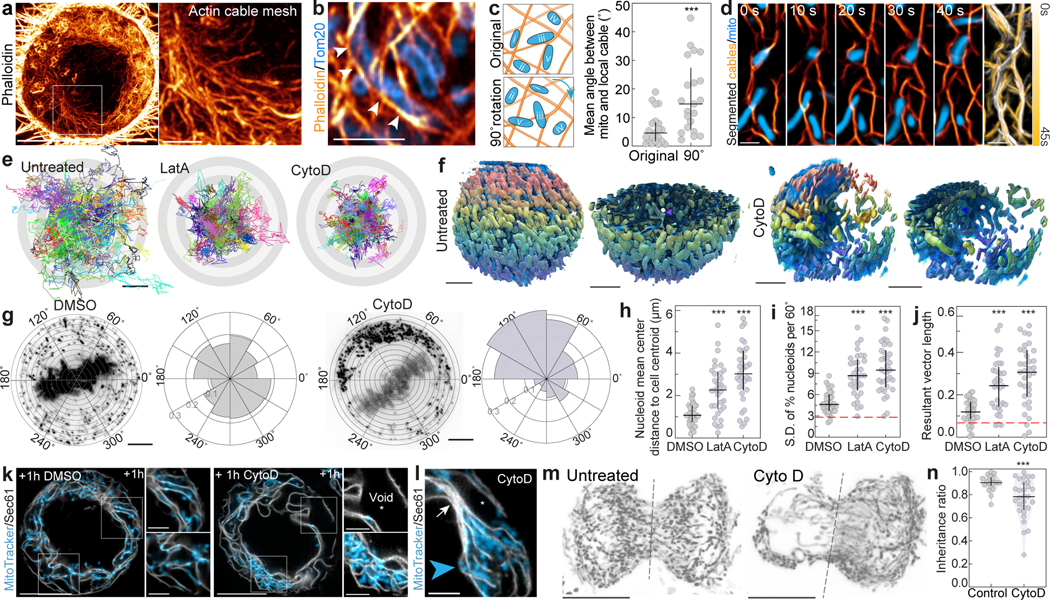
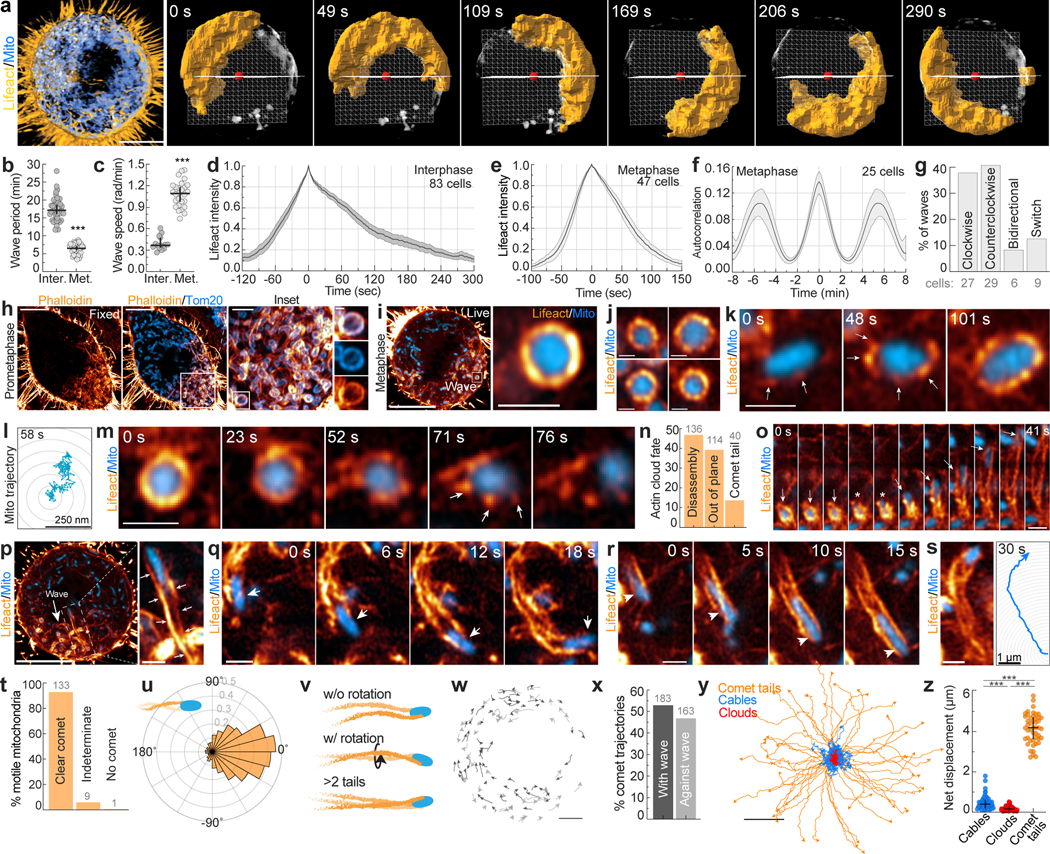
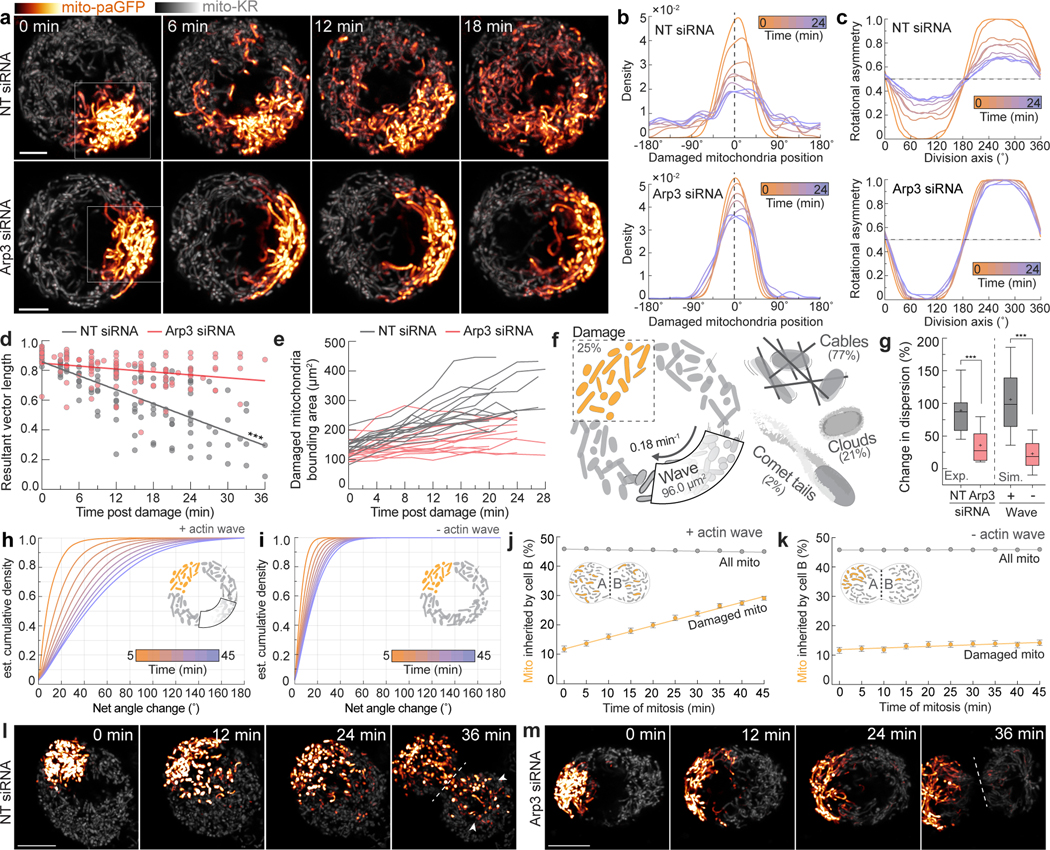
Symmetric cell division requires the even partitioning of genetic information and cytoplasmic contents between daughter cells. Whereas the mechanisms coordinating the segregation of the genome are well known, the processes that ensure organelle segregation between daughter cells remain less well understood1. Here we identify multiple actin assemblies with distinct but complementary roles in mitochondrial organization and inheritance in mitosis. First, we find a dense meshwork of subcortical actin cables assembled throughout the mitotic cytoplasm. This network scaffolds the endoplasmic reticulum and organizes three-dimensional mitochondrial positioning to ensure the equal segregation of mitochondrial mass at cytokinesis. Second, we identify a dynamic wave of actin filaments reversibly assembling on the surface of mitochondria during mitosis. Mitochondria sampled by this wave are enveloped within actin clouds that can spontaneously break symmetry to form elongated comet tails. Mitochondrial comet tails promote randomly directed bursts of movement that shuffle mitochondrial position within the mother cell to randomize inheritance of healthy and damaged mitochondria between daughter cells. Thus, parallel mechanisms mediated by the actin cytoskeleton ensure both equal and random inheritance of mitochondria in symmetrically dividing cells.


Figures

Extended Data Figure 1.
Extended Data Figure 1.. Mitochondrial networks are uniformly distributed throughout the cytoplasm surrounding the mitotic spindle.
a. Z-coded XY and XZ maximum intensity projections of ~4 μm slabs through a live, metaphase HeLa expressing Mito-dsRed2. Mitochondria are excluded from the spindle region and are uniformly distributed above, below, and around the spindle. b-d. Z-coded XY and XZ maximum intensity projections of ~4 μm sections through the center of (b) A549, (c) HEK293T, and (d) iPS cells expressing Mito-dsRed2. Scale bars = 5 μm. e. Z-coded XY (left) and XZ (right) maximum intensity projections of ~ 4μm sections through the center of a live, organotypic culture of normal human epidermal keratinocytes (NHEK) expressing Mito-dsRed2. f. 4× expanded iSIM rendering of mitochondria (anti-HSP60) and microtubules (anti-α-tubulin) in a prometaphase HeLa. Mitochondria are entirely excluded from the spindle and show limited overlap with astral microtubules. Scale bars 40 μm (f), 10 μm (e), 5 μm (a-d).
Extended Data Figure 2.
Extended Data Figure 2.. A 3D meshwork of actin cables associates with mitochondrial networks in the deep metaphase cytoplasm.
a. 3D rendering of the bottom third of a live, Lifeact-EGFP expressing metaphase HeLa imaged by spinning disk confocal microscopy. While the cortical actin signal is well resolved, lower contrast deep subcortical actin assemblies appear hazy and ill-defined. b. Shadow projection of subcortical/cytoplasmic actin in a fixed, phalloidin-AF488 stained HeLa. Inset shows 3D meshwork of actin cables. Volume was acquired by Airyscan microscopy and the brighter cortical actin signal was computationally masked and removed. c. Blend projection of actin cables (AF488-phalloidin) in a metaphase HeLa. Volume was acquired by Airyscan and processed as in (b). d. Z-coded maximum intensity projection of the actin meshwork (AF488-phalloidin) in a prometaphase HeLa with zoomed-in inset. e. Manual segmentation of actin cables in one half of a metaphase HeLa. f. Single-slice, Airyscan image of metaphase actin cables (AF488-Phalloidin). Segmented cables are pseudocolored by relative orientation (−90°– 90°). g. Cartoon schematic of actin cable meshwork indicating parameters used for analysis. h. Representative actin cable analysis workflow showing ridge detection to identify and skeletonize cables, Euclidean distance mapping to identify pore centers, and largest circle fitting technique to estimate max pore size. All analyses were performed on 2D slices in the basal metaphase cytoplasm. i. Estimated width of actin cables and 100 nm TetraSpeck beads imaged by grazing-incidence structured illumination microscopy (GI-SIM). Widths are based on full width at half maximum (FWHM) of gaussian fits of 1 px line scans through individual cables. j. Frequency distribution of actin mesh pore radii. k. Area of largest actin meshwork fitting circle. l. Actin cable density in metaphase or anaphase HeLa. m. Airyscan image of actin cables (phalloidin), DNA (Hoechst), and centrosomes (anti-pericentrin) in a central slice of an anaphase HeLa. Inset of actin cables in the basal cytoplasm is shown on the right. n. GI-SIM image of mitochondria (mito-dsRed2) co-orientation with actin cables (Lifeact-EGFP). o. Airyscan images of mitochondria associated with actin cables in live metaphase HeLa cells. p. Mitochondria (anti-Tom20) associated with actin cables (phalloidin) in a metaphase U2OS. q. Mitochondria (anti-Tom20) associated with actin cables (phalloidin) in a metaphase HEK293T. r. Airyscan montage and cartoon of a mitochondrion oscillating between actin cables in the metaphase cytoplasm. s. Raw Airyscan image of mitochondria (Mito-dsRed2) and actin cables (Lifeact-EGFP, arrows) in the deep cytoplasm of a metaphase HeLa (left). Segmented, median-time averaged image of the same region used in Fig. 1d (center). Kymograph indicating an individual mitochondrion oscillating between two neighboring actin cables. t. Representative 44 s trajectory of mitochondria within the actin cable mesh. u. Cumulative squared displacement of mitochondria diffusing within the actin cable meshwork. v. Montage and kymograph of transient mitochondrial co-motility with a local actin cable. w. Cartoon indicating co-motility between a cable and an immediately adjacent (local) mitochondrion. Instantaneous velocity correlation coefficient for actin cables with either local or distal mitochondria. Scale bars: (a, c, e, m left, p) 10 μm, (b,d,q) 5 μm, (m right, q inset) 2.5 μm, (b inset, d inset, f, h, n, o, p inset, r, s, t, v) 1 μm. Sample sizes: (i) 100 cables from 20 cells, (j-k) 28 cells, (l) 46 metaphase cells, 25 anaphase cells, (w) 19 cells. Samples were drawn from at least three independent experiments. Statistical tests: (l, w) two-tailed unpaired t-test ***p<0.0001. Center value/error bars: (i, j, k, l, w) Median ± interquartile range (IQR).
Extended Data Figure 3.
Extended Data Figure 3.. Disruption of the actin cable meshwork impairs metaphase mitochondrial motility and distribution.
a. F-actin (Lifeact-EGFP) and mitochondria (Mito-dsRed2) organization in untreated, Latrunculin A-treated (LatA; 1 μM, 1h), and Cytochalasin D-treated (CytoD; 100nM, 1h) metaphase HeLa cells. Small arrows indicate actin cable network in untreated cells. Large arrows indicate aggregated actin cables in CytoD- treated cell. b. Metaphase HeLa treated with 1 μM LatA for 1h. LatA treatment eliminated subcortical actin structures (Lifeact-EGFP) with minimal effects on cell geometry. White arrowhead indicates region of clumped mitochondria (Mito-dsRed2). Yellow arrows indicate cytoplasmic regions with decreased mitochondrial density. c. Representative metaphase HeLa treated with 100 nM CytoD for 1h. CytoD treatment induced collapse of the meshwork (Lifeact-EGFP) and marked disorganization of actin cables. As with LatA treatment, CytoD treatment induced mitochondrial aggregation (Mito-dsRed2). d. Mean squared displacement (MSD) of 60 s mitochondrial trajectories in untreated, LatA-treated, or CytoD-treated metaphase cells. Log-log Scale bar. e. Velocity autocorrelation at 0.5 s delays (Cv(0.5 s)) for mitochondrial trajectories from untreated, LatA- treated, or CytoD-treated metaphase HeLa cells. f. Discretized velocity autocorrelations of 60 s mitochondrial trajectories in untreated, CytoD-treated, or LatA-treated cells. g. (left) 3D segmentation mask of mitochondria (mito-DsRed2) in a live metaphase HeLa (pseudocolored by z-position). (right) Eroded points derived from the mitochondrial mask with schematic indicating spherical coordinate system with origin at the cell centroid. h. Schematic indicating 3D mitochondrial distribution analyses. i. 3D mitochondrial mean center distance to cell centroid in untreated or CytoD-treated cells. j. Standard deviation of the percent of the mitochondrial network in each of 6 equal sized 3D wedges from control (untreated) or CytoD-treated cells. Wedges were specified by azimuthal values of 0° – 120°, 120° – 240°, and 240° – 360° in either the bottom hemisphere (i.e. elevation −90°– 0°) or the top hemisphere (i.e. elevation 0° – 90°). k. 3D resultant vector length for control (untreated) or CytoD-treated cells. l. Scatter plot of nucleoid radial (y axis) and angular (x axis) positions superimposed on histograms of nucleoid count per 60 ° from DMSO and CytoD treated cell in Fig. 1g. m. Schematic indicating 2D mtDNA nucleoid distribution analyses. n. Example rotational asymmetry traces of nucleoids in a DMSO or LatA-treated metaphase cell. Asymmetry was calculated as the ratio of nucleoids on side A to the total number of nucleoids (A+B) upon rotating the dividing chord by 1° intervals over 360°. o. variance of rotational asymmetry over 360 ° for DMSO, CytoD, or LatA-treated cells. p. Schematic indicating Euclidean and circular nearest neighbor distance analysis for nucleoids. Index of dispersion for ten nearest neighbors of all nucleoid in a cell is reported. q. Index of dispersion of Euclidean nearest neighbor distances between all nucleoids and their ten nearest neighbors in cells treated with DMSO, LatA, or CytoD. r. Index of dispersion of circular nearest neighbor distances between all nucleoids and their ten nearest neighbors in cells treated with DMSO, LatA, or CytoD. s. Mean nucleoid radial position in cells treated with DMSO, CytoD, or LatA t. Mitochondrial nucleoids (PicoGreen) and plasma membrane (Cell Mask Orange) in metaphase A549 cells treated with DMSO (left) or 100 nM CytoD (right). u. Mitochondrial nucleoids (PicoGreen) and plasma membrane (Cell Mask Orange) in metaphase HEK293T cells treated with DMSO (left) or 100 nM CytoD (right). v. Mitochondrial nucleoids (PicoGreen) and plasma membrane (Cell Mask Orange) in metaphase iPS cells treated with DMSO (left) or 100 nM CytoD (right). Scale bars: (b, c, g, t-v) 10 μm, (a) 2.5 μm. Sample sizes: (d-f) 479 control, 232 LatA-treated, and 185 CytoD-treated mitochondria trajectories, (i-k). 26 untreated, 14 CytoD treated cells, (o, q-s) 36 DMSO-treated, 33 LatA-treated, and 35 Cyto-D treated cells. Samples were drawn from at least three independent experiments. Statistical tests: (e,o) Kruskal-Wallis test with Dunn’s multiple comparisons test ***p<0.0001, (i) two-tailed Mann-Whitney test **p=0.0099, (j) two-tailed unpaired t-test ***p<0.0001, (k) two-tailed unpaired t-test ** p=0.0025, (q) two-way RM ANOVA with Dunnet’s multiple comparisons test, neighbor 1: DMSO vs. LatA, p=0.0833, DMSO vs. CytoD *p=0.0288; neighbor 2: DMSO vs. LatA ***p<0.0001, DMSO vs. CytoD ***p=0.0002; neighbor 3: DMSO vs. LatA ***p<0.0001, DMSO vs. CytoD, **p=0.0026; neighbor 4: DMSO vs. LatA ***p<0.0001, DMSO vs. CytoD ***p=0.0004; neighbor 5: DMSO vs. LatA ***p<0.0001, DMSO vs. CytoD ***p=0.0002; neighbors 6–10: DMSO vs. LatA ***p<0.0001, DMSO vs. CytoD ***p<0.0001. (s) Kruskal-Wallis test with Dunn’s multiple comparisons test, DMSO vs. LatA p=0.2294, DMSO vs. CytoD p=0.6893. Center value/error bars: (e,i-k,o,s) Median ± IQR, (q-r) Mean ± SEM.
Extended Data Figure 4.
Extended Data Figure 4.. Disruption of the actin cable meshwork results in metaphase ER collapse.
a. iSIM slice of ER (EGFP-Sec61) and mitochondria (MitoTracker DeepRed) in a prometaphase HeLa. b. iSIM slice of ER (EGFP-Sec61) and mitochondria (MitoTracker DeepRed) in a metaphase HeLa. c. iSIM image of ER (EGFP-Sec61), mitochondria (MitoTracker DeepRed), and actin (Lifeact-mScarlet) with accompanying segmented/masked images. d. Airyscan image of mito-dsRed2 (blue), Halo-Sec61 (gray), and Lifeact-EGFP (orange) in a metaphase HeLa cell with accompanying masked images of actin cables and ER profiles. e. Airyscan montage of ER cisternal collapse after addition of 1 μM LatA. f. Stimulated emission depletion (STED) image of ER (Halo-KDEL) in a metaphase HeLa treated with 100 nM CytoD for 1h. Arrows indicate tightly stacked ER sheets. Asterisk indicates expanded cytoplasmic void between ER sheets. g. Representative analysis workflow for estimating the size of voids between ER sheets. h. Timepoints at 0 and 12 minutes from panel e are shown with void center positions in orange. i. Index of dispersion (variance-to-mean ratio) of areas of cytoplasmic voids from the cell shown in e over 24 minutes. Latrunculin A (1 μM) was added at time 0. j-m. Inter-cisternal ER void size analyses in DMSO or CytoD-treated cells, including mean inter-cisternal void area (j), maximum void area (k), standard deviation of void area (l), and index-of-dispersion of void area (m). n-q. Inter-cisternal ER void center position analyses, including void mean center distance to cell centroid (n), void center resultant vector length (o), standard deviation of void center occupancy per 60° sector (p), and void center radial position (q). r. iSIM image of Lifeact-mScarlet, EGFP-Sec61, and MTDR in a metaphase HeLa treated with CytoD for 1h. Magnified inset is shown in Fig. 1l. s. Representative example of cisternal collapse and mitochondrial confinement in a metaphase HeLa treated with LatA (1μM, 1.5h). t. Airyscan image of the cell from (e) at 20 min showing both ER (Halo-Sec61) and mitochondria (mito-dsRed2). u. Mean distance from void center positions to nearest mitochondria is significantly increased in CytoD-treated cells. v. Cartoon schematic indicating close association between mitochondria (blue) and both ER sheets (gray) and actin cables (orange). Elimination of actin cables by LatA or CytoD results in ER disorganization, characterized by inter-cisternal ER void collapse and expansion, effectively displacing mitochondria from regions of the metaphase cytoplasm. Scale bars: (a,b,e,h,r,s,t) 10 μm, (c,d,f), 5 μm, (a inset, b inset, g, s inset) 2.5 μm. Sample sizes (j-q) 22 DMSO-, and 31 CytoD-treated cells. (u) 16 DMSO-treated, 14 CytoD-treated cells. Samples were drawn from at least three independent experiments. Statistical tests: (j,l,n) two-tailed unpaired t-test ***p<0.0001, (k) two-tailed unpaired t-test ***p=0.0003, (m, u) two-tailed Mann-Whitney test ***p<0.0001, (o) two-tailed unpaired t-test, **p=0.0016 (p) two-tailed unpaired t-test, ***p=0.0002 (q) two-tailed unpaired t-test, p=0.0975. Center values/error bars: (j-q,u) Median ± IQR.
Extended Data Figure 5.
Extended Data Figure 5.. Myosin19 links mitochondria and associated ER membranes to the actin cable meshwork
a. Immunoblot of Myo19 in HeLa cells treated with nontargeting (NT) siRNA or Myo19 siRNA (right). Relative total protein levels were used as a loading control. Knockdown efficiency = 96% based on 3 independent experiments. b. Spinning disk image of mitochondria (mito-dsRed2) and DNA (Hoechst) in fixed metaphase Hela cells treated with NT or Myo19 siRNA. Arrows indicate regions of metaphase cytoplasm devoid of mitochondria.. c. Schematic indicating parameters used for analyses in d and e, including XY center of mitochondrial mass, XY cell centroid, and 60° circle sectors. d. Center of mitochondrial mass displacement from cell centroid in metaphase HeLa cells treated with DMSO (1h), CytoD (100nM, 1h), NT siRNA (40 nM, 48h) or Myo19 siRNA (40nM, 48h). e. Standard deviation of mitochondrial mass per 60° circle sectors in metaphase HeLa cells treated with DMSO (1h), CytoD (100nM, 1h), NT siRNA (40nM, 48h), or Myo19 siRNA (40nM, 48h). f. 3D rendering of mitochondria (mito-dsRed2) and DNA (Hoechst) in cytokinetic HeLa cells treated with NT siRNA. g. 3D rendering of mitochondria (mito-dsRed2) and DNA (Hoechst) in cytokinetic HeLa cells treated with Myo19 siRNA. h. Inheritance index (A/B) of mitochondria in cytokinetic HeLa cells treated with either NT or Myo19 siRNA. Ratio is defined as mitochondrial mass in daughter cell A/daughter cell B, where A = the daughter cell with fewer mitochondria. i. Mitochondria (mito-dsRed2) and actin cables (Lifeact-EGFP) in metaphase HeLa cells treated with NT or Myo19 siRNA. Bottom row shows segmented images of mitochondria and actin cables. White circle indicates a region of the cable meshwork largely devoid of mitochondria. j. Cartoon schematic of mitochondria and actin cables in the cytoplasm of NT siRNA- or Myo19 siRNA- treated metaphase cells. k. Mean distance (μm) from actin cables to the nearest mitochondrial pixel. Median ± IQR. l-m. Airyscan images of mitochondria (Mito-dsRed2) and ER cisternae (Halo-Sec61) in metaphase HeLa cells treated with NT siRNA (l) or Myo19 siRNA (m) for 48h. Arrows indicate collapsed, compacted ER sheets. Asterisks indicate expanded, inter-sheet cytoplasmic voids. Scale bars: (b, f-g, i, l-m ) 10 μm, (l inset, m inset) 5 μm. Sample sizes: (d-e) 17 DMSO, 28 CytoD, 44 NT siRNA, and 19 Myo19 siRNA-treated cells, (h) 29 NT siRNA, 33 Myo19 siRNA-treated cells, (k) 12 NT siRNA, 13 Myo19 siRNA-treated cells. Samples were drawn from at least three independent experiments. Statistical tests: (d) Ordinary one-way ANOVA with Tukey’s multiple comparisons test, DMSO vs. CytoD **p=0.0087, CytoD vs. NT **p=0.0011, NT vs. Myo19 **p=0.0012, DMSO vs. Myo19 **p=0.006, DMSO vs. NT p=0.9962, CytoD vs. Myo19 p=0.975. (e) Ordinary one-way ANOVA with Tukey’s multiple comparisons test ****p<0.0001, DMSO vs. NT p=0.9733, CytoD vs. Myo19 p=0.913. (h) Two-tailed Mann-Whitney test ***p<0.0001. (k) Two-tailed unpaired t-test ***p<0.0001. Center values/error bars = (d,e,h,k) Median ± IQR.. Uncropped/unprocessed scan of the blots in panel a is included in the Source Data file.
Extended Data Figure 6.
Extended Data Figure 6.. Mitochondrial actin waves rapidly cycle through mitotic mitochondrial networks.
a. (top) Spinning disk confocal montage of mitochondria (MitoTrackerDeepRed, MTDR) and F-actin (Lifeact-mScarlet). (bottom) Monochrome montage of Lifeact signal with yellow arrow indicating position of the mitochondrial actin wave. Scale bar = 10 μm. b. 3D kymograph of metaphase actin wave upon subtraction of cortical actin signal. c. Interphase HeLa expressing Lifeact-EGFP and Mito-dsRed2. Insets indicate mitochondria inside or outside of the actin wave (arrows). d. Autocorrelation of interphase actin wave. Mean ± 95% CI. e. Directionality of actin waves. Negative values on the x axis indicate a net counterclockwise bias after 100 min, while positive values indicate a net clockwise bias. f. Fraction of HeLa cells in the indicated stages of mitosis with mitochondrial actin waves. g. Table comparing mitochondrial actin waves described here and previously described revolving actin clusters. h. Representative images of F-actin (Lifeact-EGFP) and mitochondria (mito-dsRed2) in HeLa cells in different stages of mitosis. White arrows indicate position of the actin wave. i. Airyscan image of F-actin (Phalloidin) and peroxisomes (EGFP-SKL) in a fixed, metaphase HeLa cell. Dashed line indicates boundary of the actin wave. Arrows indicate peroxisomes outside of actin clouds. j. Airyscan images of F-actin (Lifeact) and late endosomes (EGFP-Rab7a) in a live, metaphase HeLa cell. Dashed line indicates boundary of the actin wave. Arrows indicate endosomes outside of actin clouds. k. Airyscan images of F-actin (Lifeact) and lysosomes (SiR-Lysosome) in a live, metaphase HeLa cell. Dashed line indicates boundary of the actin wave. Arrows indicate lysosomes outside of actin clouds. l. Airyscan images of F-actin (phalloidin) and ER (Halo-Sec61) in a fixed, metaphase HeLa cell. Dashed line indicates boundary of the actin wave. Arrows indicate ER outside of actin clouds. Scale bars: (a,c,h,i-l) 10 μm, (b center, I inset, j inset, k inset, l inset) 2.5 μm, (c right) 1 μm. Sample sizes: (d) 17 cells, (e) 10 cells, (f) 167 cells. Samples were drawn from at least three independent experiments.
Extended Data Figure 7.
Extended Data Figure 7.. Mitochondria associate with actin cables, clouds, and comet tails in mitosis.
a. Gamma adjusted version of the image shown in Fig. 2h, revealing lower intensity actin cables outside of the wave. Insets show mitochondria outside of the wave associated with actin cables. b. Live metaphase HeLa cell expressing Lifeact-EGFP and mito-dsRed2 with insets indicating position of actin wave and cables. c. Airyscan image of mitochondrial actin clouds within a metaphase actin wave. White dashed line indicates wave border. Insets show mitochondria associated with cables (arrows) outside of the wave. d. Relative phalloidin intensity of actin clouds and actin cables. Values represent the ratio of clouds or cables to cortical actin signal. e. Representative Airyscan images of mitochondrial actin clouds with clipped images showing bright actin nodes on the surface of mitochondria. f. Representative kymographs indicating restricted mitochondrial motility inside of actin clouds. g. Airyscan montage of an actin cloud symmetry breaking event. Arrows indicates a gap forming between adjacent nodes in the cloud preceding mitochondrial ejection. h-i. Representative images of mitochondria associated with actin comet tails in live HeLa cells. j. Airyscan maximum intensity projection of a mitochondrial actin comet tail in a metaphase HeLa. k. Metaphase mitochondrial actin comet tails from the indicated cell types. Arrows indicate trailing comet tails. l. Speed of comet tail-based motility in the indicated cell types. m. Airyscan image of actin (Lifeact-EGFP) and mitochondria (mito-dsRed2) in a metaphase HeLa cell. Montage indicates motility of mitochondria associated with a cloud (top) or comet tail (bottom) over 39 s. n. Airyscan montage of mitochondrial comet tail extension. o. Spinning disk montage of F-actin (Lifeact-EGFP) and mitochondria (mito-dsRed2) upon comet tail assembly and extension. p. Montage of actin comet tail regaining symmetry, forming an actin cloud around the immotile mitochondrion. q. Montage of a mitochondrion (yellow arrow) undergoing comet tail motility resulting in movement out of the imaging plane. r. XZ projection of F-actin (phalloidin), mitochondria (mito-dsRed2), and DNA (Hoechst) in a fixed, metaphase HeLa cell. Inset indicates a mitochondrion associated with an actin comet tail that is oriented primarily in the axial plane. s. 3D trajectory of a comet tail propelled mitochondria from a 3D Airyscan-fast movie. Trajectory is colored by time. t. Actin comet tail parameters estimated from 3D volumes of fixed, phalloidin stained cells. u. Mean speed of mitochondria associated with the indicated actin structures over 25 sec. v. Density estimation of instantaneous speeds of cable, cloud, and comet tail associated mitochondria. w. Speed of comet tails in metaphase HeLa treated with DMSO or 25 μM Nocodazole. x. Three-minute time projection of mitochondria (mito-dsRed2) in a Myo19 siRNA-treated metaphase HeLa cell. Comet tail trajectories are shown in yellow and in the expanded inset. Asterisk indicates regions of cytoplasm unexplored by mitochondria over 3 min. y. Mean squared displacement of cable, cloud, and comet associated mitochondria. MSD plot with cropped Y axis is shown on the right to visualize the reduced cable and cloud motility. z. Velocity autocorrelations of the three types of motility. Cv(0.5 s) values are plotted for mitochondria associated with cables, clouds, comet tails, as well as mitochondria in fixed cells to estimate tracking error. Scale bars: (a,b,c,m,r,x) 10 μm, (a insets, b insets, r inset) 2.5 μm, (c inset, e, f-k, m right, n-q) 1 μm. Sample Size: (d) 16 cells, (l) 233 HeLa, 40 Cos7, 35 A549, 30 HaCaT, 74 HEK293T, (u-v) 59 cables, 59 clouds, 47 comets, (w) 38 DMSO, 61 Nocodazole-treated cells. (y-z) 57 cables, 47 comets, 59 clouds. Samples were drawn from at least three independent experiments. Statistics: (d) two-tailed unpaired t-test ***p<0.0001, (u) Kruskal-Wallis test with Dunn’s multiple comparisons test ***p<0.0001, (w) two-tailed Mann-Whitney test *p=0.011, (z) ordinary one-way ANOVA with Tukey’s multiple comparisons test ***p<0.0001. Center values/error bars: (d) median, (l, t) mean ± SD, (u, w, z right) median ± IQR, (y, z left) mean ± 95% CI.
Extended Data Figure 8.
Extended Data Figure 8.. Mitochondrial actin waves are maintained by multiple actin assembly and disassembly factors.
a. Mitochondrial actin wave area in cells treated with indicated inhibitors. b. Table indicating the drugs used a, as well as their major targets and concentrations/incubation times used. c. Mitochondrial actin wave area in cells treated with indicated siRNA for 48h. d. Knockdown efficiency of siRNAs used in c. Values indicate averages of at least 3 independents experiments. e. Representative western blots indicating knockdown efficiency of siRNAs in c. Full blots are shown in Supplementary Figure 1. Relative total protein levels are indicated below each blot. f. Representative single plane images of actin waves (Lifeact-EGFP) in metaphase HeLa cells treated with the indicated siRNAs. Dashed red line indicates wave boundaries. g. Airyscan single plane image of a HeLa cell expressing EGFP-VASP (white), Lifeact-mScarlet, (red), and Mito-TagBFP2 (blue). Yellow arrows indicate position of VASP puncta on the actin cloud. h. Airyscan image of VASP association with a mitochondrion (Mito-TagBFP2) within an actin cloud (Lifeact- mScarlet). (right) Normalized fluorescence intensity of Mito, VASP, and Lifeact along the 1px linescan indicated by the dashed line. i. Metaphase Hela cells expressing Lifeact-mScarlet, Filamin A-EGFP, and MitoTracker DeepRed. j. Fixed, anaphase HeLa cell stained for Filamin A (cyan) and F-actin (phalloidin, orange). k. Spinning disk confocal median time projection (over 30 seconds) indicating Cortactin-EGFP colocalization with Lifeact-mScarlet in a metaphase actin wave. l. Median intensity time projection of Lifeact-mScarlet/Cortactin-EGFP colocalization in an actin cloud in a metaphase HeLa cell. m. Spinning disk confocal images of fixed HeLa cells stained for mitochondria (anti-Tom20), cortactin (anti-cortactin), and F-actin (Phalloidin). White arrows indicate asymmetric, punctate localization of cortactin around actin positive mitochondria. (right) Normalized fluorescence intensity of f-actin (phalloidin), Tom20, and Cortactin along the 1px wide line scan. n. Colocalization of Alpha Actinin (Alpha Actinin-mNeonGreen) and F-actin (LifeAct-mScarlet) in a metaphase HeLa cell. (right) Kymograph of LifeAct and alpha-actinin generated from indicated line scan (dashed line). Scale bars: (f, i, j-k, n) 10 μm, (g, l) 5 μm, (g inset, e, l inset, m) 1 μm. Sample sizes: (a, c) Number of cells per condition is indicated above each boxplot. Samples are drawn from at least 3 independent experiments. Statistical tests: (a) Kruskal-Wallis test with Dunn’s multiple comparisons test ***p<0.0001, DMSO vs. C3 Transferase p=0.7515, DMSO vs. Rhosin p<0.9999, (b) Kruskal-Wallis test with Dunn’s multiple comparisons test ***p<0.0001, NT vs. WASH1 p>0.9999, NT vs. WAVE1 p=0.6079, NT vs. WHAMM p=0.0766, NT vs. N-WASP p>0.9999, NT vs. Myo19 p>0.9999, NT vs. MyoVa p>0.9999. Center values/error bars: Box = Median ± IQR, whiskers indicate 10–90% values, plus-sign indicates mean. Uncropped/unprocessed scans of the blots are included in the Source Data file.
Extended Data Figure 9.
Extended Data Figure 9.. Arp3 depletion eliminates actin comet tail-based mitochondrial motility but does not impair mitochondrial positioning or equal inheritance.
a. Frequency of mitochondrial comet tail-based motility over 1 min in metaphase Hela cells treated with NT or Arp3 siRNA. Median ± IQR. n = 11 NT siRNA-treated cells, 11 Arp3 siRNA treated cells from at least three independent experiments. b. (Left) 3 frame median intensity time projection of actin cables (Lifeact-EGFP) and mitochondria (mito- dsRed2) in an Arp3 depleted metaphase HeLa cell. (Right) Time-coded maximum intensity projection of segmented actin cables over 178 seconds. c. Airyscan image of mitochondria (mito-dsRed2) associated with actin cables (Lifeact-EGFP) in an Arp3 siRNA treated metaphase HeLa cell. Kymographs shows mitochondria/cable motility over ~ 2 min. d. Single plane airyscan image of mitochondria (mito-dsRed2) in an NT siRNA-treated (left) or Arp3 siRNA- treated (right) metaphase HeLa. e. Center of mitochondrial mass displacement from cell centroid in cells treated with NT or Arp3 siRNA. Note: the NT data is reproduced from Extended data figure 5e. n = 44 NT, 38 Arp3 from at least three independent experiments. f. Standard deviation of mitochondrial percent occupancy per 60° sector in cells treated with NT or Arp3 siRNA. N. g. Origin aligned trajectories for 150 mitochondria over 60 seconds. Control trajectories were taken from outside of the actin wave in untreated cells. Arp3 siRNA trajectories are taken from random positions in the cell. h. Single plane cumulative maximum intensity projections of mitochondria (mito-dsRed2) in NT or Arp3 siRNA treated metaphase HeLa cells.. i. Percentage of cell area covered by mitochondria per min in NT or Arp3 siRNA treated metaphase HeLa cells. j. Displacement index of mitochondria in NT or Arp3 siRNA treated HeLa cells. Displacement index is calculated by dividing mito-dsRed2 area in 5 min maximum intensity time projections by the area of mito- dsRed2 in the first frame. k. Mitochondria (mito-dsRed2) and ER (Halo-Sec61) in an Arp3 siRNA treated HeLa cell. l. Equal mitochondrial inheritance in an Arp3 siRNA treated HeLa cell undergoing cytokinesis. Dashed line indicates division plane. m. Inheritance ratio (A/B) of metaphase HeLa cells treated with NT or Arp3 siRNA. Note: NT siRNA data is reproduced from Extended data figure 5. Ratio is defined as mitochondrial mass in daughter cell A/daughter cell B, where A = the daughter cell with fewer mitochondria. n. Change in distance between pairs of neighboring mitochondria after 5 min in a NT or Arp3 siRNA-treated metaphase HeLa cell. Scale bars: (h, k, l) 10 μm, (d) 5 μm, (c, k inset) 2.5 μm, (b) 1 μm, (g) 500nm. Sample sizes: (e) The NT data is reproduced from Extended Data Fig 5e. 44 NT, 38 Arp3 siRNA-treated cells from at least three independent experiments. (f) The NT data is reproduced from figure S5E. 44 NT, 38 Arp3 siRNA-treated cells from at least three independent experiments (i-j) 38 NT, 33 Arp3 siRNA-treated cells (m) 29 NT siRNA, 14 Arp3 siRNA treated cells. (n) Change in neighbor distance was calculated on one NT siRNA and one Arp3 siRNA treated cell. Statistical tests: (i-j) two-tailed unpaired t-test, ***p<0.0001. Center values/error bars: (a,e,f,I,j,m) median ± interquartile range.
Extended Data Figure 10.
Extended Data Figure 10.. Actin waves shuffle mitochondrial position before cytokinesis.
a-b. Airyscan maximum intensity projections of (a) NT siRNA- or (b) Arp3 siRNA-treated metaphase HeLa cell expressing mito-paGFP and mito-KR. White box indicates region irradiated with 405nm and 561nm light to simultaneously bleach Mito-KR and activate Mito-paGFP. c. Computationally straightened montage of mito-paGFP dispersion in NT or Arp3 siRNA-treated cells d. Mean rotational asymmetry of damaged mitochondria in NT or Arp3 siRNA-treated cells at 0 and 20 min after photoactivation. e. Displacement of damaged, mito-paGFP-labeled mitochondria center of mass per min in NT or Arp3 siRNA treated cells. f. Spinning disk maximum intensity projection of mito-paGFP and mito-KR in metaphase HeLa cells treated with DMSO (left) or CK-666 (right). White boxes indicate regions irradiated with 405nm and 561nm light to simultaneously bleach Mito-KR and activate Mito-paGFP. g. Airyscan maximum intensity projection of an Arp3 siRNA treated metaphase HeLa cell expressing Mito-paGFP and Lifeact-mScarlet. White box indicates region irradiated with 405nm light to activate Mito-paGFP. h. Circular kernel density estimate of Mito-paGFP position over 40 minutes. Dashed line indicates midpoint of the photoactivation region at time 0. i. Airyscan image of MFN1/MFN2 siRNA treated interphase HeLa cell expressing Lifeact-EGFP (orange) and mito-dsRed2 (blue). Dashed line indicates position of the actin wave. Inset shows actin positive mitochondria within the wave. j. Airyscan image of fragmented, morphologically simple mitochondria in interphase HeLa cells treated with MFN1/MFN2 siRNA. k. Metaphase actin wave (black arrow) persist upon simultaneous depletion of the mitochondrial fusion factors MFN1/MFN2. l. Representative example of actin comet tail based mitochondrial movements in a metaphase MFN1/MFN2 siRNA treated HeLa. m. Airyscan maximum intensity projections of a MFN1/MFN2 siRNA treated metaphase HeLa cell expressing Mito-Dendra2. White box indicates region irradiated with 405nm light to photoconvert the Dendra2. Over 21 min the photoactivated mitochondria are dispersed through the cell. n. Circular kernel density estimates of Mito-Dendra2 distribution over 21 minutes, indicating increased dispersion of the photoconverted mitochondria over time. o. Histogram indicating simulated damaged mitochondrial dispersion over 30 minutes. Gray boxes indicate net mitochondrial angle change in simulations with actin waves, red boxes indicate net angle change in simulations without waves. p. Estimated cumulative density of damaged mitochondria angle change over 30 minutes in simulations with different sized actin waves. q. Estimated cumulative density of damaged mitochondria angle change over 30 minutes in simulations with different speed actin comet tails. r-s. Percentage of damaged (orange) and total (gray) mitochondria inherited by daughter cell B over 30 minutes in simulations with variable wave sizes or actin comet tail speed. Mean ± 95% CI. Scale bars: (a,b,f,g,i,m) 10 μm, (i inset, j) 5 μm, (l) 1 μm. Sample sizes: (d-e) 13 NT siRNA, 14 Arp3 siRNA treated cells. Samples are drawn from at least 3 independent experiments. Statistical tests: (d) Two-way RM ANOVA with Sidak’s multiple comparisons test. NT vs. Arp3 at 0 min, p=0.9927, NT vs. Arp3 at 20 min, ***p=0.0006. (e) Two-tailed unpaired t-test, **p=0.0013. Central values/error bars: (e) median ± interquartile range.
Figure 1:
Figure 1:. A subcortical actin meshwork scaffolds mitochondria and ER in mitosis
a. Gamma adjusted (0.5) maximum intensity projection of a phalloidin-labeled metaphase HeLa cell. Inset highlights the cytoplasmic actin cable meshwork. b. Tom20-labeled mitochondria align with neighboring phalloidin-stained actin cables (arrows). c. Local co-orientation of mitochondria and neighboring cables is lost upon 90° rotation of mitochondrial image. d. Time series of mitochondria and segmented cables with psuedocolored time-projection indicating cable movement. e. Origin-aligned 60 sec trajectories of 150 mitochondria from untreated, LatA-treated, or CytoD-treated metaphase cells. f. Representative renderings of mitochondria color-coded in z in untreated or CytoD-treated metaphase HeLa cells; full-cell and half-cell views also shown. g. PicoGreen staining of mtDNA nucleoids in DMSO- or CytoD-treated metaphase cells, with polar histograms indicating angular distribution. h. Distance from nucleoid mean center position to cell centroid is increased upon actin cable disruption. i-j. Standard deviation of nucleoid percentage per 60° sector (i) and mean resultant vector length of nucleoid circular distribution (j) increase upon cable disruption. Red lines indicate values from simulations of uniformly positioned nucleoids. k. ER (Halo-Sec61b) and mitochondrial networks (MitoTracker) in metaphase HeLa treated with DMSO or CytoD. Asterisk indicates expanded inter-cisternal voids. l. Metaphase cable disruption induces stacked, collapsed ER sheets (EGFP-Sec61, white arrow) and expanded inter-sheet voids (asterisks) that both exclude mitochondria (MitoTracker, blue arrowhead). m. Mitochondria (Mito-dsRed2) in untreated or CytoD-treated (100 nM) telophase HeLa cells. Dashed line indicates cleavage plane. n. Mitochondrial inheritance ratio is decreased in CytoD-treated cells. Scale bar: (a, k, m) 10 μm, (q, f) 5 μm, (a inset, b, k inset, l) 2.5 μm, (d) 1 μm, (e) 0.5 μm. Sample size: (c) 19 cells, (h-j) 36 DMSO-, 33 LatA-, 35 CytoD-treated cells, (n) 22 control, 29 CytoD-treated cells. All samples were drawn from at least three independent experiments. Statistical tests: (c) two-tailed Mann-Whitney test, ***p=0.0005, (h-j) Ordinary one-way ANOVA with Dunnett’s multiple comparisons test, ***p<0.0001, (n) two-tailed unpaired t-test, ***p=0.0008. Center values/error bars: median ± interquartile range.
Figure 2:
Figure 2:. Mitochondrial actin clouds break symmetry to form elongated comet tails.
a. Lattice light-sheet rendering of Mito-dsRed2 and Lifeact-EGFP in a metaphase HeLa cells, with 3D segmentation of the mitochondrial actin wave over ~5 min. b-c. Actin wave period (b) and rotational speed (c) in interphase and metaphase. d-e. Kinetics of actin wave assembly and disassembly in interphase (d) or metaphase (e) cells. f. Autocorrelation analysis of metaphase actin waves. g. Directionality of metaphase actin waves. h. Airyscan image of a fixed, phalloidin/Tom20 stained prometaphase HeLa cell with magnified insets of actin assembly on mitochondria. i. Live, metaphase HeLa expressing Lifeact-EGFP and Mito-dsRed2 with magnified inset of a mitochondrial actin cloud. j. Representative mitochondrial actin clouds. k. Time series of actin cloud assembly on a mitochondrion. Arrows indicate actin nodes. l. Trajectory of a cloud associated mitochondrion. m. Time series of actin cloud disassembly. Arrows indicate actin nodes. n. Percentage of clouds that disassemble, move out-of-plane, or break symmetry to form a comet tail. o. Mitochondrial cloud-to-comet tail transition. Arrows: mitochondrial position, asterisks: symmetry breaking event. p. Mitochondrial actin wave with inset showing mitochondrial actin comet tail (arrows). q-r. Representative actin comet tails driving directed mitochondrial movements (arrows). s. Mitochondrial comet tail with associated trajectory over 30 sec. t. Percentage of motile mitochondria in metaphase cells with either clear, indeterminate, or absent comet tails. u. Direction change between each step of mitochondrial comet tail trajectories. v. Schematic illustrating mitochondrial comet tail morphologies observed. w. Comet tail-driven mitochondrial trajectories in metaphase HeLa. x. Percentage of comet tail-based mitochondrial trajectories oriented with or against the direction of the actin wave. y. Origin aligned trajectories of cable, cloud, and comet tail-associated mitochondria over 25 sec. z. Net displacement of mitochondria associated with each actin structure over 25 sec. Scale bar: (a, h, i, p) 10 μm, (w) 5 μm, (h inset) 2.5 μm, (y) 2 μm, (i inset,j,k,m,o, p inset, q,r,s) 1 μm, (h inset 2) 500 nm, (l) 250 nm. Sample size: (b) 41 interphase/37 metaphase cells, (v) 47 comet tails, (z) 59 cables, 47 clouds, 59 comet tails. All samples were drawn from at least three independent experiments. Error bars: (b,c,z) median ± interquartile range, (d,e,f) mean ± 95%CI. Statistical tests: (b,c) two-tailed unpaired t-test, ***p<0.0001, (z) Kruskal-Wallis test with Dunn’s multiple comparisons test, ***p<0.0001.
Figure 3:
Figure 3:. Actin waves disperse clusters of damaged mitochondria.
a. Time series of mito-KillerRed (mito-KR) and mito-photoactivatable GFP (mito-paGFP) expressing metaphase HeLa cells treated with either NT siRNA (top) or Arp3 siRNA (bottom). Boxes identify regions irradiated with 405nm and 561nm light to simultaneously bleach mito-KR and activate mito-paGFP to focally damage and label the same organelle subpopulation. b. Representative circular density estimations of damaged mitochondria distribution over time in a NT siRNA-treated (top) or Arp3 siRNA-treated (bottom) metaphase cells. Dashed line indicates mean angular position of damaged mitochondria at 0 min. c. Rotational asymmetry plots of damaged mitochondria in NT (top) or Arp3 (bottom) siRNA-treated metaphase cells. See methods for details. d. Resultant vector length of damaged mitochondria over time in NT or Arp3 siRNA-treated HeLa cells with linear regression lines. e. Bounding area of damaged mitochondria in NT or Arp3 siRNA treated metaphase cells. f. Schematic indicating parameters used for simulation. g. (Left) Experimentally derived change in dispersion of damaged mitochondria in NT or Arp3 siRNA-treated cells between 0 and 15 min. (Right) Simulated change in dispersion of damaged mitochondria over 15 min in the presence or absence of actin waves. h-i. Cumulative density estimations of net angular displacement of damaged mitochondria over time in simulations with (h) or without (i) actin waves. j-k. Percentage of damaged and total mitochondria inherited by daughter cell B in simulations with (j) or without (k) actin waves. l-m. Timeseries of mito-KR/mito-paGFP in cells treated with NT siRNA (l) or Arp3 siRNA (m). Dashed line indicates cleavage plane, arrows indicate damaged mitochondria inherited by cell B. Scale bars: (a,l,m) 10 μm. Sample size: (d) 13 NT, 15 Arp3, (e, g) 15 NT, 15 Arp3. All samples were drawn from at least three independent experiments. Statistical tests: (d) Slopes significantly unequal, extra sum-of-squares F Test, ***p<0.0001, (g) two-tailed Mann-Whitney test, ***p<0.0001. Error bars: (g) Box=median ± IQR; whiskers=10–90%; +=mean, (j) Mean ± 95% C.I.

Comment in

Similar articles

Cited by

References

    1. Carlton JG, Jones H & Eggert US Membrane and organelle dynamics during cell division. Nat Rev Mol Cell Bio 21, 151–166 (2020). - PubMed
    1. Taguchi N, Ishihara N, Jofuku A, Oka T & Mihara K. Mitotic Phosphorylation of Dynamin-related GTPase Drp1 Participates in Mitochondrial Fission. Journal of Biological Chemistry 282, 11521–11529 (2007). - PubMed
    1. Kashatus DF et al. RALA and RALBP1 regulate mitochondrial fission at mitosis. Nature Cell Biology 13, 1108 (2011). - PMC - PubMed
    1. Chung J, Steen J & Schwarz T. Phosphorylation-Induced Motor Shedding Is Required at Mitosis for Proper Distribution and Passive Inheritance of Mitochondria. Cell Reports 16, 2142–2155 (2016). - PMC - PubMed
    1. Altmann K, Frank M, Neumann D, Jakobs S & Westermann B. The class V myosin motor protein, Myo2, plays a major role in mitochondrial motility in Saccharomyces cerevisiae. The Journal of cell biology 181, 119–30 (2008). - PMC - PubMed

Additional references:

    1. Stewart JB & Chinnery PF Extreme heterogeneity of human mitochondrial DNA from organelles to populations. Nat Rev Genet 1–13 (2020) doi:10.1038/s41576-020-00284-x. - DOI - PubMed
    1. Fernandopulle MS et al. Transcription Factor-Mediated Differentiation of Human iPSCs into Neurons. Curr Protoc Cell Biology 79, e51 (2018). - PMC - PubMed
    1. Simpson CL, Kojima S & Getsios S. RNA interference in keratinocytes and an organotypic model of human epidermis. Methods in molecular biology (Clifton, N.J.) 585, 127–46 (2010). - PubMed
    1. Xu K, Zhong G & Zhuang X. Actin, spectrin, and associated proteins form a periodic cytoskeletal structure in axons. Sci New York N Y 339, 452–6 (2012). - PMC - PubMed
    1. Chozinski TJ et al. Expansion microscopy with conventional antibodies and fluorescent proteins. Nature Methods 13, 485–488 (2016). - PMC - PubMed

Publication types