. 2021 Mar 3;12(3):228.
doi: 10.1038/s41419-021-03536-8.

WW domain-binding protein 2 overexpression prevents diet-induced liver steatosis and insulin resistance through AMPKβ1

Affiliations

WW domain-binding protein 2 overexpression prevents diet-induced liver steatosis and insulin resistance through AMPKβ1

Zhe Zheng et al. Cell Death Dis. .

Abstract

Nonalcoholic fatty liver disease (NAFLD) is prevalent clinically and can lead to more serious chronic liver disease. However, the pathological mechanism is still unclear, and thus, there are no approved drugs on the market. Transcriptional coactivator WW domain-binding protein 2 (WBP2) is a newly discovered oncogene that has an important relationship with the occurrence and development of breast cancer and mediates the interaction between Wnt and various other signaling pathways. The expression level of WBP2 was decreased in NAFLD. Overexpression of WBP2 with AAV in vivo alleviated liver fat deposition and insulin resistance induced by a high-fat diet (HFD). Knockdown of WBP2 with AAV aggravated HFD-induced fatty liver and insulin resistance. In vitro experiments showed that in the human normal hepatocyte cell line LO2 and primary hepatocytes isolated from mice, overexpression of WBP2 reduced fat deposition, and knocking out or knocking down WBP2 aggravated PA-induced fat deposition. Through mass spectrometry, we found that WBP2 can bind to AMPKβ1, and by mutating AMPKβ1, we found that WBP2 can induce phosphorylation of AMPKβ1 at S108 and then activate the AMPK pathway to affect lipid metabolism. The effect of WBP2 on NAFLD provides a possible new direction for future research on NAFLD.


Conflict of interest statement

The authors declare no competing interests.

Figures
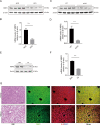
Fig. 1
Fig. 1. WBP2 is downregulated in livers with hepatic steatosis.
A, B The representative protein (A) and mRNA (B) levels of WBP2 in the livers of the mice subjected to an HFD and an NCD for 16 weeks (n = 8/group). C, D Representative protein (C) and mRNA (D) levels of WBP2 in the livers of the WT or ob/ob mice (n = 8/group). E, F The primary hepatocytes isolated from the livers of wild-type mice was stimulated with PA (0.25 mM) for 24 h, and WBP2 expression was examined by western blots (E) and RT-PCR (F) (n = 3 independent experiments). The protein and mRNA expression levels were normalized to the β-actin levels. G Representative images of H&E staining and immunofluorescence staining for WBP2 (green), ALB (red) and DAPI (blue) in the liver samples from mice fed an HFD or an NCD for 16 weeks (n = 8/group). Scale bar, 100 μm. Data are expressed as the mean ± SEM, ***P < 0.001.
Fig. 2
Fig. 2. The effect of WBP2 on lipid deposition in primary hepatocytes stimulated by PA.
A, C A WBP2-overexpressing cell line (A) and a WBP2 knockout cell line (C) were established in LO2 cells. The protein expression of WBP2 was tested by western blot analysis. B Representative photomicrographs with Nile red staining are shown for the control and WBP2-overexpressing cells exposed to PA (0.25 mM) for 12 h. D Representative photomicrographs with Nile red staining are shown for the WT and WBP2 KO cells exposed to PA (0.25 mM) for 12 h. The Nile red-stained area was quantified by ImageJ software. Scale bar, 100 μm. Data are expressed as the mean ± SEM, ***P < 0.001.
Fig. 3
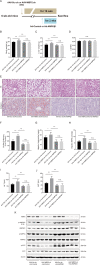
Fig. 3. Overexpression of WBP2 alleviates HFD-induced hepatic steatosis and insulin resistance.
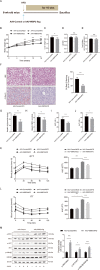
A Schedule of WBP2 overexpression. Six-week-old mice were injected with AAV-Control (as a control) or AAV-WBP2 Flag (overexpressing WBP2) via the tail vein. B Body weight, C liver weight, D LW/BW, and E food intake of the AAV-Control mice and the AAV-WBP2 mice (n = 8/group). F Representative images of H&E and Oil red O staining of liver tissues from the AAV-Control mice and the AAV-WBP2 mice fed an HFD for 16 weeks. Scale bar, 100 μm. G, H Triglyceride, NEFA, and I, J ALT and AST levels in the livers of the AAV-Control mice and the AAV-WBP2 mice fed an HFD for 16 weeks (n = 8/group). K, L Intraperitoneal glucose tolerance tests (GTTs; 1 g/kg) (K) and intraperitoneal insulin tolerance tests (ITTs; 0.75 U/kg) (L) were performed on the AAV-Control mice and the AAV-WBP2 mice at the 16th week of food administration. The corresponding area under the curve (AUC) of the blood glucose level was calculated (n = 8/group). M Representative western blot analysis (n = 3 western blots for each band) of phosphorylated (p-) and total IRS1, AKT, and GSK3β expression in the livers of the AAV-Control mice and the AAV-WBP2 mice fed an HFD for 16 weeks that received insulin treatment (n = 2 mice in each group without insulin injection; n = 6 mice in each group with insulin injection). Data represent the mean ± SEM, *P < 0.05, **P < 0.01, ***P < 0.001 and n.s. indicates no significance between the two indicated groups.
Fig. 4
Fig. 4. WBP2 knockdown aggravates HFD-induced hepatic steatosis and insulin resistance.
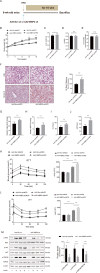
A Schedule of WBP2 knockdown. Six-week-old mice were injected with AAV-Scr sh (as a control) or AAV-WBP2 sh (knockdown WBP2) via the tail vein. B Body weight, C liver weight, D LW/BW, and E food intake of the AAV-Scr sh mice and the AAV-WBP2 sh mice (n = 8/group). F Representative images of H&E and Oil red O staining of liver tissues from the AAV-Scr sh mice and the AAV-WBP2 sh mice fed an HFD for 16 weeks. Scale bar, 100 μm. G, H Triglyceride, NEFA, and I, J ALT and AST levels in the livers of the AAV-Scr sh mice and the AAV-WBP2 sh mice fed an HFD for 16 weeks (n = 8/group). K, L Intraperitoneal glucose tolerance tests (GTTs; 1 g/kg) (K) and intraperitoneal insulin tolerance tests (ITTs; 0.75 U/kg) (L) were performed on the AAV-Scr sh mice and the AAV-WBP2 sh mice at the 16th week of food administration. The corresponding area under the curve (AUC) of the blood glucose level was calculated (n = 8/group). M Representative western blot analysis (n = 3 western blots for each band) of phosphorylated (p-) and total IRS1, AKT, and GSK3β expression in the livers of the AAV-Scr sh mice and the AAV-WBP2 sh mice fed an HFD for 16 weeks that received insulin treatment (n = 2 mice in each group without insulin injection; n = 6 mice in each group with insulin injection). Data represent the mean ± SEM, *P < 0.05, **P < 0.01, ***P < 0.001 and n.s. indicates no significance between the two indicated groups.
Fig. 5
Fig. 5. WBP2 could bind to AMPKβ1 and enhance the AMPK pathway in the liver.
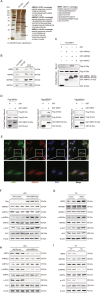
A Silver-stained gel of the indicated proteins binding to WBP2, which were coimmunoprecipitated using an anti-WBP2 antibody and identified via mass spectrometry (MS) in LO2 cells. IgG was used as a control. B Immunoprecipitation and western blot assays using anti-WBP2, anti-AMPKα, anti-AMPKβ1, and anti-AMPKγ1 to detect the binding of AMPKα, AMPKβ1, and AMPKγ1 to WBP2 in LO2 cells. IgG was used as a control. C, D GST precipitation assays using anti-GST and anti-Flag to detect the direct binding of WBP2 and AMPKβ1. Purified GST was used as a control. E WBP2 colocalized with AMPKβ1. Immunofluorescence staining for WBP2 (green), AMPKβ1 (red), and DAPI (blue) in LO2 cells. Scale bar, 20 μm. F Western blot assays were performed in liver tissues from the AAV-WBP2 mice and the AAV-control mice fed an HFD for 16 weeks to detect the expression of AMPKβ1, AMPKγ1, AMPKα, p-AMPKα, ACC, and p-ACC. Anti-Flag was used to detect the expression of exogenous WBP2, and β-actin served as the loading control. G Western blot assays were performed in the PA-treated LO2 cells transfected with WBP2 or control to detect the expression of AMPKβ1, AMPKγ1, AMPKα, p-AMPKα, ACC, and p-ACC. β-actin served as loading control. H Western blot assays were performed in liver tissues from the AAV-Scr sh mice and the AAV-WBP2 sh mice fed an HFD for 16 weeks to detect the expression of AMPKβ1, AMPKγ1, AMPKα, p-AMPKα, ACC, and p-ACC. β-actin served as the loading control. I Western blot assays were performed in the PA-treated wild-type (WT) or WBP2-knockout (KO) LO2 cells to detect the expression of AMPKβ1, AMPKγ1, AMPKα, p-AMPKα, ACC, and p-ACC. β-actin served as loading control.
Fig. 6
Fig. 6. The impact of WBP2 on AMPK is mediated by the phosphorylation of AMPKβ1 at Ser108.
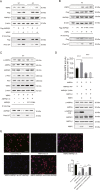
A Western blot assays using anti-WBP2 and anti-Flag to detect the expression of WBP2 and exogenous AMPKβ1 in WBP2 wild-type (WT) and WBP2 knockout (KO) LO2 cells. β-actin served as loading control. Immunoprecipitation assays using anti-Flag and western blot assays using anti-phospho-(Ser/Thr) (Phos S/T) to detect the phosphorylation of AMPKβ1. B Western blot assays using anti-WBP2 and anti-Flag to detect the expression of WBP2 and exogenous AMPKβ1 (including wild-type (WT) or Ser108 mutated to Ala108 (S108A) plasmids) in the WBP2 knockout (KO) LO2 cells. β-actin served as the loading control. Immunoprecipitation assays using anti-Flag and western blot assays using anti-phospho-(Ser/Thr) (Phos S/T) were used to detect the phosphorylation of AMPKβ1. C Western blot assays were performed to detect the expression of AMPKα, p-AMPKα, ACC, and p-ACC in the WBP2 WT cells with or without WBP2 overexpression, with or without AMPKβ1 siRNA, and with or without AMPKβ1 WT or with the Ser108 to Ala108 mutation (S108A); anti-WBP2 was used to detect the expression of WBP2, and β-actin served as the loading control. Immunoprecipitation assays using anti-Flag and western blot assays using anti-phospho-(Ser/Thr) (Phos S/T) to detect the phosphorylation of AMPKβ1. D Relative AMPK complex activity compared with the wild-type AMPK complex was measured by the ADP-GloTM kit according to the generation of ADP. Purified AMPK subunits and WBP2 were incubated. Part of the mixture was used to measure luminescence, and western blot assays were used to detect the phosphorylation of AMPKα and AMPKβ. E Representative photomicrographs with Nile red staining are shown for the WBP2 WT cells with or without WBP2 overexpression, with or without AMPKβ1 siRNA, and with or without AMPKβ1 WT or S108A exposed to PA (0.25 mM) for 12 h. The Nile red-stained area was quantified by ImageJ software. Scale bar, 100 μm. Data are expressed as the mean ± SEM, ***P < 0.001 between the two indicated groups.
Fig. 7
Fig. 7. AMPKβ1 reversed the phenotype induced by WBP2 knockdown.
A Schedule of manipulating the expression of AMPKβ1. Six-week-old mice were injected with AAV-Scr sh (as a control) or AAV-WBP2 sh (knockdown WBP2) via the tail vein and fed an HFD. Ad-Control or Ad-AMPKβ1 was injected at the 14th week after HFD feeding, and the mice above were sacrificed 2 weeks later. B Body weight, C liver weight, and D LW/BW of the mice from the indicated groups (n = 8/group). E, F Representative images of H&E and Oil red O staining of liver tissues from the mice from the indicated groups. Scale bar, 100 μm. G, H Triglyceride, NEFA, and I, J ALT and AST levels in the livers of the mice from the indicated groups fed an HFD for 16 weeks (n = 8/group). K Western blot assays were performed to detect the expression of WBP2, p-AMPKβ1, AMPKβ1, p-AMPKα, AMPKα, p-ACC, and ACC in the livers of the mice from the indicated groups. β-actin served as the loading control. Data represent the mean ± SEM, *P < 0.05, **P < 0.01, ***P < 0.001 and n.s. indicates no significance between the two indicated groups.
Fig. 8
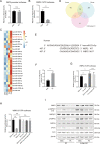
Fig. 8. PA influenced WBP2 expression by upregulating miR-27a-5p.
A LO2 cells were transfected with the WBP2 promoter reporter plasmid and treated with BSA or PA. The luciferase activity was analyzed (n = 5 per group). B The WBP2-3′-UTR reporter plasmid was transiently transfected into LO2 cells and stimulated as indicated. The luciferase reporter assay was analyzed (n = 5 per group). C Heat maps showing the changes in the expression of DEGs involved in microRNA upregulation by PA treatment. The color bar shows the gradient of the log2-fold changes in microRNA expression levels in the PA-treated samples relative to those in the BSA-treated samples. D MicroRNAs targeting the 3’-UTR of WBP2 in humans and mice were predicted using multiple databases. A Venn diagram was constructed with the upregulated miRNAs in the heatmap, the intersection was identified, and miR-27a-5p was discovered. E Binding site of miR-27a-5p on the 3’-UTR of WBP2 in human. F The relative expression of miR-27a-5p between BSA- and PA-treated LO2 cells. G The WBP2-3′-UTR reporter plasmid was transfected into LO2 cells with miR-27a-5p antagomir and stimulated with PA or BSA. The luciferase reporter assay was performed (n = 5 per group). H Wild-type or mutated WBP2 3’-UTR reporters were transfected into LO2 cells with or without miR-27a-5p and stimulated with PA or BSA. The luciferase reporter assay was performed (n = 5 per group). I Wild-type or mutated WBP2 3’-UTR reporters were transfected into LO2 cells with or without miR-27a-5p and stimulated with PA or BSA. Western blot assays were performed to detect the expression of WBP2, p-AMPKβ1, AMPKβ1, p-AMPKα, AMPKα, and p-ACC and ACC, and β-actin served as a loading control. Data represent the mean ± SEM, **P < 0.01, ***P < 0.001 and n.s. indicates no significance between the two indicated groups.

Similar articles

Cited by

References

    1. Kosmalski M, Mokros L, Kuna P, Witusik A, Pietras T. Changes in the immune system—the key to diagnostics and therapy of patients with non-alcoholic fatty liver disease. Cent. Eur. J. Immunol. 2018;43:231–239. doi: 10.5114/ceji.2018.77395. - DOI - PMC - PubMed
    1. Younossi Z, et al. Global burden of NAFLD and NASH: trends, predictions, risk factors and prevention. Nat. Rev. Gastroenterol. Hepatol. 2018;15:11–20. doi: 10.1038/nrgastro.2017.109. - DOI - PubMed
    1. Yao H, et al. Herbal medicines and nonalcoholic fatty liver disease. World J. Gastroenterol. 2016;22:6890–6905. doi: 10.3748/wjg.v22.i30.6890. - DOI - PMC - PubMed
    1. Golabi, P., et al. Liver transplantation (LT) for cryptogenic cirrhosis (CC) and nonalcoholic steatohepatitis (NASH) cirrhosis. Medicine97, e11518 (2018). - PMC - PubMed
    1. Carling D. The AMP-activated protein kinase cascade—a unifying system for energy control. Trends Biochem. Sci. 2004;29:18–24. doi: 10.1016/j.tibs.2003.11.005. - DOI - PubMed

Publication types

MeSH terms