Major oscillations in spontaneous home-cage activity in C57BL/6 mice housed under constant conditions
- PMID: 33654141
- PMCID: PMC7925671
- DOI: 10.1038/s41598-021-84141-9
Major oscillations in spontaneous home-cage activity in C57BL/6 mice housed under constant conditions
Abstract
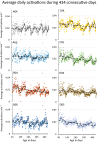
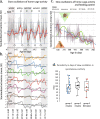
The mouse is the most important mammalian model in life science research and the behavior of the mouse is a key read-out of experimental interventions and genetic manipulations. To serve this purpose a solid understanding of the mouse normal behavior is a prerequisite. Using 14-19 months of cumulative 24/7 home-cage activity recorded with a non-intrusive technique, evidence is here provided for a highly significant circannual oscillation in spontaneous activity (1-2 SD of the mean, on average 65% higher during peak of highs than lows; P = 7E-50) of male and female C57BL/6 mice held under constant conditions. The periodicity of this hitherto not recognized oscillation is in the range of 2-4 months (average estimate was 97 days across cohorts of cages). It off-sets responses to environmental stimuli and co-varies with the feeding behavior but does not significantly alter the preference for being active during the dark hours. The absence of coordination of this rhythmicity between cages with mice or seasons of the year suggest that the oscillation of physical activity is generated by a free-running intrinsic oscillator devoid of external timer. Due to the magnitude of this rhythmic variation it may be a serious confounder in experiments on mice if left unrecognized.
Conflict of interest statement
The authors declare no competing interests.
Figures


Similar articles
-
Housing conditions modulate spontaneous physical activity, feeding behavior, aerobic running capacity and adiposity in C57BL/6J mice.Horm Behav. 2019 Sep;115:104556. doi: 10.1016/j.yhbeh.2019.07.004. Epub 2019 Jul 20. Horm Behav. 2019. PMID: 31310763
-
Behavioral assessment of intermittent wheel running and individual housing in mice in the laboratory.J Appl Anim Welf Sci. 2005;8(3):157-73. doi: 10.1207/s15327604jaws0803_1. J Appl Anim Welf Sci. 2005. PMID: 16468945
-
A noninterfering system to measure in-cage spontaneous physical activity in mice.J Appl Physiol (1985). 2018 Aug 1;125(2):263-270. doi: 10.1152/japplphysiol.00058.2018. Epub 2018 Apr 26. J Appl Physiol (1985). 2018. PMID: 29698110
-
Towards large scale automated cage monitoring - Diurnal rhythm and impact of interventions on in-cage activity of C57BL/6J mice recorded 24/7 with a non-disrupting capacitive-based technique.PLoS One. 2019 Feb 4;14(2):e0211063. doi: 10.1371/journal.pone.0211063. eCollection 2019. PLoS One. 2019. PMID: 30716111 Free PMC article.
-
Cachexia Disrupts Diurnal Regulation of Activity, Feeding, and Muscle Mechanistic Target of Rapamycin Complex 1 in Mice.Med Sci Sports Exerc. 2020 Mar;52(3):577-587. doi: 10.1249/MSS.0000000000002166. Med Sci Sports Exerc. 2020. PMID: 32058469 Free PMC article.
Cited by
-
A multicentre study on spontaneous in-cage activity and micro-environmental conditions of IVC housed C57BL/6J mice during consecutive cycles of bi-weekly cage-change.PLoS One. 2022 May 25;17(5):e0267281. doi: 10.1371/journal.pone.0267281. eCollection 2022. PLoS One. 2022. PMID: 35613182 Free PMC article.
-
Somatostatin-Expressing Neurons in the Ventral Tegmental Area Innervate Specific Forebrain Regions and Are Involved in Stress Response.eNeuro. 2023 Aug 28;10(8):ENEURO.0149-23.2023. doi: 10.1523/ENEURO.0149-23.2023. Print 2023 Aug. eNeuro. 2023. PMID: 37553240 Free PMC article.
-
Dental biorhythm is associated with adolescent weight gain.Commun Med (Lond). 2022 Aug 22;2:99. doi: 10.1038/s43856-022-00164-x. eCollection 2022. Commun Med (Lond). 2022. PMID: 36016726 Free PMC article.
-
Longitudinal Study of Changes in Ammonia, Carbon Dioxide, Humidity and Temperature in Individually Ventilated Cages Housing Female and Male C57BL/6N Mice during Consecutive Cycles of Weekly and Bi-Weekly Cage Changes.Animals (Basel). 2024 Sep 21;14(18):2735. doi: 10.3390/ani14182735. Animals (Basel). 2024. PMID: 39335324 Free PMC article.
-
Using the Daphnia magna Transcriptome to Distinguish Water Source: Wetland and Stormwater Case Studies.Environ Toxicol Chem. 2022 Sep;41(9):2107-2123. doi: 10.1002/etc.5392. Epub 2022 Aug 9. Environ Toxicol Chem. 2022. PMID: 35622010 Free PMC article.
References
Publication types
MeSH terms
LinkOut - more resources
Full Text Sources
Other Literature Sources

