. 2021 Mar 26;478(6):1261-1282.
doi: 10.1042/BCJ20200984.

FoxA2 and RNA Pol II mediate human islet amyloid polypeptide turnover in ER-stressed pancreatic β-cells

Affiliations

FoxA2 and RNA Pol II mediate human islet amyloid polypeptide turnover in ER-stressed pancreatic β-cells

Diti Chatterjee Bhowmick et al. Biochem J. .

Abstract

Here, we investigated transcriptional and trafficking mechanisms of human islet amyloid polypeptide (hIAPP) in normal and stressed β-cells. In high glucose-challenged human islets and rat insulinoma cells overexpressing hIAPP, cell fractionation studies revealed increased accumulation of hIAPP. Unexpectedly, a significant fraction (up to 22%) of hIAPP was found in the nuclear soluble and chromatin-enriched fractions of cultured human islet and rat insulinoma cells. The nucleolar accumulation of monomeric forms of hIAPP did not have any adverse effect on the proliferation of β-cells nor did it affect nucleolar organization or function. However, intact nucleolar organization and function were essential for hIAPP expression under normal and ER-stress conditions as RNA polymerase II inhibitor, α-amanitin, reduced hIAPP protein expression evoked by high glucose and thapsigargin. Promoter activity studies revealed the essential role of transcription factor FoxA2 in hIAPP promoter activation in ER-stressed β-cells. Transcriptome and secretory studies demonstrate that the biosynthetic and secretory capacity of islet β-cells was preserved during ER stress. Thus, the main reason for increased intracellular hIAPP accumulation is its enhanced biosynthesis under these adverse conditions.

Keywords: ER stress; FoxA2; islet amyloid polypeptide; nucleolus; trafficking; transcription.


Conflict of interest statement

Competing Interests

The authors declare that they have no competing interests with the contents of this article.

Figures

Figure 1.
Figure 1.. hIAPP trafficking routes in RIN-m5f cells.
RIN-m5f cells were transduced with empty vector (EV), hIAPP or rIAPP encoding lentivirus particles for 48h. (A) Immuno-confocal microscopy optical section (1μm-Z plane) of RIN-m5f cells transduced with empty vector (EV) and hIAPP encoding lentivirus. Cells were co-stained with hIAPP-specific IAPP monoclonal antibody (red) and DAPI (blue). (B) Representative single (1μm-Z plane) fluorescence confocal sections of hIAPP intracellular accumulation sites in hIAPP lentivirus-transduced cells. Arrows denote hIAPP’s nuclear locations in micrographs. Bars, 5μm.
Figure 2.
Figure 2.. TEM analysis of IAPP trafficking in rat insulinoma cells.
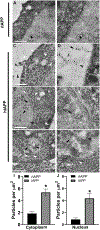
Synchronized control (rIAPP) and hIAPP-expressing rat insulinoma (INS 832/13) cells were harvested and processed for TEM analysis as described in material and methods. (A-B) Control rat INS 832/13 cells were examined for rat IAPP intracellular distribution. Representative EM image depicts rat IAPP immuno-localization in the nucleus (arrowhead) of control cells. (C-D) EM analysis revealed secretion and extracellular accumulation of immuno-gold conjugated hIAPP antibodies in hIAPP-expressing cells (depicted by black arrowheads). (E-F) TEM shows nuclear (black arrowheads) and cytosolic (white arrowheads) accumulation of IAPP in hIAPP-expressing cells. (G-H) hIAPP was also found in the mitochondria (white arrowheads) and autophagosomes (black arrowheads). (I, J) Immuno-quantitative analysis of IAPP accumulation in the nucleus and cytosolic compartments of control (rIAPP-expressing, black) and stable hIAPP-expressing (gray) INS 832/13 cells. *p<0.05, Student’s t-test. Magnified areas in original images (white box) are presented on the right. Bar, 500 nm.
Figure 3.
Figure 3.. Biochemical analysis of IAPP trafficking in human islet cells.
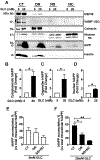
Human islets were cultured in basal (5mM) and high glucose (20mM) media for 4 days, followed by cell fractionation as described in the method section. (A) Western blot analysis of insulin and hIAPP distribution within the main cellular compartments under the basal and stress (high glucose) conditions. The following organelle-specific marker protein antibodies were used to determine hIAPP and insulin distribution within subcellular fractions: CT, the cytoplasmic fraction (HSP90 and VAMP), OR, ER-enriched organelle fraction (calnexin), and NC, the chromatin-bound fraction (histone). (B-F) The densitometric analysis of hIAPP accumulation in the enriched fractions of cultured human islets. Significance was established at *p< 0.05, **p< 0.01, ANOVA followed by Tukey’s post hoc comparison test. Data represent mean ± SEM of three independent experiments.
Figure 4.
Figure 4.. Nuclear accumulation of hIAPP in T2DM and ER stressed human islets.
Non-diabetic human islets were cultured in basal (5mM) and high glucose (20mM) media for 4 days or with the ER stress inducer thapsigargin (0.5μM) for 24 h. (A) Western blot analysis of ER stress marker protein GRP78 (BiP) expression in human islets. (B) Immuno-confocal microscopy analysis of hIAPP and insulin protein distribution in control non-diabetic and T2DM human islets. Cells were co-stained with hIAPP-specific IAPP monoclonal antibody (red), nuclear dye, DAPI (blue) and insulin (green). Bar, 5 μm. In magnified images on the right, arrows point to hIAPP assemblies in the cell nuclei. Arrowheads denote submicron-sized cytoplasmic vesicles containing hIAPP and insulin. An overlap between hIAPP (red trace) and insulin (green trace) fluorescence signals were detected with section analysis (Bar, 1 μm). Colocalization analysis was performed with ZEN software. Every pixel in the image was plotted in the scatterplot based on its intensity level from each channel. The pseudo-color in the scatterplot represents the number of pixels from individual channels (quadrants 1 and 2) and colocalized pixels (quadrant 3). Insulin (Ch-2) intensity distribution is shown on the x-axis and hIAPP (Ch-3) intensity distribution is shown on the y-axis. The lower left (unlabeled) quadrant in the scatterplot represents background pixels that have low intensity levels in both channels, which were excluded from colocalization analysis. (C) Quantitative immuno-confocal microscopy analysis of hIAPP nuclear expression under normal and ER stress conditions evoked by high glucose (20mM) or thapsigargin (0.5μM, 24h). Cells were co-stained with hIAPP-specific IAPP monoclonal antibody (red) and nuclear dye, DAPI (blue). Arrows and arrowheads denote nuclear and cytoplasmic hIAPP assemblies in the micrographs, respectively. Bar, 5μm. (D) Quantitative analysis of the nuclear hIAPP positive cells in the non-diabetic and T2DM human islets. Significance established at ** p< 0.01, ANOVA followed by Tukey’s post hoc comparison test. Data represent mean ± SEM of three independent experiments.
Figure 5.
Figure 5.. Cellular stress stimulates hIAPP trafficking to the nucleolus.
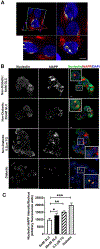
Non-diabetic human islets were cultured for 4 days in basal (5mM) or high glucose (20mM) media, or with ER stress inducer thapsigargin (0.5μM) for 24 h, and hIAPP trafficking and accumulation examined by immuno-confocal microscopy. (A) 3D immuno-confocal analysis reveals hIAPP-positive puncta in nucleolar and perinuclear regions (white) of cultured human islets. Cells were co-stained with the hIAPP-specific monoclonal antibody (red) and nuclear dye, DAPI (blue). Arrow points to hIAPP-signal within the cell nucleolus. Bar, 5μm. (B) Immuno-confocal analysis of hIAPP and nucleolar marker protein, nucleolin, distributions in control (5mM GLC), ER-stressed (20 mM GLC, 0.5 μM Thapsigargin) and confirmed type-2 diabetic human islets. Cells were co-stained with the hIAPP-specific monoclonal antibody (red), nuclear dye DAPI (blue) and nucleolin specific antibodies (green). Bar, 5μm. (C) Quantitative analysis of the nucleolar hIAPP signal in non-diabetic and T2DM human islets. Significance was established at *p< 0.05, **p< 0.01, ***p< 0.001, ANOVA followed by Tukey’s post hoc comparison test. Data represent mean ± SEM of three independent experiments.
Figure 6.
Figure 6.. Effect of high glucose on hIAPP nuclear accumulation, islet cell proliferation and rRNA synthesis.
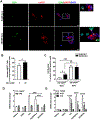
Non-diabetic human islets were cultured in basal (5mM) or high glucose (20mM) media for 4 days to stimulate hIAPP synthesis and cell proliferation. Islets were fixed, and hIAPP- and EDU-immunostaining performed to detect proliferative hIAPP-expressing islet cells. (A-C) Quantitative immuno-confocal microscopy analysis of hIAPP expression in EDU-positive (green) and non-proliferative human islet cells. Human islets were co-stained with hIAPP-specific IAPP monoclonal antibody (red) and nuclear dye, DAPI (blue). Arrows (insets) show nucleolar accumulation of hIAPP in EDU-positive islet cells. Arrowheads denote the nucleolar hIAPP signal in EDU-negative cells. Bar, 5 μm. Quantitative microscopy analysis of nuclear hIAPP expressing cells (B), and proliferative (EDU+) and non-proliferative (EDU) hIAPP-expressing islet cells under basal and high glucose conditions. (C). (D-E) Effect of high glucose on expression of hIAPP and other genes in control and hIAPP-knockdown islets. Partially dissociated human islets were incubated with 40 nM of antisense or control (scrambled) hIAPP siRNA oligonucleotide-containing transfection media. hIAPP and other gene mRNA levels were quantified in controls and treatments 48 hours post-transfection using qRT-PCR. Significance was established at **p< 0.01, ***p< 0.001, and ****p< 0.0001, ANOVA followed by Tukey’s post hoc comparison test. Data represent mean ± SEM of three independent experiments.
Figure 7.
Figure 7.. hIAPP mRNA and protein levels in ER-stressed β-cells.
Non-diabetic human islets were cultured in the presence or absence of 0.5 μM thapsigargin (TG) for 24h and hIAPP transcript and protein levels analyzed by RT-qPCR and western blot, respectively. (A-D) Equal protein content (10 μg) of islet cell extracts and equal volume (15μl) of culturing medium after 24h of incubation were resolved on SDS-PAGE and hIAPP protein intracellular and extracellular content analyzed by western blot and densitometry. (E) Gene (mRNA) expression analysis of the effect of ER stress on hIAPP and insulin transcription in cultured human islets. Significance was established at *p< 0.05, **p< 0.01, ***p< 0.001, ANOVA followed by Tukey’s post hoc comparison test. Data represent mean ± SEM of three independent experiments.
Figure 8.
Figure 8.. hIAPP promoter activation in ER-stressed pancreatic cells requires a functional FoxA2 binding site.
Freshly isolated human islet or RIN-m5F cells were co-incubated for 24h with renilla (for normalization) and firefly encoding luminescence constructs containing native (WT), mutated FoxA2 (ΔFoxA2) IAPP or WT insulin promoter. Thereafter, transfected cells were incubated with vehicle (DMSO) or 0.5 μm thapsigargin (TG) for an additional 24h. (A) Diagram depicts main transcriptional regulatory sites in hIAPP and insulin promoters. (B) Sequence alignment of WT and DN FoxA2 constructs. Mutated FoxA2 binding site within the hIAPP promoter is shown in red. (C-E) Quantification of insulin and IAPP promoter activity in control (DMSO) and ER stressed (TG) pancreatic cells. Normalized luminescence signal, reflecting promoter activity, is expressed as fold change from empty vector (EV)-transfected islets (set to 1), as described in the method section. Significance was established at *p< 0.05, and ****p< 0.0001, ANOVA followed by Tukey’s post hoc comparison test. Data represent mean ± SEM of three independent experiments.
Figure 9.
Figure 9.. Transcriptomic analysis of normal and stressed cultured human islets.
Freshly isolated non-diabetic human islets were cultured in the presence of high (20mM) glucose (HG), 0.5 μM thapsigargin (TG), or 0.5 μM tunicamycin (TN) for 24h. Changes in mRNA levels of various genes analyzed by RT-qPCR. Cq values, reflecting mRNA levels, were normalized to a housekeeping gene (actin) and relative gene expression was calculated as described in the method section. Line denotes baseline gene expression in control islets. Significance was established at *p< 0.05, **p< 0.01, ***p< 0.001, ANOVA followed by Tukey’s post hoc comparison test. Data represent mean ± SEM of three independent experiments.

Similar articles

Cited by

References

    1. Hung MC, Link W. Protein localization in disease and therapy. J Cell Sci. 2011;124(Pt 20):3381–92. - PubMed
    1. Mulder H, Ahren B, Sundler F. Islet amyloid polypeptide and insulin gene expression are regulated in parallel by glucose in vivo in rats. Am J Physiol. 1996;271(6 Pt 1):E1008–14. - PubMed
    1. Butler AE, Janson J, Bonner-Weir S, Ritzel R, Rizza RA, Butler PC. Beta-cell deficit and increased beta-cell apoptosis in humans with type 2 diabetes. Diabetes. 2003;52(1):102–10. - PubMed
    1. Mukherjee A, Morales-Scheihing D, Butler PC, Soto C. Type 2 diabetes as a protein misfolding disease. Trends Mol Med. 2015;21(7):439–49. - PMC - PubMed
    1. Christmanson L, Rorsman F, Stenman G, Westermark P, Betsholtz C. The human islet amyloid polypeptide (IAPP) gene. Organization, chromosomal localization and functional identification of a promoter region. FEBS Lett. 1990;267(1):160–6. - PubMed

Publication types

MeSH terms

LinkOut - more resources