. 2021 May;17(5):558-566.
doi: 10.1038/s41589-021-00747-0. Epub 2021 Mar 1.

Spatial decoding of endosomal cAMP signals by a metastable cytoplasmic PKA network

Affiliations

Spatial decoding of endosomal cAMP signals by a metastable cytoplasmic PKA network

Grace E Peng et al. Nat Chem Biol. 2021 May.

Abstract

G-protein-coupled receptor-regulated cAMP production from endosomes can specify signaling to the nucleus by moving the source of cAMP without changing its overall amount. How this is possible remains unknown because cAMP gradients dissipate over the nanoscale, whereas endosomes typically localize micrometers from the nucleus. We show that the key location-dependent step for endosome-encoded transcriptional control is nuclear entry of cAMP-dependent protein kinase (PKA) catalytic subunits. These are sourced from punctate accumulations of PKA holoenzyme that are densely distributed in the cytoplasm and titrated by global cAMP into a discrete metastable state, in which catalytic subunits are bound but dynamically exchange. Mobile endosomes containing activated receptors collide with the metastable PKA puncta and pause in close contact. We propose that these properties enable cytoplasmic PKA to act collectively like a semiconductor, converting nanoscale cAMP gradients generated from endosomes into microscale elevations of free catalytic subunits to direct downstream signaling.


Conflict of interest statement

COMPETING FINANCIAL INTERESTS STATEMENT

The authors declare no competing interests.

Figures

Extended Data Fig. 1
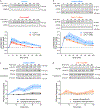
Extended Data Fig. 1. Characterization of endocytic blockade on β2AR and the effects of endocytic blockade on the cAMP signaling pathway.
a, cAMP luminescence time course from Fig. 1a (n = 3 biological replicates; control vs Dyngo4a mock p = 0.0469; control mock vs Iso, Dyngo4a mock vs Iso and control vs Dyngo4a Iso, p < 0.0001). b and c, Quantitative RT-PCR was performed on cells transfected with (b) mCherry-Dyn1 (control) or mCherry-Dyn1-K44E, or (c) Control siRNA or CHC17 siRNA, then untreated or treated with 100 nM Iso. PCK1 and GAPDH transcript levels determined by qRT-PCR. Dyn1 vs Dyn1K44E (n = 6 biological replicates, Interaction = 0.6313, Time p < 0.0001, Transfection p = 0.0476). Control siRNA vs CHC17 siRNA (n = 6 biological replicates, Interaction p = 0.0260, Time p < 0.0001, Transfection p < 0.0001). d, Iso stimulates cAMP luminescence over time. Cells were untreated (mock) or treated with 100 nM, 10 nM, or 1 nM Iso at 0 minutes. (n = 3 biological replicates; Interaction, Time and Treatment p < 0.0001; mock vs 1 nM Iso, mock vs 10 nM Iso and mock vs 100 nM Iso p < 0.0001). e, Maximum cAMP luminescence from d (n = 3 biological replicates; mock vs 1 nM Iso p = 0.7889; 10 nM vs 100 nM Iso, p = 0.0004; mock vs 100 nM Iso and 1 nM vs 100 nM Iso p < 0.0001). f, Induction of PCK1 increases with concentration of Iso. qRT-PCR was performed on cells untreated (mock) and treated with 100 nM, 10 nM, and 1 nM Iso (n = 3 biological replicates; mock vs 1 nM Iso, p = 0.2323; mock vs 100 nM Iso, p < 0.0001; 1 nM vs 100 nM Iso, p = 0.0006; 10 nM vs 100 nM Iso, p = 0.1270). g, Comparison of cAMP production using different doses of Iso and endocytic blockade with mutant dynamin. GG4B and pcDNA3 (control) or mCherry-Dyn1-K44E expressing cells were untreated (mock) or treated with 100 or 10 nM Iso. Area under the curve (right) shown for the quantification of the time course (left) (n = 4, cells ≥ 9 per biological replicate; control 10 nM Iso vs. Dyn1-K44E 100 nM Iso p = 0.3350; all other comparisons p < 0.0001). h, Kinetics of cAMP response. Each cAMP response from Fig. 1d was normalized to the peak. (control, n = 4, Dyn1-K44E n = 3, Interaction p = 0.9776, Time p < 0.0001, Transfection p = 0.0634). All data are mean ± sem (shaded areas). Significance determined by ordinary one-way ANOVA (e-g), or two-way ANOVA (a-d, h) with Tukey’s (a, d) or Sidak’s (c, e-g) multiple comparisons tests.
Extended Data Fig. 2
Extended Data Fig. 2. Endocytosis blockade reduces β2AR-stimulated cAMP downstream signaling.
a-c, Nuclear cAMP signaling cascade responses are shown in the same time scale (up to 60 minutes) in cells transfected with control siRNA or CHC17 siRNA. a, Western blot analysis of PKAcat from nuclear samples treated with 100 nM Iso (adapted from Fig. 2c and d). b, Western blot analysis of CREB phosphorylation from whole cell lysates after 100 nM Iso treatment (adapted from Fig. 2b). c, qRT-PCR quantitation of cells treated with 100 nM Iso (adapted from Extended Data Fig. 1c). d, Western blot quantification of PKAcat from whole cell lysate and nuclear samples (n = 3 biological replicates, p < 0.0001, two-tailed unpaired t-test). All data are mean ± sem.
Extended Data Fig. 3
Extended Data Fig. 3. Detection of PKAcat by live microscopy gene-edited mNG2-PKAcat HEK293T cells.
a, Identifying cells expressing NLS-mNG21–10 IRES TagBFP for analysis. Images correspond with cells in b. b, Representative spinning disk confocal images of live cells expressing mNG211-PKAcat, mNG21–10 and nuclear localized NLS-mNG21–10. Cells were untreated (mock) or treated with 100 nM Iso at 0 minutes. Inset shows nuclear ROI shown as dotted line square. c and d, Quantification of PKAcat nuclear accumulation. c, Cells were untreated (mock) or stimulated with 100 nM Iso at 0 minutes in c (n = 3, cells ≥ 21 per biological replicate; Interaction and Time p = 0.0346, Treatment p < 0.0001; p < 0.05 mock vs Iso time = 5–35 and 45 minutes with Sidak’s multiple comparisons test; two-way ANOVA). d, Cells expressing pcDNA3 (control) or mCherry-Dyn1-K44E were untreated (mock) or treated with 100 nM Iso at 0 minutes. (n = 4, cells ≥ 7 per biological replicate; Interaction p = 0.7938, Time and Transfection p < 0.0001, two-way ANOVA). e and f, Identifying cells for analysis. mNG2-PKAcat cells expressing NLS-mNG21–10 IRES TagBFP were co-transfected with NLS-mNG21–10 IRES TagBFP and control or Dyn1-K44E DNA (e) or CHC17 siRNA (f). e, Images correspond to cells in Fig. 3c. g, Quantification of PKAcat nuclear accumulation in mNG2-PKAcat cells transfected with ASN siRNA (control) or AF555-CHC17 siRNA (n = 5, cells ≥ 9 per biological replicate; Interaction, Time and Transfection p < 0.0001; Control siRNA vs CHC17 siRNA mock p = 0.8237, all other comparisons p < 0.0001; Sidak’s multiple comparisons test, two-way ANOVA). h, Quantification of cells transiently expressing ASN siRNA (control) or AF555-CHC17 siRNA from g, data normalized to the corresponding untreated 45 minute time point (n = 5 biological replicates; p = 0.0017 Control siRNA untreated vs Iso, p = 0.5632 CHC17 siRNA untreated vs Iso, p = 0.03 Control siRNA Iso vs CHC17 siRNA Iso; Sidak’s multiple comparisons test, ordinary one-way ANOVA). i, Validation of CHC17 knockdown in imaging experiments quantified in g and h. qRT-PCR for CHC17 and GAPDH transcript levels (n = 5 biological replicates, p < 0.0001, two-tailed unpaired t-test). All data are mean ± sem (shaded areas). Scale bars = 5 μm.
Extended Data Fig. 4
Extended Data Fig. 4. Identification of cells expressing mCherry-Dyn1-K44Ein HEK293T mNG2-PKAcat cells.
Cells expressing mCherry-Dyn1-K44E were identified to determine which cells would be used for analysis. Images correspond with image of cells from Fig. 4b. Scale bar = 5 μm.
Extended Data Fig. 5
Extended Data Fig. 5. Fluorescence recovery after photobleaching analysis.
a, Quantification from Fig. 5c without normalizing to whole cell fluorescence. b, Photobleaching recovery curves with non-linear fit. Recovery curves from Fig. 5c are replotted without pre-photobleaching. Each recovery curve was fit using non-linear regression and an exponential one-phase association model. The Iso condition (blue) has a half-time of 50.40 s and fractional recovery of 86.04%. The untreated condition (gray) has a half-time of 58.86 s and a fractional recovery of 61.08% (n = 3, cells ≥ 3 per biological replicate; Interaction, Time and Transfection p < 0.0001; p < 0.05 for untreated vs Iso for time = 30–300 s with Sidak’s multiple comparisons test, two-way ANOVA). c, Photobleaching in different regions of the cell. Cells untreated or treated with 100 nM Iso for 30 minutes are photobleached in a perinuclear or cytoplasmic region (n = 3, cells ≥ 3 per biological replicate; Interaction, Time and Transfection p < 0.0001; all comparisons p < 0.0001 with Sidak’s multiple comparisons test, two-way ANOVA). d and e, Half times and percent maximal recovery of all photobleaching conditions determined by a non-linear regression and an exponential one-phase association model. d, Half times (n ≥ 3, cells ≥ 3 per biological replicate; p = 0.9645, ordinary one-way ANOVA). e, Percent maximal recovery (n ≥ 3, cells ≥ 3 per biological replicate; mock vs Iso and Iso vs Iso Alp p < 0.0001; Dyn1-K44E mock vs Iso and Iso vs Iso Alp p = 0.0005; DMSO vs Fsk p = 0.0057; Perinuclear ROI vs Cytoplasmic ROI p = 0.3736; Iso Alp vs Iso CGP p = 0.9847; Cyto mock vs Iso p = 0.9988; control vs Dyn1-K44E Iso and Iso vs Fsk p > 0.9999; Sidak’s multiple compariosons test, ordinary one-way ANOVA). f and g, Validation of PKAcat return to the perinuclear region after 100 nM forskolin (Fsk). f, Quantification of perinuclear PKAcat 30 minutes after DMSO, 100 nM, 10 μM and 10 μM Fsk treatment (n = 3, cells ≥ 20 per biological replicate; DMSO vs 10 nM Fsk 0.9995; DMSO vs 100 nM Fsk 0.9997; DMSO vs 1 μM Fsk 0.7704; DMSO vs 10 μM Fsk 0.0017; Sidak’s multiple comparisons test, ordinary one-way ANOVA). g, Representative live cell spinning disk confocal images of mNG2-PKAcat before and after 30 minute treatment with DMSO and 100 nM Fsk. Scale bar = 5 μm. Data are mean ± sem.
Extended Data Fig. 6
Extended Data Fig. 6. Endocytosis moves activated β2ARs into close proximity with dynamic PKAcat.
a, Cells were transfected with FLAG-β2AR and Nb80-mApple. Surface FLAG-β2ARs were labeled with M1-FLAG-647 for 15 minutes prior to imaging. Representative spinning disk confocal images of live cells were taken before and 30 minutes after 100 nM Iso addition. b, Spinning disk confocal fixed images of mNG2-PKAcat cells stained for EEA1. Individual channels from merged image in Fig. 6d. c, Spinning disk confocal live images of mNG2-PKAcat cells transiently expressing DsRed-EEA1. Cells were pretreated with 100 nM Iso for 25 minutes and imaged for 5 minutes at 5 second intervals. Scale bar = 5 μm.
Figure 1.
Figure 1.
β2AR-induced transcriptional signaling is endocytosis-dependent and independent of magnitude and kinetics. a and b, HEK293 cells were pretreated with either DMSO (control) or chemical inhibitor of dynamin (30 μM Dyngo4a) and followed by either no treatment (mock) or 100 nM Iso treatment. a, Endocytic blockade by Dyngo4a reduces β2AR-stimulated cAMP. The maximum luminescence value measured in cells expressing the cAMP luciferase biosensor was determined and normalized to the control Iso condition. (n = 3 with ≥ two technical replicates per biological replicate, p = 0.0048, two-tailed unpaired t-test). b, Quantitative RT-PCR for PCK1 and GAPDH transcript levels was performed on samples treated with 100 nM Iso for two hours. (DMSO vs 30 μM Dyngo4a, n = 4 with 3 technical replicates per biological replicate, Interaction, Time and Pretreatment p < 0.0001; p < 0.0001 for times 45, 60, 90, and 120 minutes with Sidak’s multiple comparisons test, two-way ANOVA). c, Endocytic inhibition results in a smaller reduction in overall cAMP than PCK1 induction. Comparing overall cAMP and PCK1 induction among different endocytic inhibition methods (mutant dynamin1, siRNA depletion of clathrin, pharmacological inhibitor of dynamin) and different Iso doses. Respective untreated control conditions are shown in black or gray circles in the bottom left of the plot. Gray dotted line connects Iso dose conditions. d, Kinetics of cAMP production over time. Time course of HEK293 cells co-expressing the cAMP fluorescence biosensor GG4B and pcDNA3 (control) or mCherry-Dyn1-K44E (control, n = 4; Dyn1-K44E n = 3, cells ≥ 13 per biological replicate; Interaction p = 0.9934, p < 0.0001 for Time and Transfection, two-way ANOVA). All data are mean ± sem (shaded areas).
Figure 2.
Figure 2.
Iso-stimulated CREB phosphorylation and PKAcat nuclear entry are endocytosis dependent. a and b, Western blot analysis of CREB phosphorylation (Ser133) in HEK293 cells untreated and treated with 100 nM Iso. Cells expressing mCherry-Dyn1 (control) or mCherry-Dyn1-K44E (a) or scramble (control) or clathrin (CHC17) siRNA (b). Top, representative western blot probing CREB phosphorylation at Ser133 (pCREB) and CREB. Bottom, quantification of western blots in a (n = 3 biological replicates, Interaction p = 0.9041, Time p < 0.0001, Transfection p = 0.0005; two-way ANOVA) and b (n = 7 biological replicates, Interaction p = 0.8413, Time p < 0.0001, Transfection p = 0.0181; two-way ANOVA). c and d, Western blot analysis of PKAcat in nuclear and cytoplasmic fractions from cells untreated and treated with 100 nM Iso. Cells expressing scramble siRNA (c, control) or clathrin siRNA (d, CHC17). Top, representative western blots probing for PKA catalytic subunit α in nuclear and cytoplasmic fractions. HDAC2 and α-tubulin were used as nuclear and cytoplasmic loading controls, respectively. Bottom, quantification of western blots in c (nuclear n = 3, cytoplasmic n = 4 biological replicates; Interaction p = 0.0763, Time p = 0.0100 and Fraction p < 0.0001; two-way ANOVA) and d (n = 4 biological replicates, ns, Interaction p = 0.8805, Time p = 0.5095 and Fraction p = 0.1782; two-way ANOVA). All data are mean ± sem (shaded areas).
Figure 3.
Figure 3.
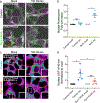
Independent verification of endocytosis-dependent nuclear entry of PKAcat. a, Representative spinning disk confocal images of fixed cells untransfected (control, top) and transfected with nuclear localized mNG21–10 (bottom). Cells were untreated (mock) or stimulated with 100 nM Iso. b, Quantification of fixed cells in a (n = 4, cells ≥ 74 per biological replicate; control 0 min vs 45 min p = 0.8625, NLS 0 min vs 45 min p = 0.0003; ordinary one-way ANOVA). c, Representative spinning disk confocal images of live cells expressing mNG211-PKAcat, mNG21–10 and nuclear localized NLS-mNG21–10. Cells were transfected with pcDNA3 (control, or mCherry-Dyn-K44E and cells were untreated (mock, top) or treated with 100 nM Iso (bottom) at 0 minutes. Inset shows nuclear ROI shown as dotted line square at 0 minutes. d, Quantification of cells expressing pcDNA3 (control) or mCherry-Dyn1-K44E from c, data normalized to the corresponding untreated 45 minute time point (n = 4; control mock vs Iso p < 0.0001, Dyn1-K44E mock vs Iso p = 0.7726, control Iso vs Dyn1-K44E Iso p = 0.0004 with Sidak’s multiple comparisons test; ordinary one-way ANOVA). All data are mean ± sem (shaded areas). Scale bars = 5 μm.
Figure 4.
Figure 4.
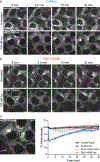
Cytoplasmic PKAcat sequentially disperses and relocalizes during prolonged β2AR activation. a and b, Representative live cell spinning disk confocal images of endogenously tagged mNG2-PKAcat HEK293T cells. Cells expressing pcDNA3 (a, control) or mCherry-Dyn1-K44E (b) were untreated (mock, top) or treated with 100 nM Iso (bottom) at 0 minutes. c, Quantification of experiments described in (a and b). Examples of ROIs drawn around the perinuclear region in green. (n = 3, cells ≥ 5 per biological replicate; Interaction, Time and Treatment p < 0.0001; control mock vs control Iso p < 0.0001, Dyn1-K44E mock vs Dyn1-K44E Iso p < 0.0001, control mock vs Dyn1-K44E mock p = 0.0437, control Iso vs Dyn1-K44E Iso p = 0.6556 with Tukey’s multiple comparisons test; two-way ANOVA). Data are mean ± sem (shaded areas). Scale bars = 5 μm.
Figure 5.
Figure 5.
Cytoplasmic PKAcat dynamically exchanges during prolonged β2AR activation. a and b, Cells were photobleached (white box) at 30 seconds and fluorescence recovery was monitored after photobleaching. Representative live cell spinning disk confocal images of HEK293 cells transfected with pEGFP-N1 in a and HEK293T mNG2-PKAcat cells in b. b, Untransfected cells (control) were untreated (mock) or treated with 100 nM Iso for 30 minutes before live imaging. c-f, Quantification of photobleaching. c, Cells were untreated (mock) or treated with 100 nM Iso for 30 minutes before photobleaching. Data combined from d-f (n = 9, cells ≥ 3 per biological replicate). d, Cells were untransfected or transfected with mCherry-Dyn1-K44E and untreated (mock) or treated with 100 nM Iso for 30 minutes before photobleaching (n = 3, cells ≥ 3 per biological replicate; Interaction, Time and Treatment p < 0.0001; Iso vs Dyn1-K44E Iso p = 0.8710; mock vs Iso, Dyn1-K44E mock vs Dyn1-K44E and mock vs Dyn1-K44E mock p <0.0001). e, Cells were untreated (mock) or treated with 100 nM Iso, DMSO or 100 nM Fsk for 30 minutes before photobleaching (n = 3, cells ≥ 3 per biological replicate; Interaction, Time and Treatment p < 0.0001; mock vs DMSO p = 0.2619; mock vs Iso, DMSO vs Fsk and Iso vs Fsk p < 0.0001). f, Untransfected cells were untreated (mock) or treated with 100 nM Iso for 30 minutes followed by no treatment or treatment with 10 μM Alprenolol or 10 μM CGP-12177 for 5 minutes before photobleaching (n = 3, cells = 9 per biological replicate; Interaction, Time and Treatment p < 0.0001; mock vs Iso CGP p = 0.9425, mock vs Iso, Iso vs Iso Alp and Iso vs Iso CGP p < 0.0001). Data are mean ± sem (shaded area). Significance in d-f was determined by two-way ANOVA with Tukey’s multiple comparisons test. Scale bars = 5 μm.
Figure 6.
Figure 6.
Endocytosis moves activated β2ARs into close proximity with dynamic PKAcat. a, HEK293T mNG2-PKAcat cells transfected with FLAG-β2AR and labeled with M1-FLAG-647. Cells were treated with 100 nM Iso and images were taken at 20 minutes post Iso addition. b, Normalized fluorescence intensity profiles of lines shown in a for mNG2-PKAcat and FLAG-β2AR. c, Potential sites of signaling in cells. Result image from image multiplication of normalized images of mNG2-PKAcat x FLAG-β2AR in a. d, Representative fixed cell spinning disk confocal images of HEK293T mNG2-PKAcat cells stained for endogenous EEA1. Scale bars = 5 μm, except in the inset of d where the scale bar = 1 μm. e, Model proposed for selective signaling by β2AR. Cartoon model based on the proximity of endosomes and dynamic PKA puncta show in the inset in d. At basal state, little cAMP is produced in the cytoplasm. PKAcat exists at stable puncta in the cytoplasm. After prolonged agonist, low levels of cAMP are produced at the plasma membrane and fill the cell allowing for dynamic exchange of PKAcat. Endosomes add local production of cAMP at a local high concentration, increasing the amount of dynamic PKAcat exchange.

Similar articles

Cited by

References

    1. Kwok-Keung Fung B & Stryer L Photolyzed rhodopsin catalyzes the exchange of GTP for bound GDP in retinal rod outer segments. Proc. Natl. Acad. Sci 77, 2500–2504 (1980). - PMC - PubMed
    1. Tsvetanova NG, Irannejad R & von Zastrow M G protein-coupled receptor (GPCR) signaling via heterotrimeric G proteins from endosomes. J. Biol. Chem 290, 6689–96 (2015). - PMC - PubMed
    1. Pavlos NJ & Friedman PA GPCR Signaling and Trafficking: The Long and Short of It. Trends Endocrinol. Metab 28, 213–226 (2017). - PMC - PubMed
    1. Calebiro D & Godbole A Internalization of G-protein-coupled receptors: Implication in receptor function, physiology and diseases. Best Pract. Res. Clin. Endocrinol. Metab 32, 83–91 (2018). - PubMed
    1. Vilardaga JP, Jean-Alphonse FG & Gardella TJ Endosomal generation of cAMP in GPCR signaling. Nature Chemical Biology 10, 700–706 (2014). - PMC - PubMed

METHODS REFERENCES

    1. Zhao Y et al. An Expanded Palette of Genetically Encoded Ca2+ Indicators. Science (80-. ) 333, 1888–1891 (2011). - PMC - PubMed
    1. Patriarchi T et al. Imaging neuromodulators with high spatiotemporal resolution using genetically encoded indicators. Nat. Protoc 14, 3471–3505 (2019). - PubMed
    1. Niwa H, Yamamura K & Miyazaki J Efficient selection for high-expression transfectants with a novel eukaryotic vector. Gene 108, 193–199 (1991). - PubMed
    1. Lin S, Staahl BT, Alla RK & Doudna JA Enhanced homology-directed human genome engineering by controlled timing of CRISPR/Cas9 delivery. Elife 3, e04766 (2014). - PMC - PubMed
    1. Jinek M et al. A programmable dual-RNA-guided DNA endonuclease in adaptive bacterial immunity. Science (80-. ) 337, 816–821 (2012). - PMC - PubMed

Publication types

MeSH terms