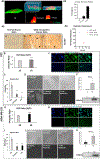
Physical confinement during cancer cell migration triggers therapeutic resistance and cancer stem cell-like behavior
- PMID: 33639204
- PMCID: PMC8112468
- DOI: 10.1016/j.canlet.2021.01.020
Physical confinement during cancer cell migration triggers therapeutic resistance and cancer stem cell-like behavior
Abstract
Metastasized cancer cells have an increased resistance to therapies leading to a drastic decrease in patient survival rates. However, our understanding of the cause for this enhanced resistance is lacking. In this study, we report that physically tight confinement during cancer cell migration triggers therapeutic resistance and induces cancer stem cell-like behavior including up-regulation in efflux proteins and in cancer stem cell related markers. Moreover, the re-localization of Yes-associated protein (YAP) to the cell nucleus indicated an elevated level of cytoskeletal tension. The increased cytoskeletal tension suggested that mechanical interactions between cancer cells and tight surroundings during metastasis is one of the factors that contributes to therapeutic resistance and acquisition of cancer stem cell (CSC) like features. With this system and supporting data, we are able to study cells with therapeutic resistance and CSC-like properties for the future purpose of developing new strategies for the treatment of metastatic cancer.
Keywords: Cancer metastasis; Physical confinement; Therapeutic resistance.
Copyright © 2021 Elsevier B.V. All rights reserved.
Conflict of interest statement
Declaration of Interests
All authors declare that there is no competing financial interests or personal relationships that could have appeared to influence the work reported in this paper.
Figures


Similar articles
-
FOXC1 induces cancer stem cell-like properties through upregulation of beta-catenin in NSCLC.J Exp Clin Cancer Res. 2018 Sep 6;37(1):220. doi: 10.1186/s13046-018-0894-0. J Exp Clin Cancer Res. 2018. PMID: 30189871 Free PMC article.
-
Concomitant targeting of multiple key transcription factors effectively disrupts cancer stem cells enriched in side population of human pancreatic cancer cells.PLoS One. 2013 Sep 11;8(9):e73942. doi: 10.1371/journal.pone.0073942. eCollection 2013. PLoS One. 2013. PMID: 24040121 Free PMC article.
-
SLC7A11 Overexpression in Glioblastoma Is Associated with Increased Cancer Stem Cell-Like Properties.Stem Cells Dev. 2017 Sep 1;26(17):1236-1246. doi: 10.1089/scd.2017.0123. Epub 2017 Jul 27. Stem Cells Dev. 2017. PMID: 28610554 Free PMC article.
-
Overexpression of snail induces epithelial-mesenchymal transition and a cancer stem cell-like phenotype in human colorectal cancer cells.Cancer Med. 2012 Aug;1(1):5-16. doi: 10.1002/cam4.4. Epub 2012 Jun 8. Cancer Med. 2012. PMID: 23342249 Free PMC article.
-
Emerging functional markers for cancer stem cell-based therapies: Understanding signaling networks for targeting metastasis.Semin Cancer Biol. 2018 Dec;53:90-109. doi: 10.1016/j.semcancer.2018.06.006. Epub 2018 Jun 30. Semin Cancer Biol. 2018. PMID: 29966677 Review.
Cited by
-
Coordinated in confined migration: crosstalk between the nucleus and ion channel-mediated mechanosensation.Trends Cell Biol. 2024 Oct;34(10):809-825. doi: 10.1016/j.tcb.2024.01.001. Epub 2024 Jan 29. Trends Cell Biol. 2024. PMID: 38290913 Review.
-
Cancer Stem Cells and the Tumor Microenvironment: Targeting the Critical Crosstalk through Nanocarrier Systems.Stem Cell Rev Rep. 2022 Oct;18(7):2209-2233. doi: 10.1007/s12015-022-10426-9. Epub 2022 Jul 25. Stem Cell Rev Rep. 2022. PMID: 35876959 Free PMC article. Review.
-
Engineering approaches for understanding mechanical memory in cancer metastasis.APL Bioeng. 2024 Apr 10;8(2):021503. doi: 10.1063/5.0194539. eCollection 2024 Jun. APL Bioeng. 2024. PMID: 38605886 Free PMC article. Review.
-
The biology of YAP in programmed cell death.Biomark Res. 2022 May 23;10(1):34. doi: 10.1186/s40364-022-00365-5. Biomark Res. 2022. PMID: 35606801 Free PMC article. Review.
-
Drug resistance‑related gene targets and molecular mechanisms in the A2780/Taxol‑resistant epithelial ovarian cancer cell line.Oncol Lett. 2024 Mar 26;27(5):232. doi: 10.3892/ol.2024.14365. eCollection 2024 May. Oncol Lett. 2024. PMID: 38586210 Free PMC article.
References
-
- Gupta GP, Massagué JJC, Cancer metastasis: building a framework, 127 (2006) 679–695. - PubMed
-
- Friedl P, Wolf K.J.N.r.c., Tumour-cell invasion and migration: diversity and escape mechanisms, 3 (2003) 362. - PubMed
-
- M. M, Cellular mechanobiology and cancer metastasis Birth Defects Research Part C: Embryo Today: Reviews, 81 (2007) 329–343. - PubMed
Publication types
MeSH terms
Substances
Grants and funding
LinkOut - more resources
Full Text Sources
Other Literature Sources

