Structure-based analyses of Salmonella RcsB variants unravel new features of the Rcs regulon
- PMID: 33638994
- PMCID: PMC7913699
- DOI: 10.1093/nar/gkab060
Structure-based analyses of Salmonella RcsB variants unravel new features of the Rcs regulon
Abstract
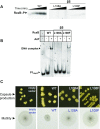
RcsB is a transcriptional regulator that controls expression of numerous genes in enteric bacteria. RcsB accomplishes this role alone or in combination with auxiliary transcriptional factors independently or dependently of phosphorylation. To understand the mechanisms by which RcsB regulates such large number of genes, we performed structural studies as well as in vitro and in vivo functional studies with different RcsB variants. Our structural data reveal that RcsB binds promoters of target genes such as rprA and flhDC in a dimeric active conformation. In this state, the RcsB homodimer docks the DNA-binding domains into the major groove of the DNA, facilitating an initial weak read-out of the target sequence. Interestingly, comparative structural analyses also show that DNA binding may stabilize an active conformation in unphosphorylated RcsB. Furthermore, RNAseq performed in strains expressing wild-type or several RcsB variants provided new insights into the contribution of phosphorylation to gene regulation and assign a potential role of RcsB in controlling iron metabolism. Finally, we delimited the RcsB box for homodimeric active binding to DNA as the sequence TN(G/A)GAN4TC(T/C)NA. This RcsB box was found in promoter, intergenic and intragenic regions, facilitating both increased or decreased gene transcription.
© The Author(s) 2021. Published by Oxford University Press on behalf of Nucleic Acids Research.
Figures


Similar articles
-
Genome expression analyses revealing the modulation of the Salmonella Rcs regulon by the attenuator IgaA.J Bacteriol. 2009 Mar;191(6):1855-67. doi: 10.1128/JB.01604-08. Epub 2009 Jan 5. J Bacteriol. 2009. PMID: 19124574 Free PMC article.
-
RflM mediates target specificity of the RcsCDB phosphorelay system for transcriptional repression of flagellar synthesis in Salmonella enterica.Mol Microbiol. 2016 Sep;101(5):841-55. doi: 10.1111/mmi.13427. Epub 2016 Jun 27. Mol Microbiol. 2016. PMID: 27206164
-
Conformational dynamism for DNA interaction in the Salmonella RcsB response regulator.Nucleic Acids Res. 2018 Jan 9;46(1):456-472. doi: 10.1093/nar/gkx1164. Nucleic Acids Res. 2018. PMID: 29186528 Free PMC article.
-
The Complex Rcs Regulatory Cascade.Annu Rev Microbiol. 2018 Sep 8;72:111-139. doi: 10.1146/annurev-micro-090817-062640. Epub 2018 Jun 13. Annu Rev Microbiol. 2018. PMID: 29897834 Review.
-
Enhancer-dependent transcription in Salmonella enterica Typhimurium: new members of the sigmaN regulon inferred from protein sequence homology and predicted promoter sites.J Mol Microbiol Biotechnol. 2002 Jul;4(4):367-74. J Mol Microbiol Biotechnol. 2002. PMID: 12125817 Review.
Cited by
-
Regulation of gene expression by non-phosphorylated response regulators.Int Microbiol. 2021 Nov;24(4):521-529. doi: 10.1007/s10123-021-00180-2. Epub 2021 May 13. Int Microbiol. 2021. PMID: 33987704 Review.
-
The Rcs System Contributes to the Motility Defects of the Twin-Arginine Translocation System Mutant of Extraintestinal Pathogenic Escherichia coli.J Bacteriol. 2022 Apr 19;204(4):e0061221. doi: 10.1128/jb.00612-21. Epub 2022 Mar 21. J Bacteriol. 2022. PMID: 35311558 Free PMC article.
-
A frameshift in Yersinia pestis rcsD alters canonical Rcs signalling to preserve flea-mammal plague transmission cycles.Elife. 2023 Apr 3;12:e83946. doi: 10.7554/eLife.83946. Elife. 2023. PMID: 37010269 Free PMC article.
-
Antibiotics Used in Empiric Treatment of Ocular Infections Trigger the Bacterial Rcs Stress Response System Independent of Antibiotic Susceptibility.Antibiotics (Basel). 2021 Aug 25;10(9):1033. doi: 10.3390/antibiotics10091033. Antibiotics (Basel). 2021. PMID: 34572615 Free PMC article.
-
The Short-chain Fatty Acid Propionic Acid Activates the Rcs Stress Response System Partially through Inhibition of d-Alanine Racemase.mSphere. 2023 Feb 21;8(1):e0043922. doi: 10.1128/msphere.00439-22. Epub 2023 Jan 16. mSphere. 2023. PMID: 36645277 Free PMC article.
References
-
- Wall E., Majdalani N., Gottesman S.. The complex Rcs regulatory cascade. Annu. Rev. Microbiol. 2018; 72:111–139. - PubMed
-
- Mariscotti J.F., García-del Portillo F.. Instability of the Salmonella RcsCDB signalling system in the absence of the attenuator IgaA. Microbiology. 2008; 154:1372–1383. - PubMed
Publication types
MeSH terms
Substances
LinkOut - more resources
Full Text Sources
Other Literature Sources
Molecular Biology Databases

