Significance between air pollutants, meteorological factors, and COVID-19 infections: probable evidences in India
- PMID: 33638789
- PMCID: PMC7912974
- DOI: 10.1007/s11356-021-12709-z
Significance between air pollutants, meteorological factors, and COVID-19 infections: probable evidences in India
Abstract
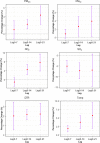
Severe acute respiratory syndrome coronavirus 2 (SARS-CoV-2) disease represents the causative agent with a potentially fatal risk which is having great global human health concern. Earlier studies suggested that air pollutants and meteorological factors were considered as the risk factors for acute respiratory infection, which carries harmful pathogens and affects the immunity. The study intended to explore the correlation between air pollutants, meteorological factors, and the daily reported infected cases caused by novel coronavirus in India. The daily positive infected cases, concentrations of air pollutants, and meteorological factors in 288 districts were collected from January 30, 2020, to April 23, 2020, in India. Spearman's correlation and generalized additive model (GAM) were applied to investigate the correlations of four air pollutants (PM2.5, PM10, NO2, and SO2) and eight meteorological factors (Temp, DTR, RH, AH, AP, RF, WS, and WD) with COVID-19-infected cases. The study indicated that a 10 μg/m3 increase during (Lag0-14) in PM2.5, PM10, and NO2 resulted in 2.21% (95%CI: 1.13 to 3.29), 2.67% (95% CI: 0.33 to 5.01), and 4.56 (95% CI: 2.22 to 6.90) increase in daily counts of Coronavirus Disease 2019 (COVID 19)-infected cases respectively. However, only 1 unit increase in meteorological factor levels in case of daily mean temperature and DTR during (Lag0-14) associated with 3.78% (95%CI: 1.81 to 5.75) and 1.82% (95% CI: -1.74 to 5.38) rise of COVID-19-infected cases respectively. In addition, SO2 and relative humidity were negatively associated with COVID-19-infected cases at Lag0-14 with decrease of 7.23% (95% CI: -10.99 to -3.47) and 1.11% (95% CI: -3.45 to 1.23) for SO2 and for relative humidity respectively. The study recommended that there are significant correlations between air pollutants and meteorological factors with COVID-19-infected cases, which substantially explain the effect of national lockdown and suggested positive implications for control and prevention of the spread of SARS-CoV-2 disease.
Keywords: Air pollution,; COVID-19,; Generalized additive model; Meteorological factors,; Spearman’s correlation,.
© 2021. The Author(s), under exclusive licence to Springer-Verlag GmbH, DE part of Springer Nature.
Conflict of interest statement
The authors declare that they have no conflict of interest.
Figures





Similar articles
-
Association between short-term exposure to air pollution and COVID-19 infection: Evidence from China.Sci Total Environ. 2020 Jul 20;727:138704. doi: 10.1016/j.scitotenv.2020.138704. Epub 2020 Apr 15. Sci Total Environ. 2020. PMID: 32315904 Free PMC article.
-
Association between air quality, meteorological factors and COVID-19 infection case numbers.Environ Res. 2021 Jun;197:111024. doi: 10.1016/j.envres.2021.111024. Epub 2021 Mar 17. Environ Res. 2021. PMID: 33744266 Free PMC article.
-
Influence of air pollution and meteorological factors on the spread of COVID-19 in the Bangkok Metropolitan Region and air quality during the outbreak.Environ Res. 2021 Jun;197:111104. doi: 10.1016/j.envres.2021.111104. Epub 2021 Mar 30. Environ Res. 2021. PMID: 33798521 Free PMC article.
-
COVID-19 lockdown and environmental pollution: an Indian multi-state investigation.Environ Monit Assess. 2022 Jan 3;194(2):49. doi: 10.1007/s10661-021-09693-9. Environ Monit Assess. 2022. PMID: 34978634 Free PMC article. Review.
-
The role of air pollution (PM and NO2) in COVID-19 spread and lethality: A systematic review.Environ Res. 2020 Dec;191:110129. doi: 10.1016/j.envres.2020.110129. Epub 2020 Aug 24. Environ Res. 2020. PMID: 32853663 Free PMC article. Review.
Cited by
-
Econometric analysis of COVID-19 cases, deaths, and meteorological factors in South Asia.Environ Sci Pollut Res Int. 2021 Jun;28(22):28518-28534. doi: 10.1007/s11356-021-12613-6. Epub 2021 Feb 4. Environ Sci Pollut Res Int. 2021. PMID: 33543434 Free PMC article.
-
The climate change-pollution-aerobiome nexus: A 'systems thinking' mini-review.Microb Biotechnol. 2024 Oct;17(10):e70018. doi: 10.1111/1751-7915.70018. Microb Biotechnol. 2024. PMID: 39401032 Free PMC article. Review.
-
The impact of lockdown on nitrogen dioxide (NO2) over Central Asian countries during the COVID-19 pandemic.Environ Sci Pollut Res Int. 2022 Mar;29(13):18923-18931. doi: 10.1007/s11356-021-17140-y. Epub 2021 Oct 27. Environ Sci Pollut Res Int. 2022. PMID: 34705200 Free PMC article.
-
Ambient air pollution and COVID-19 incidence during four 2020-2021 case surges.Environ Res. 2022 May 15;208:112758. doi: 10.1016/j.envres.2022.112758. Epub 2022 Jan 19. Environ Res. 2022. PMID: 35063430 Free PMC article.
-
What are the Effects of Climate Variables on COVID-19 Pandemic? A Systematic Review and Current Update.Adv Biomed Res. 2023 Feb 25;12:33. doi: 10.4103/abr.abr_145_21. eCollection 2023. Adv Biomed Res. 2023. PMID: 37057247 Free PMC article. Review.
References
-
- Ã JSP, Kumar R, Devotta S (2005) Health risks of NO 2 , SPM and SO 2 in Delhi ( India ). 39:6868–6874. 10.1016/j.atmosenv.2005.08.004
-
- As A (2010) Revised National Ambient Air Quality Standards. 826:1–18
-
- Ashikin N, Mabahwi B, Ling O, Leh H, Omar D. Human Health and Wellbeing : Human health effect of air pollution. Procedia Soc Behav Sci. 2014;153:221–229. doi: 10.1016/j.sbspro.2014.10.056. - DOI
-
- Baccini M, Biggeri A, Lagazio C (2007) Parametric and semi-parametric approaches in the analysis of short-term effects of air pollution on health. 51:4324–4336. 10.1016/j.csda.2006.05.026
MeSH terms
Substances
LinkOut - more resources
Full Text Sources
Other Literature Sources
Medical
Miscellaneous

