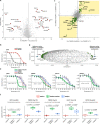
System-wide identification and prioritization of enzyme substrates by thermal analysis
- PMID: 33637753
- PMCID: PMC7910609
- DOI: 10.1038/s41467-021-21540-6
System-wide identification and prioritization of enzyme substrates by thermal analysis
Abstract
Despite the immense importance of enzyme-substrate reactions, there is a lack of general and unbiased tools for identifying and prioritizing substrate proteins that are modified by the enzyme on the structural level. Here we describe a high-throughput unbiased proteomics method called System-wide Identification and prioritization of Enzyme Substrates by Thermal Analysis (SIESTA). The approach assumes that the enzymatic post-translational modification of substrate proteins is likely to change their thermal stability. In our proof-of-concept studies, SIESTA successfully identifies several known and novel substrate candidates for selenoprotein thioredoxin reductase 1, protein kinase B (AKT1) and poly-(ADP-ribose) polymerase-10 systems. Wider application of SIESTA can enhance our understanding of the role of enzymes in homeostasis and disease, opening opportunities to investigate the effect of post-translational modifications on signal transduction and facilitate drug discovery.
Conflict of interest statement
The authors declare no competing interests.
Figures


Similar articles
-
The conserved macrodomains of the non-structural proteins of Chikungunya virus and other pathogenic positive strand RNA viruses function as mono-ADP-ribosylhydrolases.Sci Rep. 2017 Feb 2;7:41746. doi: 10.1038/srep41746. Sci Rep. 2017. PMID: 28150709 Free PMC article.
-
ENPP1 processes protein ADP-ribosylation in vitro.FEBS J. 2016 Sep;283(18):3371-88. doi: 10.1111/febs.13811. Epub 2016 Aug 5. FEBS J. 2016. PMID: 27406238 Free PMC article.
-
Proteomic investigation of phosphorylation sites in poly(ADP-ribose) polymerase-1 and poly(ADP-ribose) glycohydrolase.J Proteome Res. 2009 Feb;8(2):1014-29. doi: 10.1021/pr800810n. J Proteome Res. 2009. PMID: 19105632
-
Reprogramming cellular events by poly(ADP-ribose)-binding proteins.Mol Aspects Med. 2013 Dec;34(6):1066-87. doi: 10.1016/j.mam.2012.12.005. Epub 2012 Dec 23. Mol Aspects Med. 2013. PMID: 23268355 Free PMC article. Review.
-
Towards a structural understanding of PARP1 activation and related signalling ADP-ribosyl-transferases.Curr Opin Struct Biol. 2012 Dec;22(6):721-9. doi: 10.1016/j.sbi.2012.08.005. Epub 2012 Sep 15. Curr Opin Struct Biol. 2012. PMID: 22985748 Review.
Cited by
-
Mutant thermal proteome profiling for characterization of missense protein variants and their associated phenotypes within the proteome.J Biol Chem. 2020 Nov 27;295(48):16219-16238. doi: 10.1074/jbc.RA120.014576. Epub 2020 Sep 2. J Biol Chem. 2020. PMID: 32878984 Free PMC article.
-
Recent advances in isobaric labeling and applications in quantitative proteomics.Proteomics. 2022 Oct;22(19-20):e2100256. doi: 10.1002/pmic.202100256. Epub 2022 Jun 22. Proteomics. 2022. PMID: 35687565 Free PMC article. Review.
-
dbPTM in 2022: an updated database for exploring regulatory networks and functional associations of protein post-translational modifications.Nucleic Acids Res. 2022 Jan 7;50(D1):D471-D479. doi: 10.1093/nar/gkab1017. Nucleic Acids Res. 2022. PMID: 34788852 Free PMC article.
-
PARP10 Multi-Site Auto- and Histone MARylation Visualized by Acid-Urea Gel Electrophoresis.Cells. 2021 Mar 15;10(3):654. doi: 10.3390/cells10030654. Cells. 2021. PMID: 33804157 Free PMC article.
-
Ion-Based Proteome-Integrated Solubility Alteration Assays for Systemwide Profiling of Protein-Molecule Interactions.Anal Chem. 2022 May 17;94(19):7066-7074. doi: 10.1021/acs.analchem.2c00391. Epub 2022 May 4. Anal Chem. 2022. PMID: 35506705 Free PMC article.
References
Publication types
MeSH terms
Substances
LinkOut - more resources
Full Text Sources
Other Literature Sources
Molecular Biology Databases
Miscellaneous

