. 2021 Feb 24;12(1):1265.
doi: 10.1038/s41467-021-21021-w.

Short antisense oligonucleotides alleviate the pleiotropic toxicity of RNA harboring expanded CGG repeats

Affiliations

Short antisense oligonucleotides alleviate the pleiotropic toxicity of RNA harboring expanded CGG repeats

Magdalena Derbis et al. Nat Commun. .

Abstract

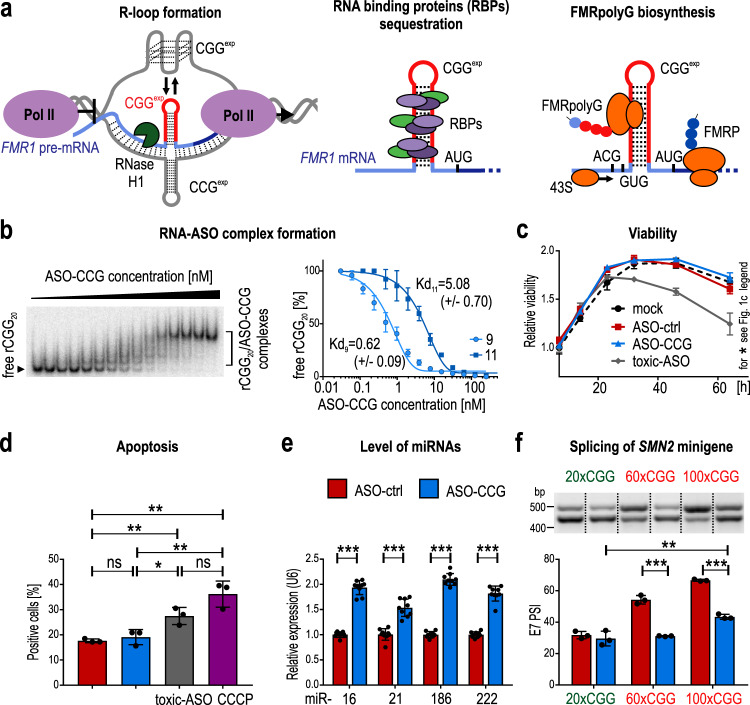
Fragile X-associated tremor/ataxia syndrome (FXTAS) is an incurable neurodegenerative disorder caused by expansion of CGG repeats in the FMR1 5'UTR. The RNA containing expanded CGG repeats (rCGGexp) causes cell damage by interaction with complementary DNA, forming R-loop structures, sequestration of nuclear proteins involved in RNA metabolism and initiation of translation of polyglycine-containing protein (FMRpolyG), which forms nuclear insoluble inclusions. Here we show the therapeutic potential of short antisense oligonucleotide steric blockers (ASOs) targeting directly the rCGGexp. In nuclei of FXTAS cells ASOs affect R-loop formation and correct miRNA biogenesis and alternative splicing, indicating that nuclear proteins are released from toxic sequestration. In cytoplasm, ASOs significantly decrease the biosynthesis and accumulation of FMRpolyG. Delivery of ASO into a brain of FXTAS mouse model reduces formation of inclusions, improves motor behavior and corrects gene expression profile with marginal signs of toxicity after a few weeks from a treatment.


Conflict of interest statement

The authors declare no competing interests.

Figures

Fig. 1
Fig. 1. Binding of ASO–CCG to CGGexp in vitro and in cells reduces the effects of toxic RNA.
a Potential molecular pathomechanisms of FXTAS. b EMSA of the interaction of rCGG20 with ASO–CCGs having 9 and 11 LNA residues. The graph presents means with SDs. N = 3 independent samples for each concentration. Kd, a dissociation constant [nM]. Light blue/dots, 9 nt; dark blue/squares, 11 nt ASO. c Influence of ASOs (9 nt, 200 nM) on COS7 cells viability. Graph presents mean of N = 4 biologically independent samples with the SDs. Black/dots, mock (transfection agent); red/squares, ASO-ctrl; blue/tringles, ASO–CCG; dark gray/diamonds, toxic ASO. For 64-h time point: mock vs ASO-ctrl, P = 0.069; mock vs ASO–CCG, P = 0.187; mock vs toxic ASO, P = 0.0004; ASO-ctrl vs ASO–CCG, P = 0.012; ASO-ctrl vs toxic ASO, P = 0.001; ASO–CCG vs toxic ASO, P = 0.0002. d Influence of ASOs (9 nt, 200 nM) on apoptosis of COS7 cells. Graph presents mean of N = 3 biologically independent samples with the SDs. Dark gray bar, toxic ASO; purple bar, carbonyl cyanide 3-chlorophenylhydrazone (CCCP, positive control). e RT-qPCR quantification of the level of endogenous miRNAs in COS7 cells overexpressing rCGGexp and treated with ASOs (9 nt, 200 nM). Graph presents mean of N = 3 biologically independent samples (each with n = 3 technical replicates) with the SDs. f RT-PCR analysis of SAM68-dependent alternative splicing of exon 7 in SMN2 minigene in COS7 cells overexpressing normal (green) or expanded CGG repeats (red) and treated with ASOs (11 nt, 200 nM). Graph presents mean of N = 3 biologically independent samples with the SDs. 100×CGG ASO-ctrl vs 100×CGG ASO–CCG, P = 0.00002. The upper bands, the exon 7 inclusion isoforms; the lower bands, the exon 7 exclusion isoforms. PSI, the percent of spliced in. b, f Samples were derived from the same experiment and processed in parallel on different gels. Presented gels were cropped. df Red bars, ASO-ctrl; blue bars, ASO–CCG. cf Two-sided, unpaired Student’s t test; *P < 0.05; **P < 0.01; ***P < 0.001; ns, non-significant. bf Source data are provided as a Source Data file.
Fig. 2
Fig. 2. The effect of ASO–CCG on FMRpolyG biosynthesis and aggregation.
a Schematic of the 100×CGG genetic construct. This construct contains the 5′UTR of the FMR1 gene (blue bars) with ~100 CGG repeats (black bar) fused with the GFP coding sequence (green bar). Biosynthesis of the FMRpolyG-GFP via RAN translation starts from the near-cognate start codon, ACG. b Cytometric quantification of the total level of FMRpolyG-GFP in COS7 cells expressing 100xCGG construct and treated with ASOs (11 nt). The fluorescence signal of GFP-positive cells was measured, excluding dead cells stained with propidium iodide. The histogram presents different FMRpolyG-GFP signal distribution in cells treated with ASO-ctrl (red) or ASO–CCG (blue). N = 3 biologically independent samples. ASO-ctrl 200 nM vs ASO–CCG 200 nM, P = 0.000003. c Microscopic quantification of FMRpolyG-GFP inclusions in COS7 cells expressing 100×CGG construct and treated with ASOs (11 nt). Representative images were pseudo-colored and merged; green, GFP-positive inclusions; blue, nuclei stained with Hoechst 33342; scale bars, 50 µm. N = 6 biologically independent samples for ASO-ctrl 200 nM and N = 5 for other conditions. ASO-ctrl 200 nM vs ASO–CCG 200 nM, P = 0.0003. d RT-qPCR quantification of total mRNA from 100xCGG construct in COS7 cells treated with ASOs (9 nt, 200 nM). N = 3 biologically independent samples (each with n = 3 technical replicates). e Association of 100xCGG mRNA with polyribosomes. Extracts from COS7 cells transfected with the 100×CGG construct and 200 nM ASOs (9 nt) were fractionated on a linear sucrose gradient (15–45%). The total RNA was isolated from the collected fractions representing free mRNAs (the first fraction), monoribosomes, and polyribosomes. Cropped gel presents RT-PCR results. The graph presents RT-qPCR results with a mean of n = 3 technical replicates with the SDs. The reference sample is the corresponding fraction in ASO-ctrl-treated cells and the reference gene is GAPDH. The experiment was repeated 2 times with similar results. bd Red bars, ASO-ctrl; blue bars, ASO–CCG; light colors, 100 nM; dark colors, 200 nM. Graphs present means of indicated N with the SDs. Two-sided, unpaired Student’s t test; *P < 0.05; **P < 0.01; ***P < 0.001; ns, non-significant. be Source data are provided as a Source Data file.
Fig. 3
Fig. 3. The effect of ASO–CCG on the FMR1 pre-mRNA, mRNA, and FMRP levels in FXTAS patient-derived fibroblasts.
a Analysis of the total FMR1 mRNA and pre-mRNA levels in fibroblasts treated with ASOs. Fibroblasts were transfected with siRNA against RNase H1 or control siRNA and with ASOs (9 or 11 nt, 200 nM). Graphs present RT-qPCR results for N = 5 biologically independent samples. b Increase in the efficiency of in vitro transcription in the presence of ASO–CCG or RNase H. rCGG100 signal was measured for N = 3 independent samples. c Correlation between R-loop formation and efficiency of transcription of RNA containing CGG100. Graphs present quantification of the fluorescent signal coming from fluorescently labeled ASO–CCG-Cy3 bound to either rCGG100 or R-loop structure for N = 3 independent samples. The area of the gel marked with a red box was exposed to higher laser power strength and the result is presented below the main gel. DNA template was the same as in b, but the observed signal came only from partially single-stranded DNA in the region of CGG/CCG repeats or R-loop bound with ASO–CCG-Cy3. d Cellular distribution of FMR1 mRNA in fibroblasts treated with ASOs (9 nt, 200 nM). Graphs present RT-qPCR results for the cytoplasmic and nuclear fractions for N = 3 biologically independent samples. Results were normalized to GAPDH. e Changes in the steady-state level of FMRP after treatment with ASO–CCG. Fibroblasts were transfected with 200 nM ASOs (9 or 11 nt). The graph presents western blot results for N = 4 biologically independent samples (CGGnorm/- (1) and CGGexp/-) and N = 3 (other cell lines). ae Graphs present means of indicated N with the SDs. a, b, d, e Red bars, ASO-ctrl; blue bars, ASO–CCG. a, d, e The used cell lines contained one allele with a normal CGG repeat length (CGGnorm/-; lines (1), 20 CGG repeats; (2), 31 CGG repeats; (3) and (4)); one allele with a normal CGG repeat length and one allele with CGGexp (CGGnorm/CGGexp); two alleles with CGGexp (CGGexp/CGGexp) and one allele with CGGexp (CGGexp/-). b, c, d Gels were cropped. ae Two-sided, unpaired Student’s t test; *P < 0.05; **P < 0.01; ***P < 0.001; ns, non-significant. Source data are provided as a Source Data file.
Fig. 4
Fig. 4. The effect of ASO–CCG on behavioral and molecular phenotypes in the FXTAS mouse model.
a Representative image showing the distribution of ASO–CCG-Cy3 (red; 200 nM) in COS7 cells. ASO entered cells in the absence of a carrier. Blue, stained nuclei; scale bar, 20 µm. The experiment was repeated two times with similar results. b Experimental design for DOX induction (red) and ASO–CCG delivery (blue) into P90CGG mice. The contents of the osmotic pump (ASO–CCG (11 nt) solution or saline) were delivered into the right lateral ventricle via intracerebroventricular infusion (~550 µg of ASO–CCG per mouse). c Training session for the rotarod test. Mice treated with saline and ASO–CCG were subjected to a 3-day rotarod test starting with a training session performed at 15 rpm constant speed (day 1). No differences were observed between groups. d Constant speed rotarod test. On day 2, the above-mentioned mice were subjected to a constant speed rotarod test at different speeds (x axis; rpm, revolution per minute). The ASO–CCG-treated group stayed longer on the rod, P = 0.0323. e Accelerating rotarod test. On day 3, mice were subjected to an accelerating rotarod test (4–40 rpm ramp). The ASO–CCG-treated group showed better performance on this test (longer latency to fall), P = 0.0003. Dashed line, maximum cutoff c, d 60 s, e 300 s. f Quantification of FMRpolyG foci in P90CGG mice. A representative image of FMRpolyG staining, sections containing cerebellar lobule X of P90CGG mice was stained using the 8FM antibody specific for FMRpolyG (scale bar, 10 µm). For the ASO–CCG-treated group, the percentage of the nuclei with positive staining for FMRpolyG (red) was lower (P = 0.0161) and the size of the inclusions they contain (indicated by a white arrow) were smaller (P = 0.0146) than that of the saline-treated group. Graphs present means with SDs. a, f Images were pseudo-colored and merged. c, d Two-way repeated-measures ANOVA (treatment effect): *P < 0.05. e, f Two-sided, unpaired Student’s t test: *P < 0.05; ***P < 0.001. ce Graphs present means with SEMs. cf Gray dots/bars, saline-treated animals (N = 6); blue squares/bars, ASO–CCG treated animals (N = 7). Source data are provided as a Source Data file.
Fig. 5
Fig. 5. Beneficial and adverse effects of ASO–CCG (11 nt) at a molecular level in an FXTAS mouse model.
a, b DE, results based on differential gene expression analysis of the RNA-seq data. adj.P.Val, P value generated using moderated t-statistic and adjusted for multiple testing using Benjamini–Hochberg’s method. a Plot, DE for striatum of control, saline- or ASO–CCG-treated P90CGG mice (N = 4 per group). On the x axis, the log2 fold change in the expression levels of the 416 genes (one outlier gene, Gm20425, was excluded from analysis), that were significantly changed (adj.P.Val < 0.05) in saline-treated P90CGG mice compared to control mice is plotted. On the y axis, the log2 fold change in the gene expression levels of the same genes compared between ASO–CCG- and the saline-treated group is plotted. A general restoration of the expression levels towards the levels in control mice was observed in the ASO–CCG-treated group (red line, negative Pearson correlation with r = −0.75 and P < 0.001). Bar graphs, gene ontology analysis of genes extracted from DE for striatal tissue according to the following parameters: average expression value >1 and adj.P.Val ≤ 0.05. Significantly upregulated and downregulated genes were analyzed for the saline vs control (gray) and ASO–CCG vs control groups (blue). Red line, P = 0.01 in Fisher’s exact test with Bonferroni correction for multiple testing. b Analysis of expression changes in genes containing CGG repeats in ASO–CCG-treated P90CGG mice. DE for the cortex of saline- or ASO–CCG-treated P90CGG mice (N = 4 for each group). A global comparison of gene expression between these two groups of mice showed a significant increase in the expression of 22 genes containing at least 6 CGG repeats (red line) compared to all analyzed genes (black line; P < 0.001, two-tailed Mann–Whitney test). Moreover, in the list of genes showing significant expression changes between these two groups (adj.P.Val < 0.05), genes containing ≥ 6 CGG repeats were enriched 13-fold relative to the expected level. c Steady-state level of proteins encoded by genes carrying short CGG repeats in 5′UTRs in the cortex of saline- and ASO–CCG-treated P90CGG mice. N = 4 animals. The CGG repeat length is specified for each gene. d RT-qPCR of immune system-related genes in the cortex of P90CGG mice. N = 4 animals. e Steady-state level of immune system-related toxicity markers in P90CGG mice. Hippocampus: GFAP, CD68, N = 6 animals. Samples were derived from the same experiment and processed in parallel on different gels. Cortex: AIF1, N = 4 animals. c, e Western blot. All blots were cropped. ce Gray bars, saline-; blue bars, ASO–CCG-treated animals. Graphs present means of indicated N, with the SDs. Two-tailed unpaired Student’s t test, **P < 0.01; ***P < 0.001; P > 0.05, ns, non-significant. ad Source data are provided as a Source Data file.

Similar articles

Cited by

References

    1. Hagerman RJ, et al. Fragile X syndrome. Nat. Rev. Dis. Prim. 2017;3:17065. doi: 10.1038/nrdp.2017.65. - DOI - PubMed
    1. Hagerman RJ, et al. Intention tremor, parkinsonism, and generalized brain atrophy in male carriers of fragile X. Neurology. 2001;57:127–130. doi: 10.1212/WNL.57.1.127. - DOI - PubMed
    1. Hagerman RJ, Hagerman P. Fragile X-associated tremor/ataxia syndrome-features, mechanisms and management. Nat. Rev. Neurol. 2016;12:403–412. doi: 10.1038/nrneurol.2016.82. - DOI - PubMed
    1. Glineburg MR, Todd PK, Charlet-Berguerand N, Sellier C. Repeat-associated non-AUG (RAN) translation and other molecular mechanisms in Fragile X Tremor Ataxia syndrome. Brain Res. 2018;1693:43–54. doi: 10.1016/j.brainres.2018.02.006. - DOI - PMC - PubMed
    1. Tassone F, et al. Elevated levels of FMR1 mRNA carrier males: a new mechanism of involvement in the fragile-X syndrome. Am. J. Hum. Genet. 2000;66:6–15. doi: 10.1086/302720. - DOI - PMC - PubMed

Publication types

MeSH terms

Supplementary concepts