. 2021 Feb 18;11(1):4087.
doi: 10.1038/s41598-021-82388-w.

Cerebrospinal fluid proteome shows disrupted neuronal development in multiple sclerosis

Affiliations

Cerebrospinal fluid proteome shows disrupted neuronal development in multiple sclerosis

Ellen F Mosleth et al. Sci Rep. .

Abstract

Despite intensive research, the aetiology of multiple sclerosis (MS) remains unknown. Cerebrospinal fluid proteomics has the potential to reveal mechanisms of MS pathogenesis, but analyses must account for disease heterogeneity. We previously reported explorative multivariate analysis by hierarchical clustering of proteomics data of MS patients and controls, which resulted in two groups of individuals. Grouping reflected increased levels of intrathecal inflammatory response proteins and decreased levels of proteins involved in neural development in one group relative to the other group. MS patients and controls were present in both groups. Here we reanalysed these data and we also reanalysed data from an independent cohort of patients diagnosed with clinically isolated syndrome (CIS), who have symptoms of MS without evidence of dissemination in space and/or time. Some, but not all, CIS patients had intrathecal inflammation. The analyses reported here identified a common protein signature of MS/CIS that was not linked to elevated intrathecal inflammation. The signature included low levels of complement proteins, semaphorin-7A, reelin, neural cell adhesion molecules, inter-alpha-trypsin inhibitor heavy chain H2, transforming growth factor beta 1, follistatin-related protein 1, malate dehydrogenase 1 cytoplasmic, plasma retinol-binding protein, biotinidase, and transferrin, all known to play roles in neural development. Low levels of these proteins suggest that MS/CIS patients suffer from abnormally low oxidative capacity that results in disrupted neural development from an early stage of the disease.


Conflict of interest statement

The authors declare no competing interests.

Figures

Figure 1
Figure 1
Cohorts 1 and 2. Design of the study. (a–c) Cohort 1: In our previous study of this material the 101 individuals in this cohort were separated based on proteome patterns into two groups here called groups A and B. (a) The data of this cohort is considered as influenced by two “pseudofactors”: Group A versus group B and MS versus control, resulting in four combinations of group affiliation and MS status. The four categories of individuals led to a two-factorial design for analyses. The numbers of individuals in each category are indicated in circles. (b) Confidence intervals of differences between the groups were analysed within MS patients and within controls. (c) Confidence intervals of the differences between MS patients and controls were performed within both groups. (d and e) Cohort 2: In analogy to cohort 1, two groups were established. Group A are the IgG-negative individuals. (d) For this cohort three combinations of group affiliation and CIS status were present. (e) Confidence intervals of the differences in the proteome patterns between CIS and controls were performed within group A.
Figure 2
Figure 2
Cohort 1. Bar plots of IgGs significant by confidence intervals (95%) of the proteome for group A versus group B as analysed within MS patients and within controls. Each bar is the mean of one protein for one of the four categories: controls in group A (Group A, Ctrl, blue bars, n = 55), MS patients in group A (Group A, MS, blue bars, n = 7), controls in group B (Group B, Ctrl, red bars, n = 9), and MS patients in group B (Group B, MS red bars, n = 30). The identities of these IgG proteins are given in Supplementary Table S2. The y-axis is the abundance levels expressed as z-scores obtained by subtracting means and dividing by standard deviation.
Figure 3
Figure 3
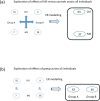
Cohort 1. Schematic description of ER modelling. The data are considered as two-pseudofactors, each on two levels, and the impact of one factor is omitted during exploration of the other. ER modelling allows data on all controls and all MS patients to be combined in multivariate analyses to identify (a) a disease-associated proteome pattern as well as (b) the proteome signature that drives group affiliation.
Figure 4
Figure 4
Cohort 1. Bar plots of proteins significant for MS versus controls by confidence intervals (95%) applied within group A and within group B. Each bar is means of one protein for each of the four categories: controls in group A (Group A, Ctrl, blue bars, n = 55), MS patients group A (Group A, MS, blue bars, n = 7), controls in group B (Group B, Ctrl, red bars, n = 9), and MS patients in group B (Group B, MS, red bars, n = 30). The protein identities are given in Supplementary Table S2. The y-axes are the abundance levels expressed as z-scores obtained by subtracting means and dividing by standard deviations. (a) Means of the data, (b) means of ER values of group affiliation obtained by ER modelling where impact of MS status is omitted to isolate the effects of group, and (c) means of ER values of MS status obtained by ER modelling where the impact of group affiliation is omitted to isolate effects of disease. The effects of group (panel b) plus the effects of MS status (panel c) gives predicted values (panel a). Importantly, the comparison of MS versus controls when group affiliation is ignored (as in panel a) is dominated by the most frequent categories, which are controls in group A (the blue bars to the left, n = 55) and MS patients in group B (the red bar to the right, n = 30), with the consequence that the lower abundance of these proteins for MS versus controls within group is not observed. Comparisons of MS versus controls based on ER values (displayed in panel c), which isolate the MS-specific effects, revealed the lower expression of these proteins for MS patients compared with controls without confounding impact of group affiliation.
Figure 5
Figure 5
Cohort 1 and 2. (a) Confidence intervals (95%) of proteins selected by Martens’ uncertainly test in PLS-DA of the data from both cohorts. Confidence intervals are made on the merged data where the data table of ER values of MS status from cohort 1 are combined with the data of group A of cohort 2 into a single table of 163 individuals. The thick lines are the means, and the grey lines are the confidence borders. (b) Means of females (orange) and males (blue) and means of all (black). The protein names are provided in Supplementary Table S2 and S4.
Figure 6
Figure 6
Four categories were considered based on disease status (MS versus controls) and group affiliation (group A and group B). The signature of intrathecal inflammation is simplified here by indicating only the immune cells. (a) Individuals without MS/CIS and without active intrathecal inflammation. (b) Individuals without MS/CIS with active elevated intrathecal inflammation. (c) MS/CIS patients without active intrathecal inflammation. (d) MS/CIS patients with active elevated intrathecal inflammation. Artwork performed by Kristiane Færgestad.
Figure 7
Figure 7
Normal neural development and function require oxidative capacity. (a) Requirement for oxidative capacity under normal neural development and homeostasis. (b) Loss of oxidative redox potential may be present from the early event in the pathogenesis of MS. We hypothesize that MS is a disease of disrupted neuronal development and homeostasis leading to the typical pathological characteristics of MS, and that inflammation is secondary. The signature of intrathecal inflammation is simplified here by indicating only the immune cells. Artwork performed by Kristiane Færgestad.
Figure 8
Figure 8
The ER modelling approach applied to precision medicine. In the present study we separated the participants into groups based on abundance of molecular markers and then analysed the data both within each group and across all participants using ER modelling to isolate the effects of group and to identify a disease-specific protein pattern. ER modelling can be utilized for precision medicine on group level to optimize therapy for patients in each group and to guide personalised medicine decisions within groups and likewise for other heterogenous data.

Similar articles

Cited by

References

    1. Thompson AJ, et al. Diagnosis of multiple sclerosis: 2017 revisions of the McDonald criteria. Lancet Neurol. 2018;17:162–173. doi: 10.1016/s1474-4422(17)30470-2. - DOI - PubMed
    1. Chung KK, et al. A 30-year clinical and magnetic resonance imaging observational study of multiple sclerosis and clinically isolated syndromes. Ann. Neurol. 2020;87:63–74. doi: 10.1002/ana.25637. - DOI - PMC - PubMed
    1. Dobson R, Giovannoni G. Multiple sclerosis: a review. Eur. J. Neurol. 2019;26:27–40. doi: 10.1111/ene.13819. - DOI - PubMed
    1. Miller D, Barkhof F, Montalban X, Thompson A, Filippi M. Clinically isolated syndromes suggestive of multiple sclerosis, part 1: natural history, pathogenesis, diagnosis, and prognosis. Lancet Neurol. 2005;4:281–288. doi: 10.1016/s1474-4422(05)70071-5. - DOI - PubMed
    1. Tsunoda I, Fujinami RS. Inside-out versus outside-in models for virus induced demyelination: axonal damage triggering demyelination. Springer Semin. Immunopathol. 2002;24:105–125. doi: 10.1007/s00281-002-0105-z. - DOI - PMC - PubMed

Publication types