. 2020 Dec;25(4):417-432.
doi: 10.1007/s10911-021-09479-2. Epub 2021 Feb 15.

Characterizing the Tumor Immune Microenvironment with Tyramide-Based Multiplex Immunofluorescence

Affiliations

Characterizing the Tumor Immune Microenvironment with Tyramide-Based Multiplex Immunofluorescence

Hidetoshi Mori et al. J Mammary Gland Biol Neoplasia. 2020 Dec.

Abstract

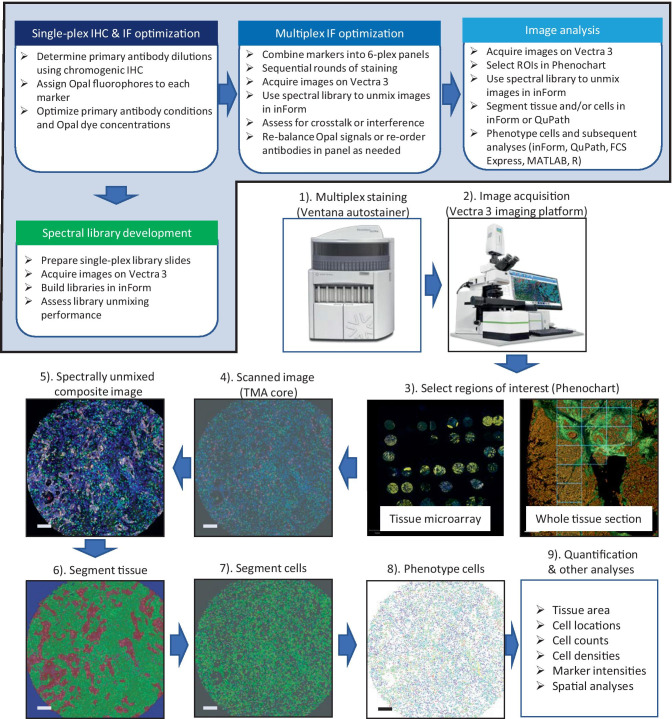
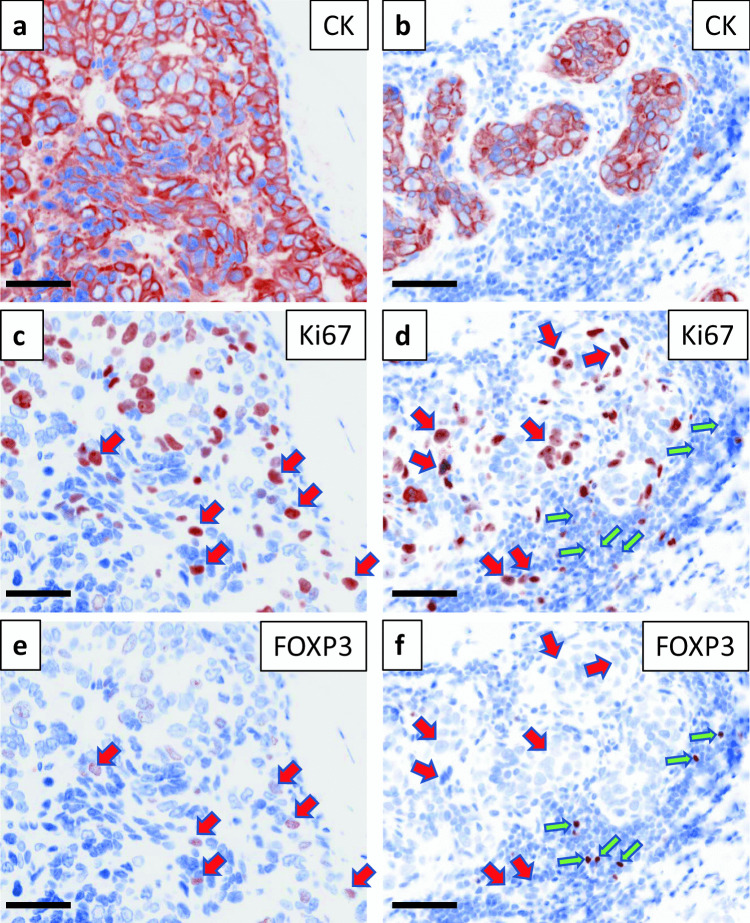
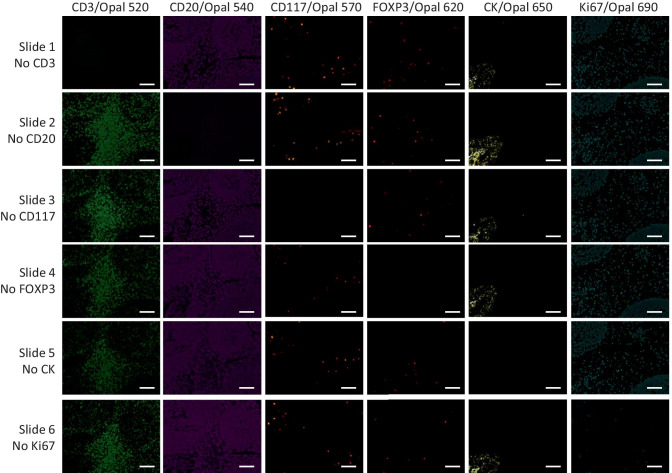
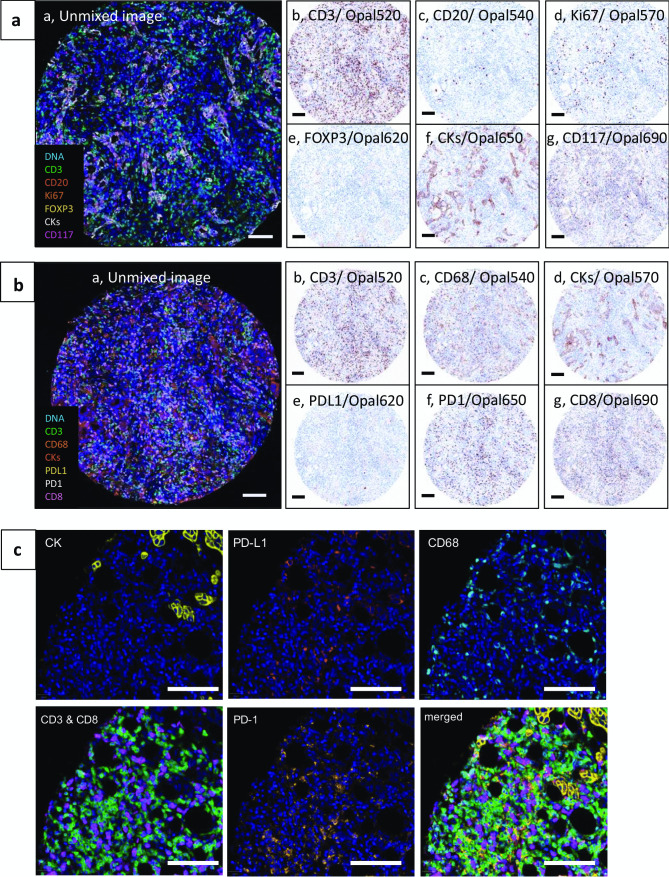
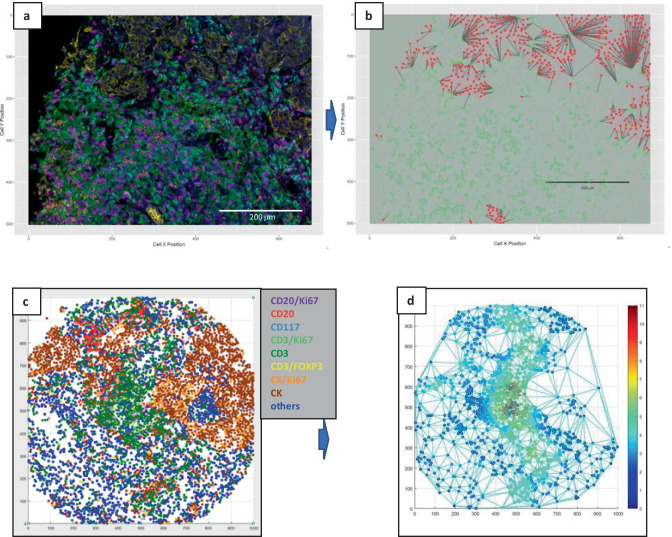
Multiplex immunofluorescence (mIF) allows simultaneous antibody-based detection of multiple markers with a nuclear counterstain on a single tissue section. Recent studies have demonstrated that mIF is becoming an important tool for immune profiling the tumor microenvironment, further advancing our understanding of the interplay between cancer and the immune system, and identifying predictive biomarkers of response to immunotherapy. Expediting mIF discoveries is leading to improved diagnostic panels, whereas it is important that mIF protocols be standardized to facilitate their transition into clinical use. Manual processing of sections for mIF is time consuming and a potential source of variability across numerous samples. To increase reproducibility and throughput we demonstrate the use of an automated slide stainer for mIF incorporating tyramide signal amplification (TSA). We describe two panels aimed at characterizing the tumor immune microenvironment. Panel 1 included CD3, CD20, CD117, FOXP3, Ki67, pancytokeratins (CK), and DAPI, and Panel 2 included CD3, CD8, CD68, PD-1, PD-L1, CK, and DAPI. Primary antibodies were first tested by standard immunohistochemistry and single-plex IF, then multiplex panels were developed and images were obtained using a Vectra 3.0 multispectral imaging system. Various methods for image analysis (identifying cell types, determining cell densities, characterizing cell-cell associations) are outlined. These mIF protocols will be invaluable tools for immune profiling the tumor microenvironment.

Keywords: Breast cancer; Immune cells; Immunohistochemistry; Multiplex.


Figures

Fig. 1
Fig. 1
Workflow for multiplex immunofluorescence panel optimization and image analysis. The top flow diagram highlights the mIF panel optimization steps, from single-plex IHC & IF optimization to spectral library development, multiplex IF optimization, and image analysis. The lower flow diagram highlights the steps used for image acquisition and analysis. (1) Whole slides containing tumor tissue or tissue microarrays were stained on a Ventana Discovery Ultra platform. (2) Stained slides were scanned with the Vectra 3 at low magnification (4x or 10x). (3) Regions of interest were selected in Phenochart on tissue microarray (TMA) or whole tissue section. (4) High-resolution acquisition (20x) of ROIs. (5) Images obtained were imported into inForm and spectrally unmixed using a previously optimized spectral library. (6) Using inForm’s (or QuPath) trainable tissue segmentation algorithms, images were segmented into tumor, stroma, and no tissue regions. (7) Using inForm (or QuPath), nuclei were identified and cell segmentation was performed. (8) Cells were phenotyped based on the labeling of markers in each mIF panel. (9) Data of individual cells derived from phenotyping in inForm, QuPath, or FCS Express were exported for further analyses. Scale bar on each TMA core is 100 µm
Fig. 2
Fig. 2
Spectral bleed through in IP1 resolved by changing antibody-Opal dye pairings. Panels a, c, and e show staining of a breast cancer section with IP1 in which Ki67 was paired with Opal 570 and FOXP3 was paired with Opal 620. As indicated by the red arrows, most of the Ki67 positive cells were showing up as FOXP3 positive cells, indicating spectral bleed over or incomplete stripping of the Ki67 antibody. Panels b, d, and f show the results of a redesigned IP1 in which Ki67 swapped positions and Opal pairing with CD117 yielding Ki67/Opal 690 and CD117/Opal 570 (with FOXP3 remaining paired with Opal 620). The red arrows highlight some cells that are Ki67+ and FOXP3- and the green arrows highlight some cells that are FOXP3+ and Ki67-. Scale bars are 50 µm
Fig. 3
Fig. 3
Leave-one-out control stains for IP1. Six serial sections from human tonsil FFPE tissue were prepared and stained with the full IP1 protocol. Each row represents images from a slide in which one primary antibody was left out of the staining protocol (ex. Row 1, Slide 1, no CD3 had anti-CD3 left out). Each image in a row shows the staining pattern for the antibody/fluorophore combination shown at the top, with all other channels turned off. The absence of spectral bleed through or inadequate antibody stripping issues are indicated by the lack of signal in the images along the diagonal (top left to bottom right). Scale bars are 100 µm
Fig. 4
Fig. 4
Representative examples of mIF with IP1 and IP2 on tumor tissue. A human bronchial airway biopsy TMA was stained with mIF panels IP1 A and IP2 B. Composite images from a representative core, pseudo-colored as indicated in the legends, are shown in panels Aa and Ba. Pathology views from inForm (positive signal = brown, DAPI counterstain = blue) for each individual marker are shown in panels b-g. Scale bars are 100 µm. C A human breast cancer tissue stained with IP2 illustrating the co-localization of PD-1+ T cells with PD-L1+ macrophages. Each image is of the same region of the tissue with only the indicated marker’s channels turned on. Merged: CK (yellow), CD3 (green), CD8 (magenta), CD68 (cyan), PD-1 (orange), PD-L1 (red), DAPI (blue). Scale bars are 100 µm
Fig. 5
Fig. 5
A comparison of areas from a breast cancer tissue demonstrating differences in densities of immune cells. Panels a & b: Unmixed composite images from two ROIs selected from two different areas of a breast cancer tissue (see Supplementary Figure 3) stained with IP1 (CK/white, CD3/green, CD20/yellow, CD117/red and DAPI/blue are indicated). Panels c & d: Tissue segmentation of a and b showing tumor (red), stroma (green), and no tissue (blue) areas. Scale bars are 100 µm. (e) Cell densities of proliferating tumor cells (CK+Ki67+) and non-proliferating tumor cells (CK+Ki67-) within the tumor segmented regions across the entire tissue (T) or just within area 1 or area 2 as indicated. (f) Cell densities of various immune cell populations within the tumor or stroma segmented regions across the entire tissue (T) or just within area 1 or area 2 as indicated. For both Panels e and f, each dot represents the cell density within one ROI. Horizontal lines indicate mean values. Student’s T test: *p<0.05, **p<0.01
Fig. 6
Fig. 6
Cell phenotyping using inForm vs QuPath. Multispectral images from a TMA core stained with IP1 were unmixed in inForm (a) and converted to a multilayered TIFF file that was analyzed in QuPath (b). Scale bars are 100 µm. (c) Phenotype map generated in inForm. (d)Phenotype map created in MATLAB using phenotypes generated in QuPath. (e) Pie chart showing the distribution of various cell types as determined from inForm phenotyping. (f) Pie chart showing the distribution of various cell types as determined from QuPath phenotyping
Fig. 7
Fig. 7
Cell phenotyping using gating strategies in FCS Express. (a) Unmixed composite image of a breast cancer tissue stained with IP1. (b) Contour plot of cell size vs. CD3 mean fluorescence generated from inForm data that were imported into FCS Express. A T cell gate (green rectangle) was manually drawn around the CD3+ cell population. (c) CD3 vs. FOXP3 contour plot of gated T cells from b. A Treg gate (red) was manually drawn around the FOXP3+ cell population. (d) Masks of gated cells (T cells in green, Treg cells in red) overlaid on a grayscale image of the nuclear DAPI channel. Scale bars are 100 µm
Fig. 8
Fig. 8
Heatmap clustering of immune cells in different regions of a breast cancer sample. A breast cancer tissue sample was stained with mIF panels IP1 and IP2 and analyzed using inForm. Selection of ROIs from this sample is shown in Supplementary Figure 4. The heatmap panel a shows the relative densities of various cell populations, where each row represents data from one ROI and each column is a cell population within the tumor or stroma compartments as indicated along the bottom. Unsupervised clustering yielded 3 main clusters as indicated on the left. ROIs were annotated as invasive ductal carcinoma (IDC), ductal carcinoma in situ (DCIS), or normal. A representative ROI composite image from each of the different annotations and their corresponding row in the heatmap is shown in panels b, c, and d. CD3 (green), CD68 (magenta), CK (white), and DAPI (blue) are highlighted
Fig. 9
Fig. 9
Spatial profiling of cells within the tumor microenvironment. (a) Unmixed composite image of a breast cancer sample stained with mIF panel IP2 (CK/yellow, CD3/green, CD8/magenta, CD68/cyan, PD-1/orange, PD-L1/red, DAPI/blue). b Nearest neighbor analysis of a using phenoptr R package. Line segments are drawn from each tumor cell (red dots) to its nearest CD8+ T cell (green dots). Scale bars are 200 µm for (a) and (b). c Phenotype map created in MATLAB from IP1 staining of a TMA phenotyped in QuPath. d Delaunay triangulation neighborhood plot for CD3+ T cells from c (each dot represents a T cell) overlaid with a heatmap representing the density of Treg cells within 100 µm of each T cell

Similar articles

Cited by

References

    1. Marin-Acevedo JA, Dholaria B, Soyano AE, Knutson KL, Chumsri S, Lou Y. Next generation of immune checkpoint therapy in cancer: new developments and challenges. J Hematol Oncol. 2018;11(1):39. doi: 10.1186/s13045-018-0582-8. - DOI - PMC - PubMed
    1. Schreiber RD, Old LJ, Smyth MJ. Cancer immunoediting: integrating immunity's roles in cancer suppression and promotion. Science. 2011;331(6024):1565–1570. doi: 10.1126/science.1203486. - DOI - PubMed
    1. Stack EC, Wang C, Roman KA, Hoyt CC. Multiplexed immunohistochemistry, imaging, and quantitation: a review, with an assessment of Tyramide signal amplification, multispectral imaging and multiplex analysis. Methods. 2014;70(1):46–58. doi: 10.1016/j.ymeth.2014.08.016. - DOI - PubMed
    1. Bobrow MN, Harris TD, Shaughnessy KJ, Litt GJ. Catalyzed reporter deposition, a novel method of signal amplification. Application to immunoassays. J Immunol Methods. 1989;125(1–2):279–285. doi: 10.1016/0022-1759(89)90104-x. - DOI - PubMed
    1. Speel EJ, Hopman AH, Komminoth P. Amplification methods to increase the sensitivity of in situ hybridization: play card(s) J Histochem Cytochem. 1999;47(3):281–288. doi: 10.1177/002215549904700302. - DOI - PubMed

Publication types

MeSH terms