. 2021 Jan 29:10:599087.
doi: 10.3389/fcimb.2020.599087. eCollection 2020.

Metabolomics Exploration of Pseudorabies Virus Reprogramming Metabolic Profiles of PK-15 Cells to Enhance Viral Replication

Affiliations

Metabolomics Exploration of Pseudorabies Virus Reprogramming Metabolic Profiles of PK-15 Cells to Enhance Viral Replication

Hongchao Gou et al. Front Cell Infect Microbiol. .

Abstract

For viral replication to occur in host cells, low-molecular-weight metabolites are necessary for virion assembly. Recently, metabolomics has shown great promise in uncovering the highly complex mechanisms associated with virus-host interactions. In this study, the metabolic networks in PK-15 cells infected with a variant virulent or classical attenuated pseudorabies virus (PRV) strains were explored using gas chromatography-mass spectrometry (GC-MS) analysis. Although total numbers of metabolites whose levels were altered by infection with the variant virulent strain or the classical attenuated strain were different at 8 and 16 h post infection (hpi), the predicted levels of differential metabolic components were shown to be associated with specific pathways, including glycolysis as well as amino acid and nucleotide metabolism. The glucose depletion and glycolysis inhibitors 2DG and oxamate could reduce the level of PRV replication in PK-15 cells. In addition, the inhibition of the pentose phosphate pathway (PPP) resulted in an obvious decline of viral titers, but the prevention of oxidative phosphorylation in the tricarboxylic acid (TCA) cycle had a minimal effect on viral replication. Glutamine starvation resulted in the decline of viral titers, which could be restored by supplemental addition in the culture media. However, inhibition of glutaminase (GLS) activity or the supplement of 2-ketoglutarate into glutamine-deleted DMEM did not alter PRV replication in PK-15 cells. The results of the current study indicate that PRV reprograms the metabolic activities of PK-15 cells. The metabolic flux from glycolysis, PPP and glutamine metabolism to nucleotide biosynthesis was essential for PRV to enhance its replication. This study will help to identify the biochemical materials utilized by PRV replication in host cells, and this knowledge can aid in developing new antiviral strategies.

Keywords: PK-15 cells; classical attenuated strain; metabolic activity; metabolomics; pseudorabies virus (PRV); variant virulent strain.


Conflict of interest statement

The authors declare that the research was conducted in the absence of any commercial or financial relationships that could be construed as a potential conflict of interest.

Figures

Figure 1
Figure 1
(A) Growth kinetics of the variant virulent and classical attenuated pseudorabies virus (PRV) strains. PK-15 cells were infected with the variant virulent (GD-WH) or classical attenuated (Bartha) PRV strains (MOI = 10), and the growth kinetics of each strain was analyzed as described in the Materials and Methods (mean ± SD; n=3; *P < 0.5; *** P < 0.001). P values were calculated using two-way ANOVA. (B) Cytopathic effects of PK-15 cells infected with the variant virulent or classical attenuated PRV strains at 24 hpi. PK-15 cells were infected with the variant virulent (GD-WH) or classical attenuated (Bartha) PRV strains (MOI=10). At 24 hpi, the cytopathic effects of PRV infection of PK-15 cells were observed (scale bars=400 μm).
Figure 2
Figure 2
Principal component analysis (PCA) of gas chromatography-mass spectrometry (GC-MS) spectra. (A) Multivariate analysis of GC-MS spectra of metabolites using the PCA model. (B) Three-dimensional trajectory analysis of the PCA score plots. In all images, W8 and W16 represent the groups infected with the variant virulent (GD-WH) strain; B8 and B16 represent the groups infected with the classical attenuated (Bartha) strain; M8 and M16 represent the mock groups, and QC represents the quality control group.
Figure 3
Figure 3
Heatmap visualization of differential metabolites in PK-15 cells infected with the variant virulent (A, B) or classical attenuated (C, D) PRV strains at 8 and 16 hpi. Rows: metabolites; columns: samples. The color from red (positive value) to green (negative value) of each rectangle was based on the ratio between pseudorabies virus (PRV)-infected groups vs mock groups. For example, a red color means that the average mass response of the metabolite in PRV-infected groups was greater than that in mock groups. In all images, W8 and W16 represent the groups infected with the variant virulent (GD-WH) strain; B8 and B16 represent the groups infected with the classical attenuated (Bartha) strain, and M8 and M16 represent the mock groups.
Figure 4
Figure 4
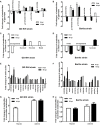
Statistical analysis of fold change of differential metabolites in PK-15 cells infected with the variant virulent (A, C, E, G) or classical attenuated (B, D, F, H) pseudorabies virus (PRV) strains at 8 and 16 hpi (mean ± SD; n=4). Fold change was calculated as a binary logarithm of the average mass response (normalized peak area) ratio between PRV-infected groups vs mock groups, where a positive value means that the average mass response of the metabolite in PRV-infected groups was greater than that in mock groups.
Figure 5
Figure 5
Inhibition of the glycolysis reduced the replication of pseudorabies virus (PRV) in PK-15 cells. (A) The effect of 2-deoxyglucose (2DG) treatment on the virus titers in PK-15 cells infected with the variant virulent PRV strain. PK-15 cells were pretreated with 10 or 20 mM 2DG for 3 h. Then, cells were infected with PRV GD-WH strain at an multiplicity of infection (MOI) of 1 and cultured in Dulbecco’s modified Eagle medium (DMEM) containing 10 or 20 mM 2DG. At 16 hpi, the titers of virus were analyzed as described in Materials and Methods (mean ± SD; n=3; ** P<0.01; *** P < 0.001). P values were calculated by using an unpaired Student’s t-test. (B) The effect of 2DG treatment on the cell viability of PK-15 cells. The cell viability of PK-15 cells treated with 10 and 20 mM 2DG was analyzed by the CCK8 assay as described in Materials and Methods (mean ± SD; n=3; NSP>0.05). (C) Glucose depletion or oxamate treatment decreased PRV titers in PK-15 cells. PK-15 cells were starved by be cultured in depletion DMEM repleted with 2 mM L-glutamine or pretreated with 50 mM oxamate for 3 h. Then cells were infected with PRV GD-WH strain at a MOI of 1. After being cultured in depletion DMEM repleted with 2 mM L-glutamine or DMEM containing 50 mM oxamate for 16 h, virus titers were analyzed as described in Materials and Methods (mean ± SD; n = 3; * P < 0.05; ** P < 0.01; *** P < 0.001). P values were calculated by using an unpaired Student’s t-test. (D) The effect of oxamate treatment on the cell viability of PK-15 cells. The cell viability of PK-15cells starved by glucose depletion or treated with oxamate for 16 h were analyzed by the CCK8 assay as described in Materials and Methods (mean ± SD; n = 3; NS P > 0.05).
Figure 6
Figure 6
The effect of the TCA cycle and pentose phosphate pathway (PPP) on pseudorabies virus (PRV) replication in PK-15 cells. (A) The effect of oligomycin A or 6-AN treatment on PRV replication. PK-15 cells were pretreated with 1 μM Oligomycin A or 500 μM 6-AN for 3 h. Then cells were infected with PRV GD-WH strain at a MOI of 1 and cultured in DMEM containing 1 μM Oligomycin A or 500 μM 6-AN. At 16 hpi, the titers of virus were analyzed as described in Materials and Methods (mean ± SD; n = 3; * P < 0.05; *** P < 0.001). P values were calculated by using an unpaired Student’s t-test. (B) The effect of Oligomycin A or 6-AN treatment on the cell viability of PK-15 cells. The cell viability of PK-15 cells treated with 1 μM Oligomycin A or 500 μM 6-AN were analyzed by the CCK8 assay as described in Materials and Methods (mean ± SD; n = 3; NSP > 0.05).
Figure 7
Figure 7
Depletion of glutamine reduced pseudorabies virus (PRV) replication in PK-15 cells in a manner independent of the TCA cycle. (A) Glutamine starvation had a repressive effect on PRV replication in PK-15 cells. PK-15 cells were starved by being cultured in glutamine-free DMEM for 3 h. Then, cells were infected with PRV GD-WH strain at an multiplicity of infection (MOI) of 1 and cultured in normal Dulbecco’s modified Eagle medium (DMEM) or no glutamine DMEM. In replenishment groups, 2 or 4 mM L-glutamine was added to glutamine-free DMEM. At 16 h, the titers of virus were analyzed as described in Materials and Methods (mean ± SD; n=3; * P<0.05; ** P<0.01; *** P < 0.001). P values were calculated by using an unpaired Student’s t-test. (B) BPTES treatment had no effect on PRV replication in PK-15 cells. PK-15 cells were pretreated with 1 μM BPTES for 3 h. Then cells were infected with PRV GD-WH strain at a MOI of 1 and cultured in DMEM containing 1 μM BPTES. At 16 hpi, the titers of virus were analyzed as described in Materials and Methods (mean ± SD; n = 3; NSP > 0.05; **P < 0.01). P values were calculated by using an unpaired Student’s t-test. (C) The effect of BPTES treatment on the cell viability of PK-15 cells. The cell viability of PK-15cells treated with 1 μM BPTES were analyzed by the CCK8 assay as described in Materials and Methods (mean ± SD; n = 3; NSP > 0.05). (C) 2-ketoglutarate supplement cannot recover the effect of glutamine starvation on PRV replication in PK-15 cells. PK-15 cells were starved by being cultured in no glutamine DMEM for 3 h. Then cells were infected with PRV GD-WH strain at a MOI of 1 and cultured in normal DMEM or no glutamine DMEM. In 2-ketoglutarate supplement groups, 5 mM 2-ketoglutarate was added in no glutamine DMEM. At 16 h, the titers of virus were analyzed as described in Materials and Methods (mean ± SD; n = 3; NSP > 0.05). P values were calculated by using an unpaired Student’s t-test.
Figure 8
Figure 8
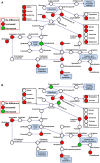
Schematic overview of metabolic pathways in PK-15 cells infected by different pseudorabies virus (PRV) strains at 8 (A) and 16 (B) hpi. The metabolites are shown in different colors according to their changes: red indicates increased metabolites; green indicates decreased metabolites, and white indicates no difference metabolites.

Similar articles

Cited by

References

    1. Abrantes J. L., Alves C. M., Costa J., Almeida F. C., Sola-Penna M., Fontes C. F., et al. (2012). Herpes simplex type 1 activates glycolysis through engagement of the enzyme 6-phosphofructo-1-kinase (PFK-1). Biochim. Biophys. Acta 1822 (8), 1198–1206. 10.1016/j.bbadis.2012.04.011 - DOI - PubMed
    1. Amador-Noguez D., Feng X. J., Fan J., Roquet N., Rabitz H., Rabinowitz J. D. (2010). Systems-level metabolic flux profiling elucidates a complete, bifurcated tricarboxylic acid cycle in Clostridium acetobutylicum. J. Bacteriol. 192 (17), 4452–4461. 10.1128/JB.00490-10 - DOI - PMC - PubMed
    1. Birungi G., Chen S. M., Loy B. P., Ng M. L., Li S. F. (2010). Metabolomics approach for investigation of effects of dengue virus infection using the EA.hy926 cell line. J. Proteome Res. 9 (12), 6523–6534. 10.1021/pr100727m - DOI - PubMed
    1. Bogani F., Chua C. N., Boehmer P. E. (2009). Reconstitution of uracil DNA glycosylase-initiated base excision repair in herpes simplex virus-1. J. Biol. Chem. 284 (25), 16784–16790. 10.1074/jbc.M109.010413 - DOI - PMC - PubMed
    1. Bogani F., Corredeira I., Fernandez V., Sattler U., Rutvisuttinunt W., Defais M., et al. (2010). Association between the herpes simplex virus-1 DNA polymerase and uracil DNA glycosylase. J. Biol. Chem. 285 (36), 27664–27672. 10.1074/jbc.M110.131235 - DOI - PMC - PubMed

Publication types

LinkOut - more resources