. 2021 Feb 9;10(2):359.
doi: 10.3390/cells10020359.

Retrograde and Anterograde Transport of Lat-Vesicles during the Immunological Synapse Formation: Defining the Finely-Tuned Mechanism

Affiliations

Retrograde and Anterograde Transport of Lat-Vesicles during the Immunological Synapse Formation: Defining the Finely-Tuned Mechanism

Juan José Saez et al. Cells. .

Abstract

LAT is an important player of the signaling cascade induced by TCR activation. This adapter molecule is present at the plasma membrane of T lymphocytes and more abundantly in intracellular compartments. Upon T cell activation the intracellular pool of LAT is recruited to the immune synapse (IS). We previously described two pathways controlling LAT trafficking: retrograde transport from endosomes to the TGN, and anterograde traffic from the Golgi to the IS. We address the specific role of four proteins, the GTPase Rab6, the t-SNARE syntaxin-16, the v-SNARE VAMP7 and the golgin GMAP210, in each pathway. Using different methods (endocytosis and Golgi trap assays, confocal and TIRF microscopy, TCR-signalosome pull down) we show that syntaxin-16 is regulating the retrograde transport of LAT whereas VAMP7 is regulating the anterograde transport. Moreover, GMAP210 and Rab6, known to contribute to both pathways, are in our cellular context, specifically and respectively, involved in anterograde and retrograde transport of LAT. Altogether, our data describe how retrograde and anterograde pathways coordinate LAT enrichment at the IS and point to the Golgi as a central hub for the polarized recruitment of LAT to the IS. The role that this finely-tuned transport of signaling molecules plays in T-cell activation is discussed.

Keywords: LAT; T-cell activation; immune synapse.


Conflict of interest statement

The authors declare no conflict of interest.

Figures

Figure 1
Figure 1
Total and endocytosed LAT are recruited to IS with similar kinetic. (A) Endocytosed LAT assay: Jurkat cells expressing a chimeric LAT protein tagged in its extracellular domain with HA (HA-LAT-Jurkat) were labeled at 4 °C for 30 min with a mouse anti-HA Ab, washed and then incubated at 37 °C for 4 h to allow LAT endocytosis. (B) Confocal images showing total (left panel) or endocytosed LAT (right panel) recruitment at the immune synapse (IS). Non-transduced Jurkat or HA-LAT-Jurkat cells after endocytosed LAT assay, were activated with SEE pulsed Raji B cells at different time points. Immunolabelings were performed using anti-mouse Ig (Alexa Fluor 568) to label the anti-HA Ab or anti-LAT to label total LAT. (C) Average cell representation and (D) quantification of the enrichment of total and endocytic LAT at the immune synapse (depicted by the dotted white line) in Jurkat T cells interacting with Raji B cells and activated with SEE for different time points. n = number of cells constituting the mean image. Horizontal lines represent the median. Scale bars = 5 μm. Two-way ANOVA *** p < 0.001, **** p < 0.0001, ns: nonsignificant. Data and images are from two independent experiments in (BD).
Figure 2
Figure 2
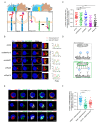
Retrograde and anterograde pathways regulate the recruitment of endocytic pool of LAT at the IS. (A) Confocal images of HA-LAT-Jurkat cells transduced with nontargeting control shRNA (shRNA Ctrl) or GMAP210/VAMP7/Rab6/Synt16-targeting shRNAs, fixed before (left panel, 0 h) or after endocytosed LAT assay (right panel, 4 h) and stained for endocytosed LAT (HA-LAT, red) and the Golgi apparatus marker Giantin (green). (B) Confocal images of conjugates between HA-LAT-Jurkat cells (after endocytosed LAT assay) expressing control (Ctrl) or GMAP210/VAMP7/Rab6/Synt16 specific shRNA, and SEE pulsed Raji cells (blue), labeled with anti-Giantin (green) and anti-mouse 568 (red). (C) Average cell representation and (D) quantification of the enrichment of endocytosed LAT at the immune synapse (depicted by the dotted white line) in control or GMAP210/VAMP7/Rab6/Synt16 silenced cells incubated with unpulsed (−, unactivated state) or SEE pulsed (+, immune synapse formation) Raji cells for 30 min. n = number of cells constituting the mean image. Horizontal lines represent the median. Images in (A,B) show the z-projection of summed slices from three stacks covering the Golgi apparatus in T cells. Scale bars = 5 μm. Two-way ANOVA ** p < 0.01, **** p < 0.0001, ns: nonsignificant. Data and images are from two independent experiments in (A) and from three independent experiments (BD)
Figure 3
Figure 3
Anterograde, but not retrograde, pathway regulators are recruited together with LAT at the immune synapse. (A) Still images from live TIRFM imaging of Jurkat cells co-expressing LAT-mCherry and GMAP210-GFP, VAMP7-GFP or Rab6-GFP, seeded on coverslips coated with anti-CD3ε+anti-CD28 Abs. Pearson correlation coefficient is shown (Mean ± SD). Dashed square indicate the magnified regions. Arrow heads point out the appearance and displacement in the evanescent field of vesicles-containing simultaneous or individual LAT and GMAP210/VAMP7 or Rab6, respectively. Scale bars = 5 μm. Inset scale bars = 2 μm. (B) Immunoblot of signalosomes prepared from Jurkat cells activated for 5, 10 or 15 min with anti-CD3ε+anti-CD28 coated magnetic beads. IgG corresponds to Jurkat cells incubated with irrelevant mAb coated magnetic beads for 15 min. Proteins attached to the beads were purified by magnetic sorting after freezing and thawing the cells. Presence of the different proteins in the corresponding cell lysates (with detergent) are shown in “input” lanes. Data and images represent two independent experiments in (A,B).
Figure 4
Figure 4
GMAP210 and VAMP7 do not regulate the retrograde pathway. (A) SNAP trap assay: Jurkat cells expressing GalT-GFP-SNAP and HA-LAT were stained at 4 °C with anti-HA Ab, washed, and incubated at 4 °C with BG-PEG9-NHS. After washing, cells were activated on slides for 30 min with Raji cells pulsed with SEE. Endocytosed membrane proteins, coupled with BG, covalently bound to the SNAP domain of the GalT-GFP-SNAP protein getting trapped in the Golgi. (B) Confocal images of SNAP trap assay in Jurkat cells expressing GalT-GFP-SNAP, HA-LAT and control (Ctrl) or GMAP210/VAMP7/Rab6/Synt16 specific shRNA. Labelings were performed using anti-mouse Ig (Alexa Fluor 568) to label the anti-HA Ab and anti-GFP to label the GalT-GFP-SNAP. Dashed square points to the inset localization containing the Golgi apparatus. Dashed line indicates where HA-LAT (red) and GalT-GFP-SNAP fluorescence signal intensity was measured for the plot. Images show the z-projection of summed slices from three stacks covering the Golgi apparatus. Scale bars = 5 μm. Inset scale bars = 1 μm. (C) Quantification of Mander’s overlapping coefficient of GalT-GFP-SNAP over HA-LAT. (D), Mitochondrial trapping assay: Jurkat cells expressing a chimeric GFP tagged GMAP210 protein with the C-terminal hydrophobic anchor of ActA can capture vesicles interacting with GMAP210 in the mitochondria. (E) Confocal images showing the localization of VAMP7, Rab6 or Synt16 (red) in Jurkat cells expressing a GFP-GMAP210-ActA chimera (GMAP-Mit, green), treated for 4 h with nocodazol (5 μg/mL) (nucleus in blue and mitochondria in gray). Scale bar 5 μm. (F) Quantification of Mander’s overlapping coefficient of GMAP-Mit with VAMP7, Rab6 or Synt16. Each dot represents one cell; horizontal lines represent the geomean. **** p < 0.0001, ns: nonsignificant (Kruskwal−Wallis test). Data and images represent one experiment in (C,D) and two independent experiments in (E,F).
Figure 5
Figure 5
Schematic summary: retrograde and anterograde pathways coordinate the delivery of vesicles containing LAT to the immune synapse. LAT constitutively recycles from the plasma membrane to early/recycling endosomes. Vesicles from this compartment undergo a retrograde transport to the Golgi apparatus, which is increased upon TCR activation. Rab6 and Syntaxin-16 (inset), control specifically this retrograde transport. Once in the Golgi, the anterograde pathway delivers LAT to the IS. In this second step, LAT meets in the Golgi the vesicular SNARE VAMP7 and GMAP210 sorts, captures and brings the LAT/VAMP7 vesicles to the immune synapse.

Similar articles

Cited by

References

    1. Grakoui A., Bromley S.K., Sumen C., Davis M.M., Shaw A.S., Allen P.M., Dustin M.L. The immunological synapse: A molecular machine controlling T cell activation. Science. 1999;285:221–227. doi: 10.1126/science.285.5425.221. - DOI - PubMed
    1. Monks C.R.F., Freiberg B.A., Kupfer H., Sciaky N., Kupfer A. Three-dimensional segregation of supramolecular activation clusters in T cells. Nature. 1998;395:82–86. doi: 10.1038/25764. - DOI - PubMed
    1. Dustin M.L., Choudhuri K. Signaling and Polarized Communication Across the T Cell Immunological Synapse. Annu. Rev. Cell Dev. Biol. 2016;32:303–325. doi: 10.1146/annurev-cellbio-100814-125330. - DOI - PubMed
    1. Huse M., Lillemeier B.F., Kuhns M.S., Chen D.S., Davis M.M. T cells use two directionally distinct pathways for cytokine secretion. Nat. Immunol. 2006;7:247–255. doi: 10.1038/ni1304. - DOI - PubMed
    1. Chemin K., Bohineust A., Dogniaux S., Tourret M., Guégan S., Miró-Mur F., Hivroz C. Cytokine Secretion by CD4+ T Cells at the Immunological Synapse Requires Cdc42-Dependent Local Actin Remodeling but Not Microtubule Organizing Center Polarity. J. Immunol. 2012;189:2159–2168. doi: 10.4049/jimmunol.1200156. - DOI - PubMed

Publication types

LinkOut - more resources