. 2021 Mar 24;41(12):2615-2629.
doi: 10.1523/JNEUROSCI.2240-20.2021. Epub 2021 Feb 9.

Functional P2X7 Receptors in the Auditory Nerve of Hearing Rodents Localize Exclusively to Peripheral Glia

Affiliations

Functional P2X7 Receptors in the Auditory Nerve of Hearing Rodents Localize Exclusively to Peripheral Glia

Silvia Prades et al. J Neurosci. .

Abstract

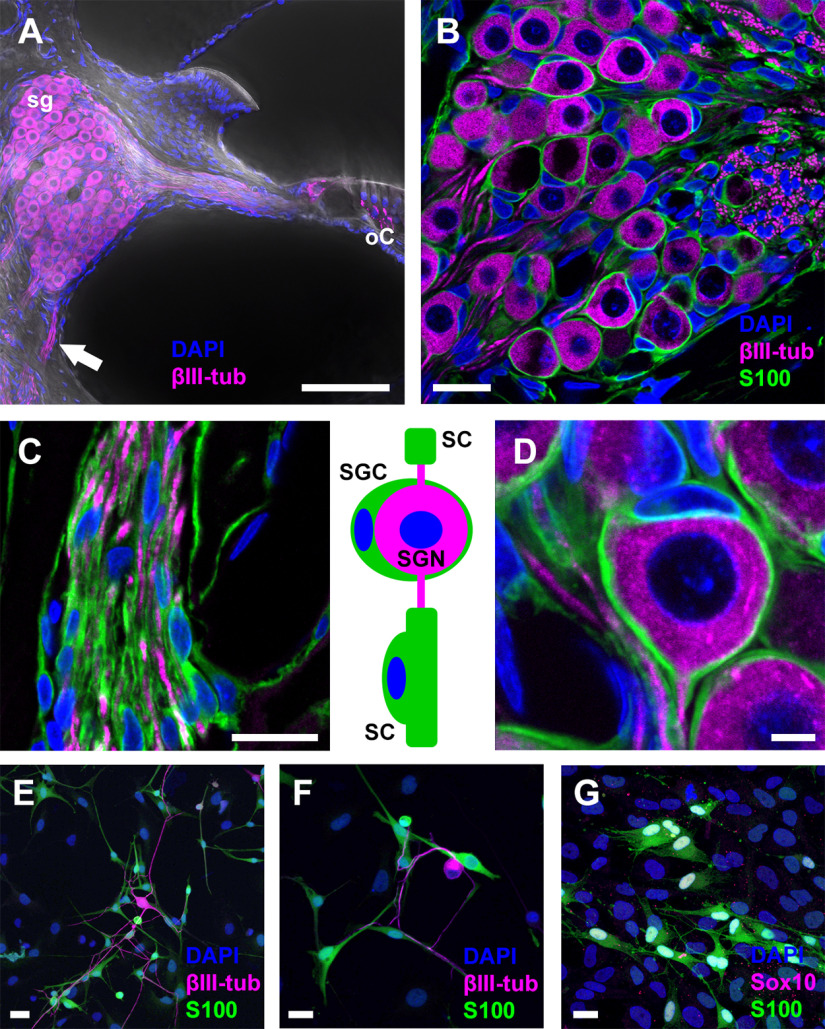
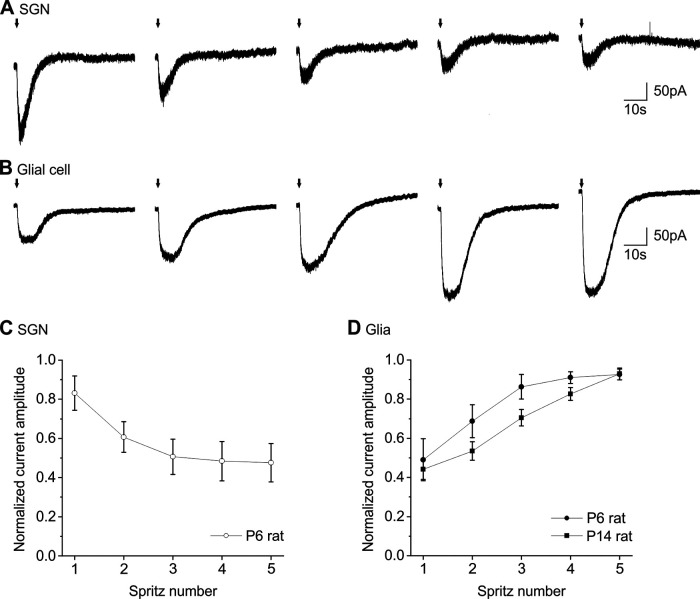
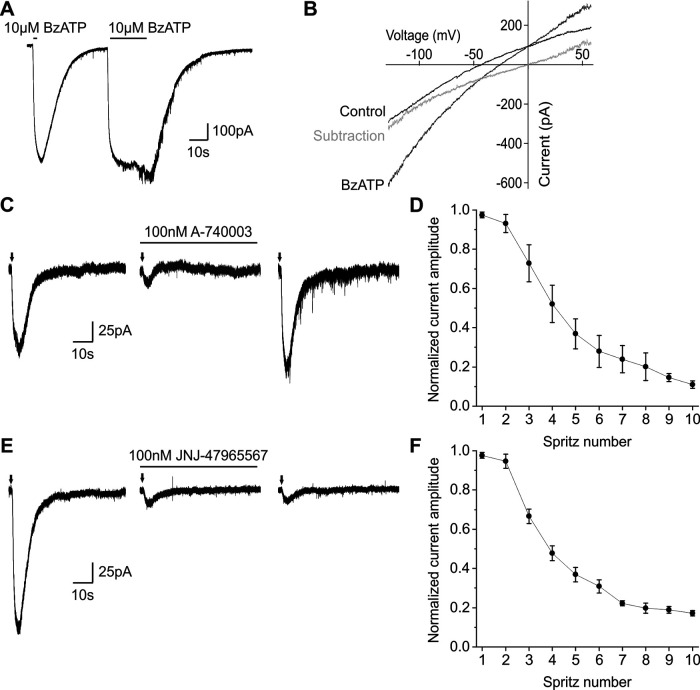
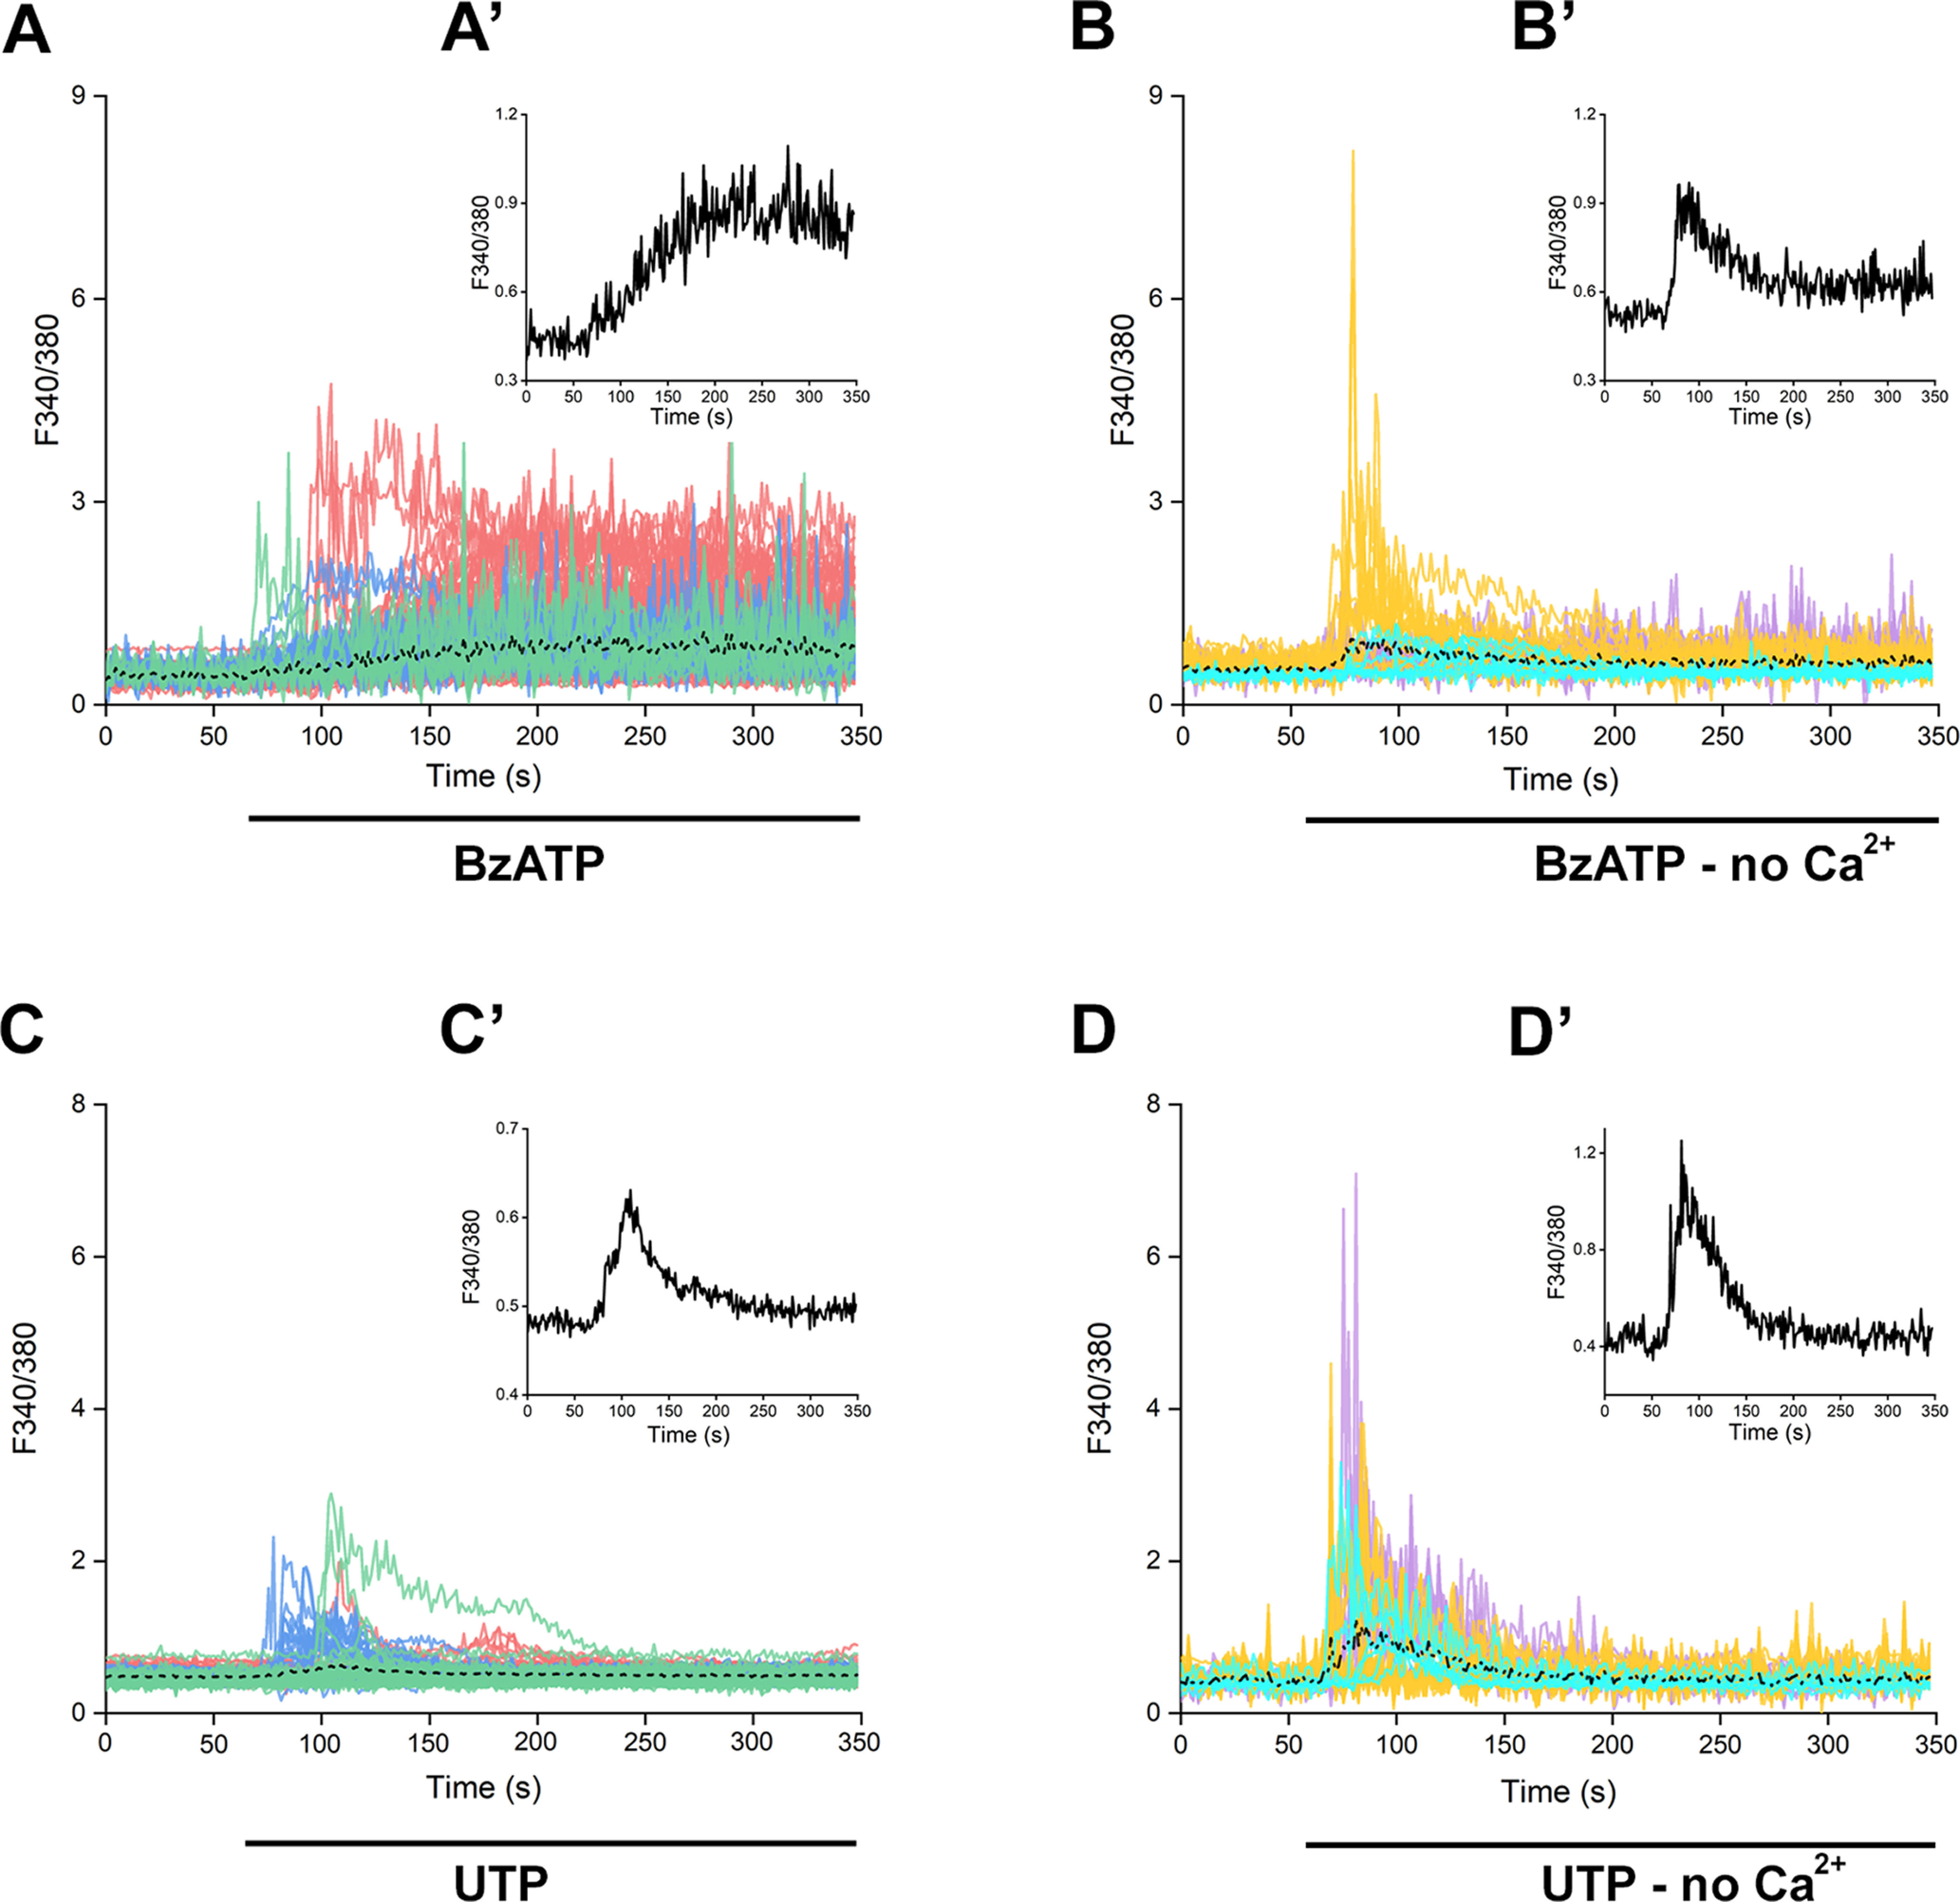
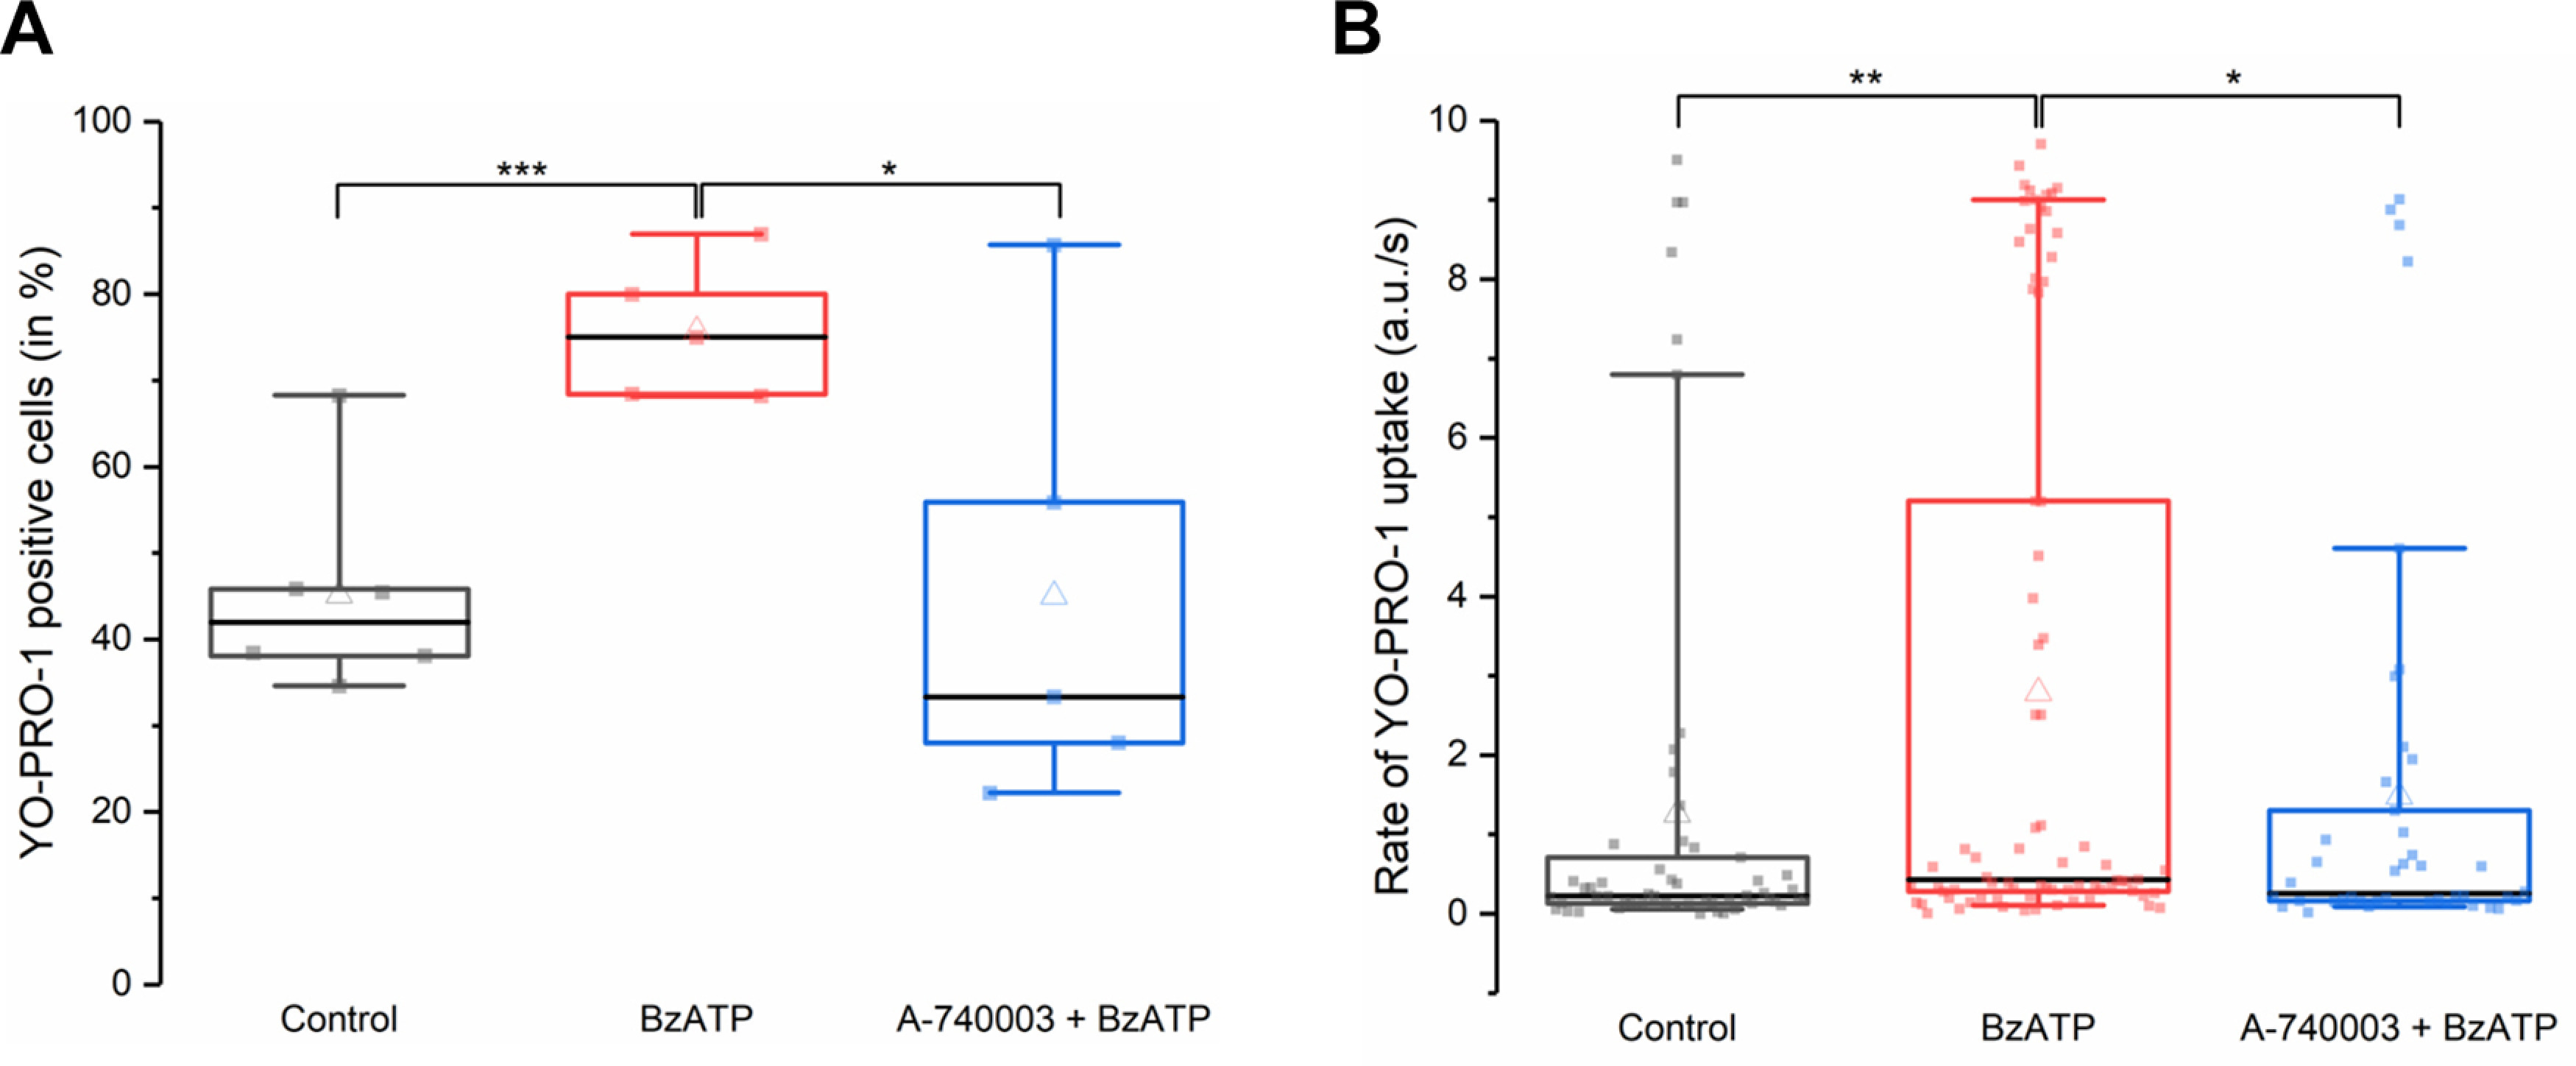
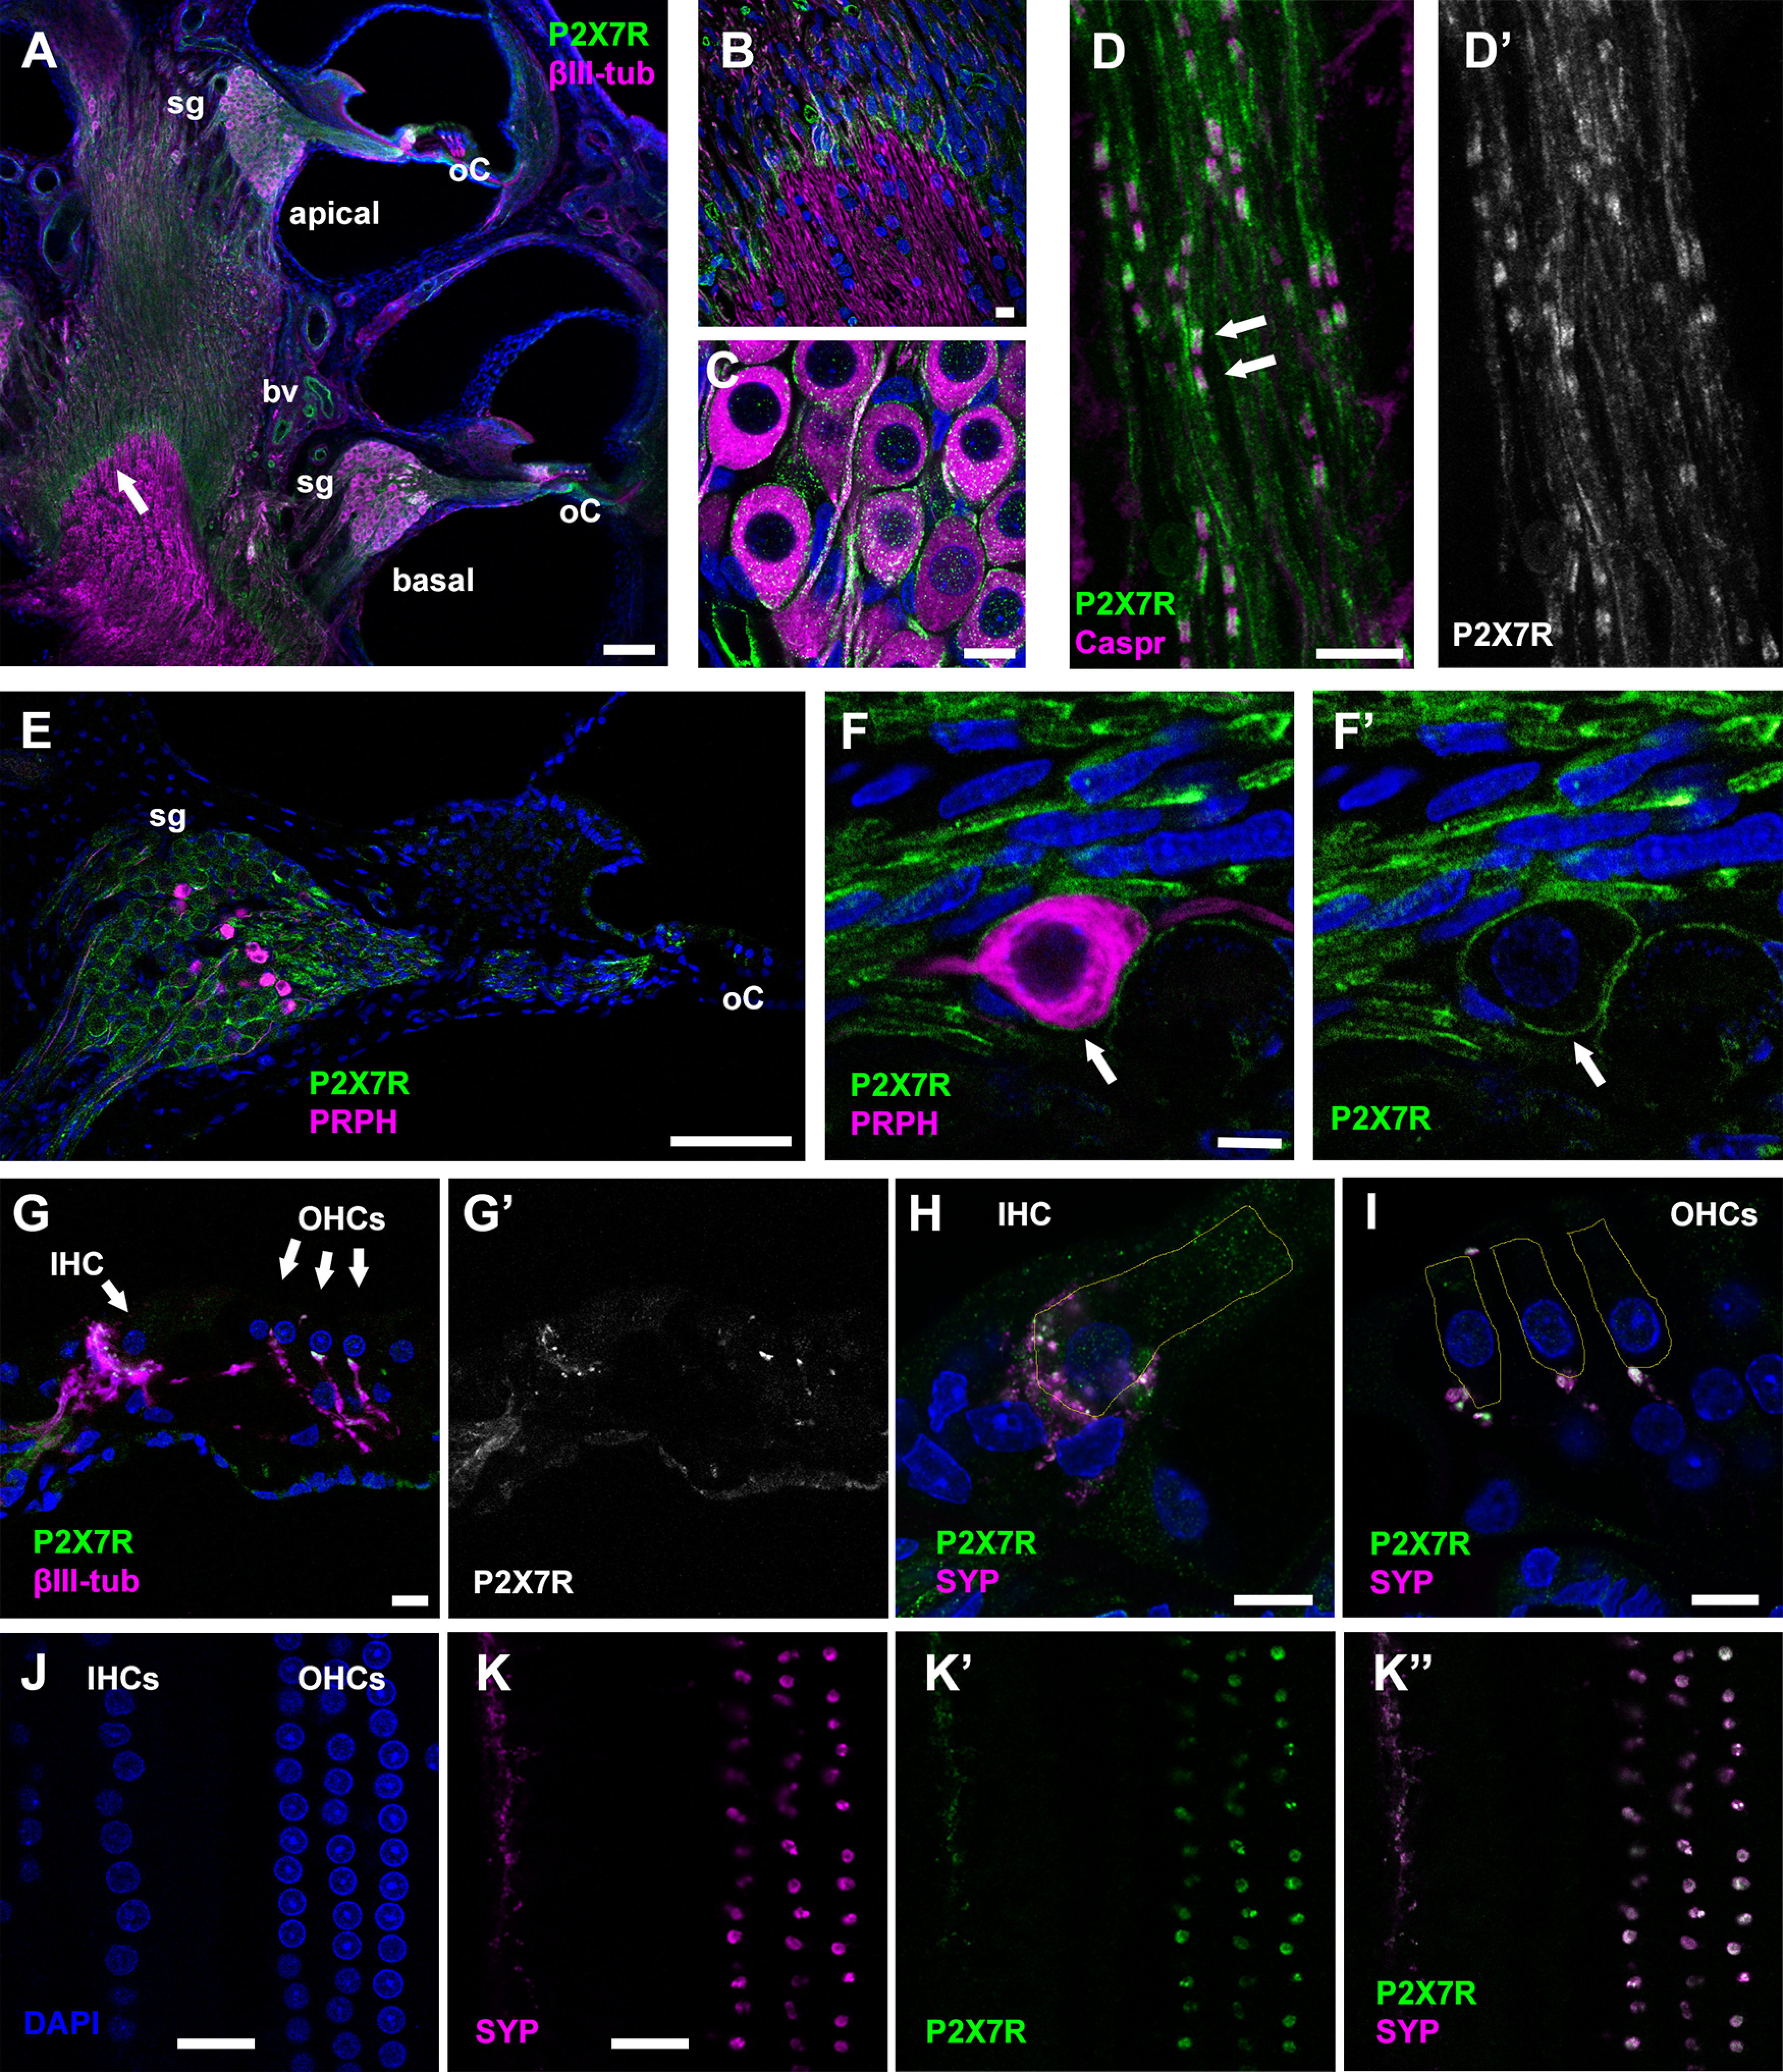
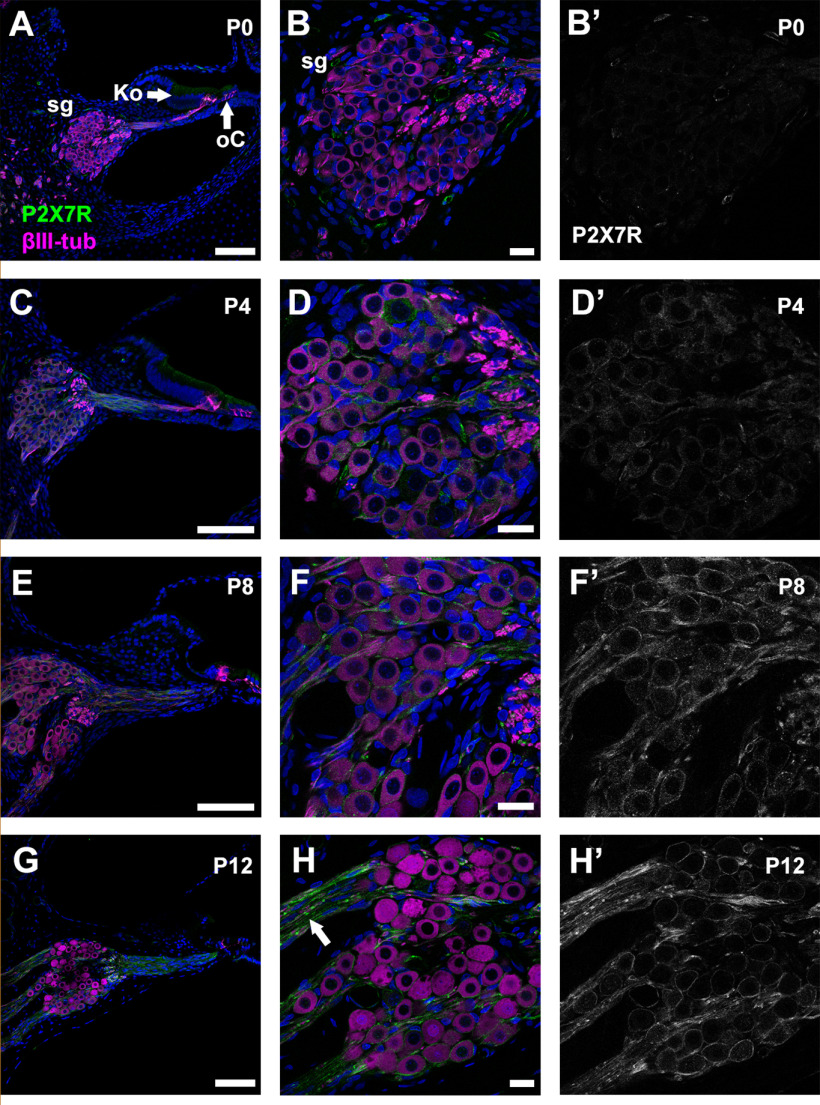
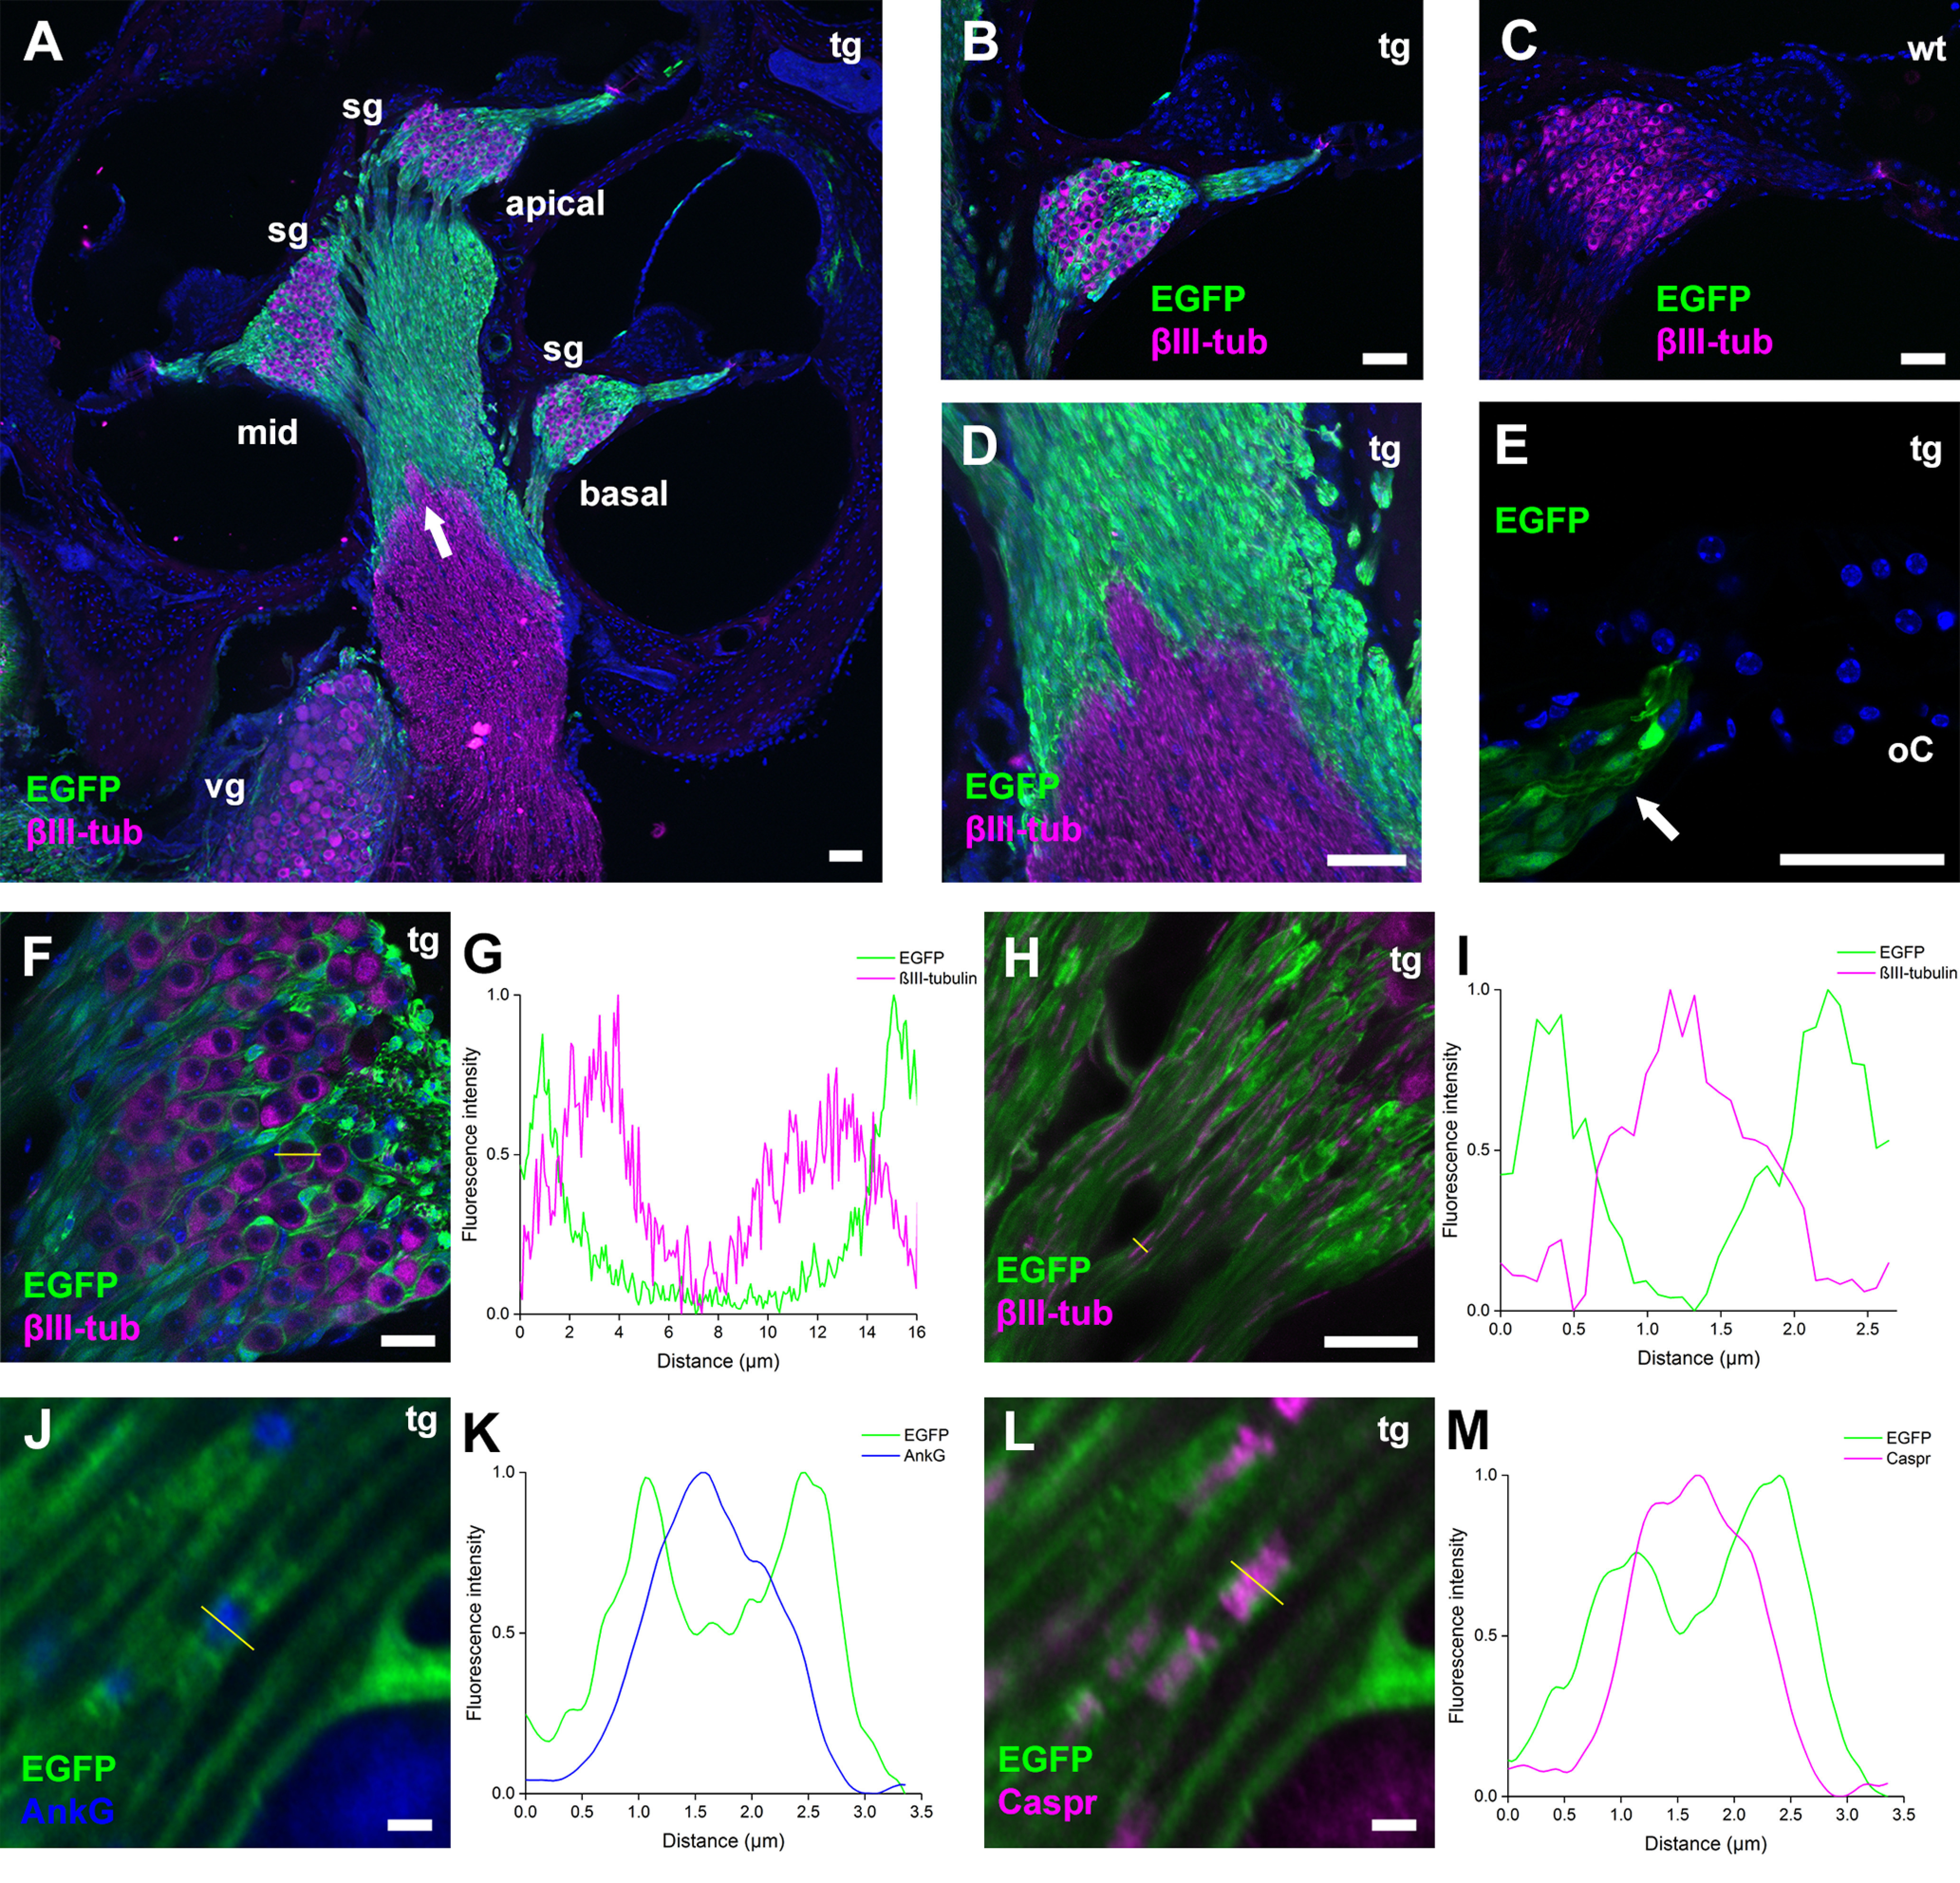
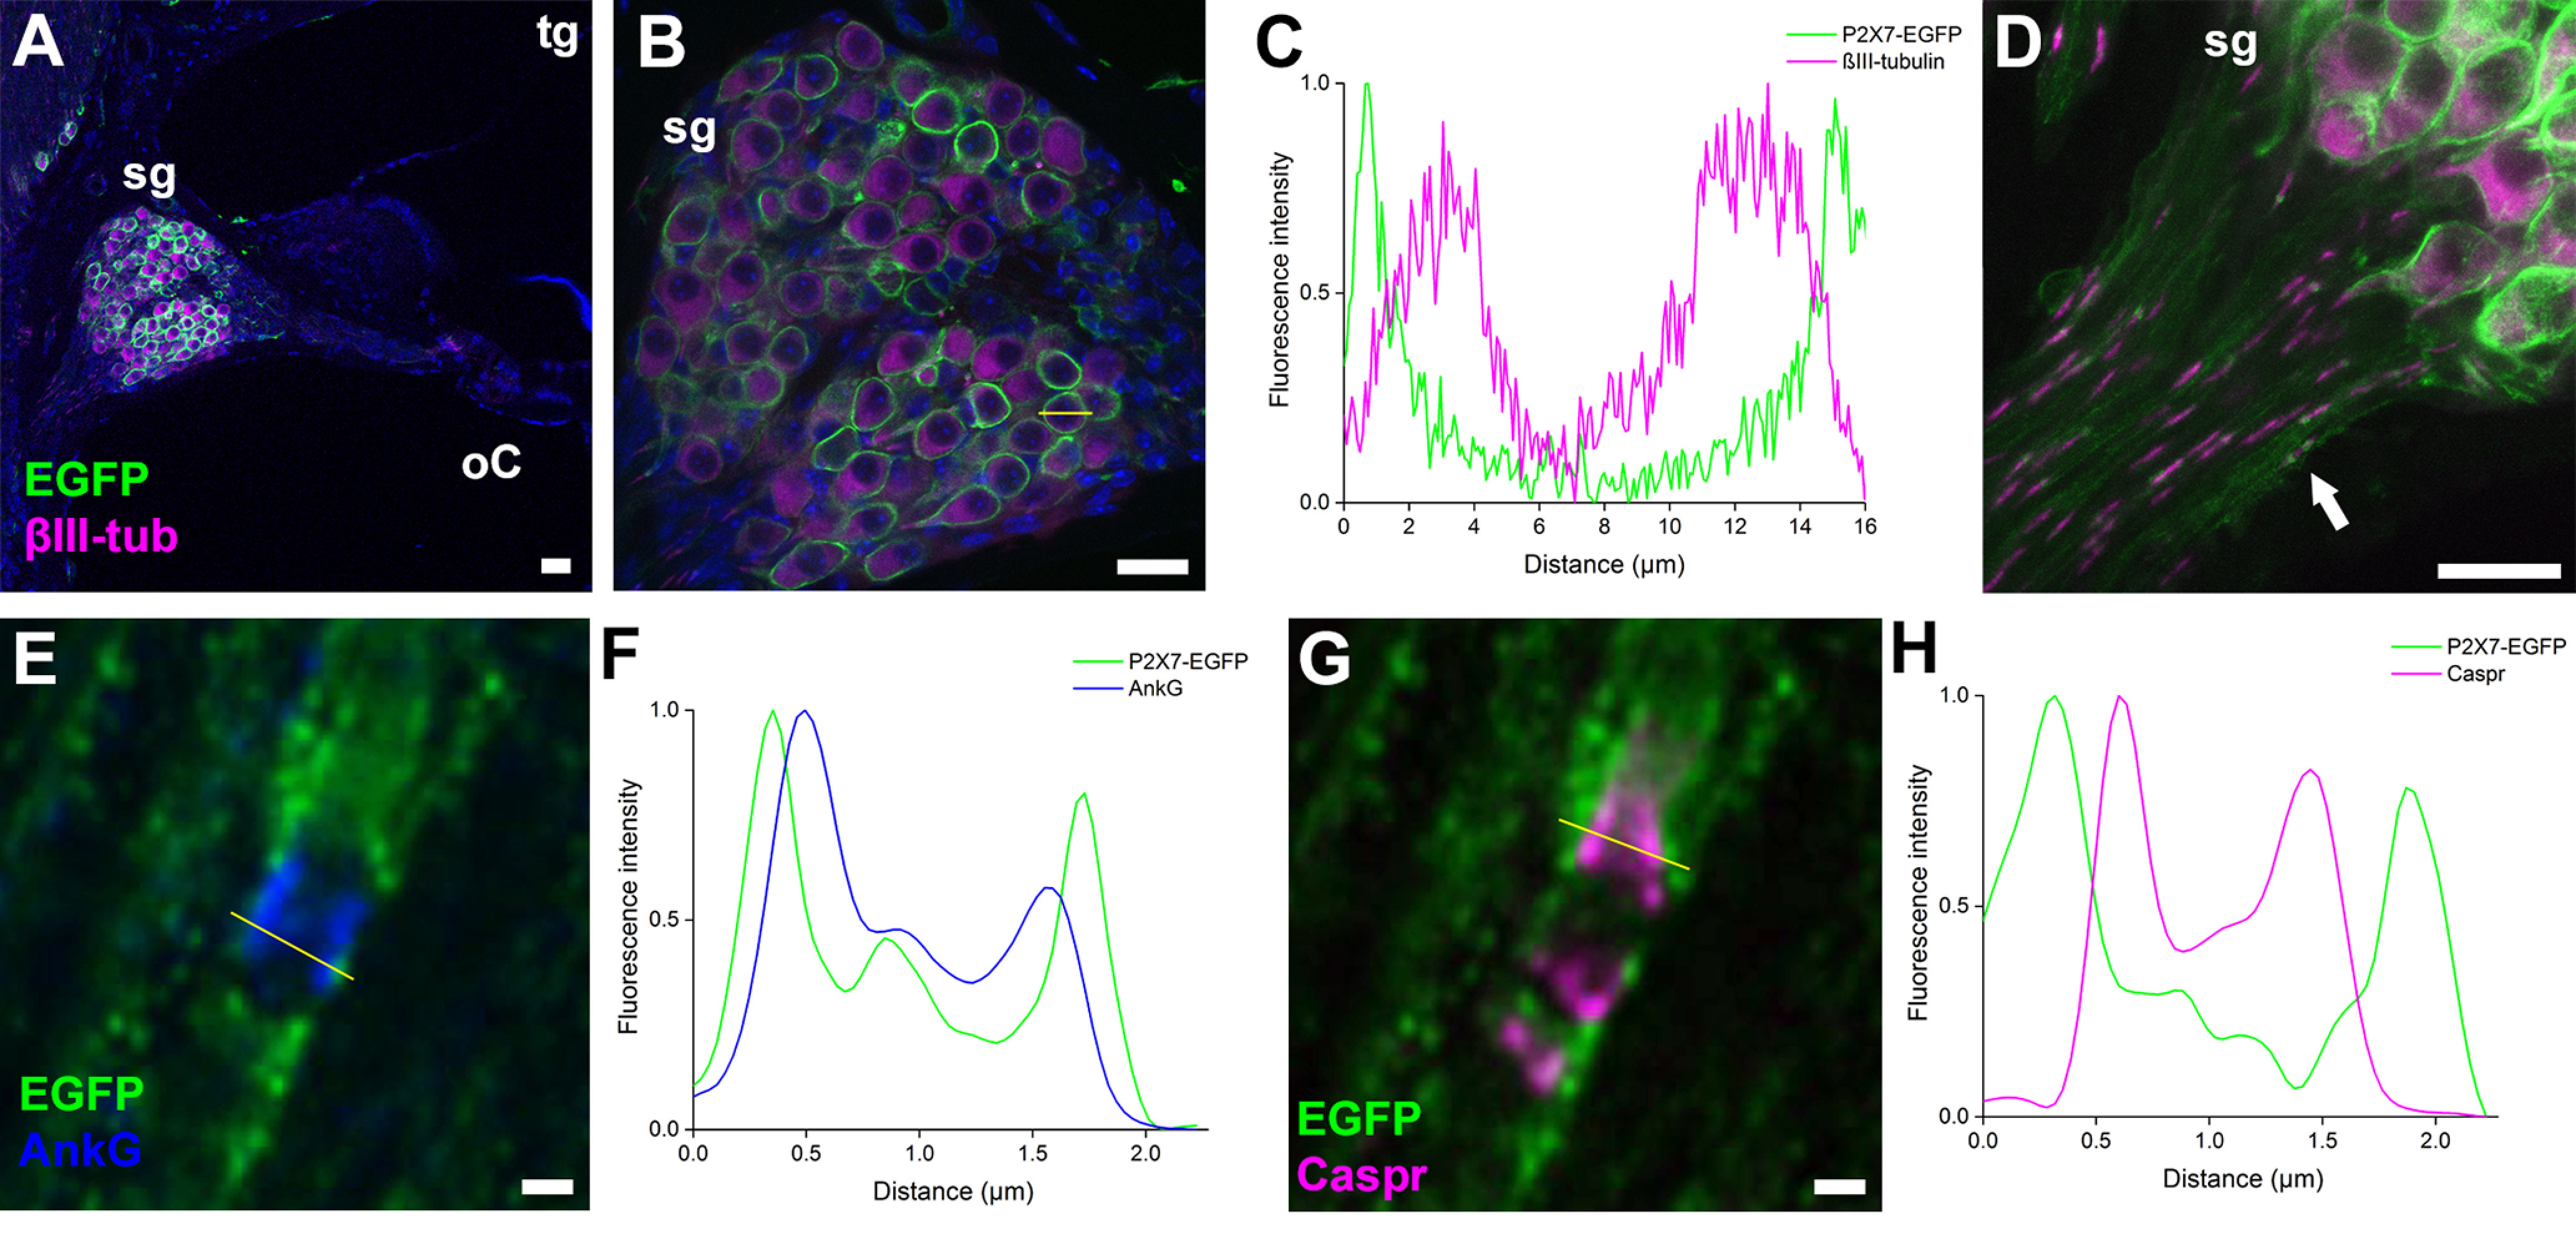
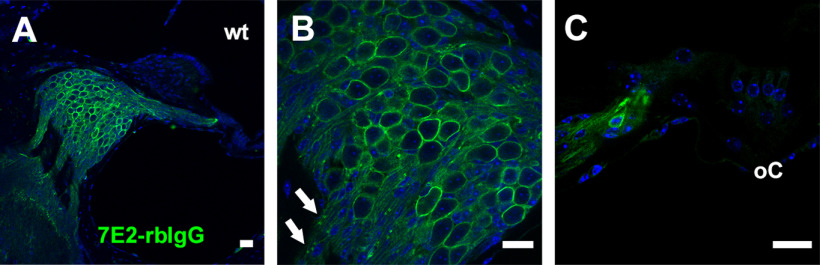
P2X7 receptors (P2X7Rs) are associated with numerous pathophysiological mechanisms, and this promotes them as therapeutic targets for certain neurodegenerative conditions. However, the identity of P2X7R-expressing cells in the nervous system remains contentious. Here, we examined P2X7R functionality in auditory nerve cells from rodents of either sex, and determined their functional and anatomic expression pattern. In whole-cell recordings from rat spiral ganglion cultures, the purinergic agonist 2',3'-O-(4-benzoylbenzoyl)-ATP (BzATP) activated desensitizing currents in spiral ganglion neurons (SGNs) but non-desensitizing currents in glia that were blocked by P2X7R-specific antagonists. In imaging experiments, BzATP gated sustained Ca2+ entry into glial cells. BzATP-gated uptake of the fluorescent dye YO-PRO-1 was reduced and slowed by P2X7R-specific antagonists. In rats, P2X7Rs were immuno-localized predominantly within satellite glial cells (SGCs) and Schwann cells (SCs). P2X7R expression was not detected in the portion of the auditory nerve within the central nervous system. Mouse models allowed further exploration of the distribution of cochlear P2X7Rs. In GENSAT reporter mice, EGFP expression driven via the P2rx7 promoter was evident in SGCs and SCs but was undetectable in SGNs. A second transgenic model showed a comparable cellular distribution of EGFP-tagged P2X7Rs. In wild-type mice the discrete glial expression was confirmed using a P2X7-specific nanobody construct. Our study shows that P2X7Rs are expressed by peripheral glial cells, rather than by afferent neurons. Description of functional signatures and cellular distributions of these enigmatic proteins in the peripheral nervous system (PNS) will help our understanding of ATP-dependent effects contributing to hearing loss and other sensory neuropathies.SIGNIFICANCE STATEMENT P2X7 receptors (P2X7Rs) have been the subject of much scrutiny in recent years. They have been promoted as therapeutic targets in a number of diseases of the nervous system, yet the specific cellular location of these receptors remains the subject of intense debate. In the auditory nerve, connecting the inner ear to the brainstem, we show these multimodal ATP-gated channels localize exclusively to peripheral glial cells rather than the sensory neurons, and are not evident in central glia. Physiologic responses in the peripheral glia display classical hallmarks of P2X7R activation, including the formation of ion-permeable and also macromolecule-permeable pores. These qualities suggest these proteins could contribute to glial-mediated inflammatory processes in the auditory periphery under pathologic disease states.

Keywords: ATP; P2X; cochlea; deafness; hearing; purinergic.


Figures

Figure 1.
Figure 1.
Neuronal and glial cell markers in cochlear tissues and spiral ganglion cultures. A, DIC image of the mid-turn region of the P14 rat cochlea, with overlaid immunofluorescence for the neuronal marker βIII-tubulin (βIII-tub; magenta). Cell nuclei are labeled using DAPI (blue). SGN cell bodies are located within the spiral ganglion (sg), and their labeled neurites extend from the organ of Corti (oC) to the ganglion, and from the ganglion toward the brain (arrow). B, Higher magnification of the spiral ganglion. SGN cell bodies are surrounded by single SGCs, identified by S100 immunofluorescence (green). C, Detail of SGN neurites exiting the ganglion (denoted by arrow in A) surrounded by S100-labeled SCs. D, Detail of a single SGN-SGC pair. Inset between C and D represents the schematic relationship between SGNs and their attendant glial cells. E, F, Rat spiral ganglion cultures (P12 + 2 DIV), with cells immunolabelled for βIII-tubulin (magenta) and S100 (green). Spindle-shaped and multipolar S100-positive glia are in close proximity to βIII-tubulin-positive SGN cell bodies or neurites. G, In a P5 + 4 DIV culture, S100-positive cells (green) are double-labeled for the glial nuclear marker Sox10 (magenta). Scale bars: 100 µm (A), 20 µm (B, E–G), 10 µm (C, D).
Figure 2.
Figure 2.
BzATP activates distinct current responses in cultured rat cochlear neurons and glia. A, Whole-cell patch-clamp recording from a P6 SGN following 2 DIV (P6 + 2 DIV); 10 μm BzATP in LDAP (0.3 mm Ca2+, 0 mm Mg2+) delivered via a 1-s application (denoted by arrow) from a pico-spritzer pipette located ∼50 µm from the cell elicits a fast-activating transient inward current at the holding potential (Vh = −60 mV). Subsequent spritzes 60 s apart result in currents of decreasing amplitude. B, The same paradigm applied to a glial cell in whole-cell mode results in sustained currents of increasing amplitude. C, Group data for P6 SGNs (n = 9, mean ± SEM). Current amplitude normalized to the peak inward current for each neuron. D, Group data for P6 (n = 10) and P14 (n = 31) glia. The progressive current growth is apparent in glia cultured from animals before and after hearing onset.
Figure 3.
Figure 3.
BzATP activates P2X7R-mediated currents in cultured cochlear glia. A, In a cultured cochlear glial cell (P6 + 2 DIV) in whole-cell mode, a 2-s application of 10 μm BzATP activates an inward current (Vh = −60 mV). On recovery to baseline, a 20-s application of BzATP activates an inward current that grows in amplitude during the agonist application. The current returns to baseline on withdrawal of the agonist. B, Repeated voltage ramps (−140 to +60 mV during 1 s) applied to a glial cell (P6 + 2 DIV) activate inward and outward whole-cell currents (control). During a 20-s application of 10 μm BzATP, the inward and outward currents increase in amplitude, and there is a rightward shift of the ramp current reversal potential. Digital subtraction derives the BzATP-activated current (gray), which reverses close to 0 mV. C–F, The current response to BzATP in cultured glial cells (P14 + 2 DIV) is blocked by P2X7R-specific antagonists. C, Following four to five priming BzATP spritzes (data not shown; 10 μm BzATP, 1-s spritz repeated every 60 s) to activate the maximal current (left), the current response to BzATP is reduced following a 5-min bath application of 100 nm A-740003 (center). The current amplitude recovers following a 20-min washout of the antagonist (right). D, Group data showing the progressive block by A-740003 (n = 3; mean ± SEM). The antagonist is introduced to the bath immediately after the application of BzATP that achieves maximal amplitude (denoted spritz #1). Current amplitude is normalized between the maximum and minimum response for each cell. E, Maximal BzATP-activated current (left) is reduced following a 5-min bath application of 100 nm JNJ-47965567 (center). There is no recovery of current amplitude on washout of this antagonist (right). F, Group data showing the progressive action of JNJ-47965567 (n = 4).
Figure 4.
Figure 4.
Calcium signaling demonstrates diverse purinergic responses in cultured cochlear glia. A, B, Intracellular Ca2+ responses (measured as F340/380) to 10 μm BzATP in individual cultured rat glial cells loaded with fura-2 AM. A, BzATP activates a sustained increase of intracellular Ca2+ when applied in medium containing 0.3 mm extracellular Ca2+ (LDAP, n = 289 cells, from three P8 + 2 DIV cultures). Colors represent cells cultured from three different animals. The dotted line shows the average response, which is detailed in the inset (A'). B, BzATP activates transient responses when no extracellular Ca2+ is added (ZDAP, n = 46 cells, from three P8 + 2 DIV cultures). C, Intracellular Ca2+ responses to 50 μm UTP in LDAP. UTP activates transient increases of intracellular Ca2+ when added to the bath (n = 98 cells, from three P5 + 2 DIV cultures). D, In separate experiments, 50 μm UTP activates transient responses when applied in ZDAP (n = 84 cells, from three P5 + 2 DIV cultures).
Figure 5.
Figure 5.
BzATP activates P2X7R-mediated YO-PRO-1 uptake in cultured cochlear glia. A, The proportion of glial cells taking up YO-PRO-1 during a 15-min period is significantly higher in the presence of 10 μm BzATP (91/125 in five independent experiments from three P14 + 2 DIV cultures) compared with control (no added BzATP, 60/135 cells in six independent experiments from three P14 + 2 DIV cultures; ***p < 0.001, Welch ANOVA). Inclusion of 1 μm A-740003 prevents the BzATP-mediated uptake of YO-PRO-1 (n = 46/103 cells in five independent experiments from three P14 + 2 DIV cultures; *p < 0.05). Horizontal black lines represent the median percentage of YO-PRO-1-positive cells in each group, and open triangles represent the mean. The box plots represent the 25–75th percentiles, and whiskers represent the 10–90th percentiles. There is no significant difference between the control and antagonist groups (p > 0.05). B, For cells displaying a detectable increase of fluorescence during the imaging period, the rate of YO-PRO-1 uptake is significantly faster with BzATP added compared with control (**p < 0.01, Kruskal–Wallis test). Preincubation in 1 μm A-740003 significantly slows the BzATP-mediated uptake of YO-PRO-1 (*p < 0.05). There is no significant difference between the control and antagonist groups (p > 0.05).
Figure 6.
Figure 6.
P2X7R localization in the juvenile rat cochlea. A, P2X7 immunofluorescence demonstrates P2X7R expression (P2X7R, green) in the basal and apical cochlear turns of a P13 rat. Hair cells are located in the organ of Corti (oC). Some immuno-positive blood vessels (bv) are evident. The anti-βIII-tubulin antibody (βIII-tub; magenta) labels neuronal cell bodies in the spiral ganglion (sg) and their neurites. Cell nuclei are labeled using DAPI (blue). B, Higher magnification of the glial transition zone where peripheral and central glial cells meet (denoted by arrow in A), which is demarcated by a distinct decrease of anti-P2X7 immunofluorescence in the central region. C, Detail of P2X7R labeling in the spiral ganglion, localized in the region of glial cell membranes wrapping SGN cell bodies and neurites. D–D', Postganglionic bundle of nerve fibers in a P14 rat labeled with anti-P2X7, and anti-Caspr antibody (magenta) to label paranodes. Anti-P2X7 signal (green) is present in SC internodal membranes that ensheath the neurites, and also in paired densities close to the paranodes (arrows). E, Basal turn of a P14 rat cochlea labeled with anti-P2X7, and anti-peripherin (PRPH, magenta) to identify Type II SGNs. Cell nuclei labeled using DAPI (blue). P2X7Rs appear to localize to all SGCs encircling SGN cell bodies. F–F', Anti-P2X7 immunofluorescence labeling an SGC associated with a peripherin-positive Type II SGN (arrow). G–G', Anti-P2X7-labeled densities below IHCs and OHCs in the organ of Corti. H, I, Double labeling for P2X7Rs (green) and anti-synaptophysin (SYP, magenta) identifies efferent terminals below the IHC (H) and OHCs (I). Yellow outlines show the approximate positions of the hair cells. J, K, Wholemount preparation of the organ of Corti mid-turn region of a P21 rat. J, Confocal image showing nuclei of OHCs and IHCs labeled using DAPI. K, Bouton-like structures double immunolabelled for SYP (magenta) and P2X7Rs (green), at a focal position ∼1 µm below the nuclei. Scale bars: 100 µm (A, E), 10 µm (BD, FI), 20 µm (J, K).
Figure 7.
Figure 7.
P2X7R expression during postnatal development of the rat cochlea. P2X7 immunofluorescence demonstrates P2X7R expression (P2X7R, green) in cochlear sections from rats between birth and hearing onset. The anti-βIII-tubulin antibody (magenta) labels neuronal cell bodies in the spiral ganglion (sg) and their neurites. Cell nuclei are labeled using DAPI (blue). A, Mid-basal turn at P0. There is diffuse P2X7 immunofluorescence in Kölliker's organ (Ko) and organ of Corti (oC). B, B', Detail of P2X7R signal in the spiral ganglion at P0. C, D, Apical turn at P4. E, F, Basal turn at P8. There is increased anti-P2X7 signal in spiral ganglion. G, H, Basal turn at P12. Anti-P2X7 labels SGC and SC membranes, and paired densities are evident (arrow in H). Scale bars: 100 µm (A, C, E, G) and 20 µm (B, D, F, H).
Figure 8.
Figure 8.
P2rx7-driven soluble EGFP within glial cells in the peripheral portion of the auditory nerve. A, EGFP expression (green) in the basal, mid and apical cochlear turns and the vestibular ganglion (vg) of a P31 transgenic (tg) Tg(P2rx7-EGFP)FY174Gsat reporter mouse. The anti-βIII-tubulin antibody (magenta) labels neuronal cell bodies in the spiral ganglion (sg) and their neurites. Cell nuclei are labeled using DAPI (blue). The glial transition zone is marked by an arrow. B, EGFP in the central and peripheral neurites region and within the basal turn spiral ganglion. C, Green fluorescence is not detectable in the basal cochlear region of a wild-type (wt) mouse. D, The glial transition zone in a reporter mouse where peripheral and central glial cells meet is demarcated by a distinct decrease of anti-EGFP immunofluorescence in the central region (arrow in A). E, Detail of the organ of Corti (oC) region revealing EGFP signal in the nerve tract (arrow), but it is absent from supporting cells and hair cells. F, The spatial distributions of EGFP and βIII-tubulin immunofluorescence intensities in the spiral ganglion. G, A 16-µm line drawn across SGN/SGC pairs in F (shown in yellow) measures relative EGFP and βIII-tubulin immunofluorescence pixel intensities (normalized signal averaged across 10 SGN/SGC pairs). The EGFP signal appears as twin peaks at either side of the SGN cell body. H, Image showing the spatial distributions of EGFP and βIII-tubulin intensities in the neurite region leaving the basal turn ganglion. I, A 2.6-µm (yellow) line drawn perpendicularly across SC/neurite pairs in H measures relative EGFP and βIII-tubulin pixel intensities (signal averaged across 10 neurites). The EGFP signal appears as twin peaks at either side of the neurites. J, EGFP and ankyrin-G immunofluorescence (AnkG; blue) at a node of Ranvier of a neurite exiting the distal region of the ganglion. The EGFP signal completely surrounds the nodal region. K, A 3.4-µm line drawn perpendicularly across individual nodes measures relative EGFP and AnkG pixel intensities (averaged signal across 10 nodes). EGFP expression profile appears as two peaks outside each node. L, EGFP and Caspr immunofluorescence in the region shown in J. M, EGFP and Caspr fluorescence intensities averaged perpendicularly across 10 paranodes, demonstrating a distinct spatial separation of the signals at the outer edges. Scale bars: 50 µm (A, E), 20 µm (F, H), 2 µm (J, L).
Figure 9.
Figure 9.
Localization of transgenic P2X7-EGFP fusion protein within the peripheral portion of the auditory nerve. A, Confocal imaging of P2X7-EGFP fluorescence (EGFP, green) expressed in the basal cochlear turn of a P38 BL/6N-Tg(RP24-114E20P2X7451P-StrepHis-EGFP) transgenic (tg) mouse. The anti-βIII-tubulin antibody (magenta) labels neuronal cell bodies within spiral ganglion (sg) and their neurites. Cell nuclei are labeled using DAPI (blue). No P2X7-EGFP signal is evident in the organ of Corti (oC). B, Airyscan image showing P2X7-EGFP fluorescence and βIII-tubulin immunofluorescence distributions in the spiral ganglion. C, A 16-µm line drawn across SGN/SGC pairs in B (shown in yellow) measures P2X7-EGFP fluorescence and βIII-tubulin immunofluorescence pixel intensities. P2X7-EGFP expression profile appears as narrow twin peaks at either side of the SGN cell body (signal average across 10 SGN/SGC pairs). D, The P2X7-EGFP signal is located within discrete focal densities (arrow) within the nerve tracts exiting the distal region of the ganglion. E, Airyscan imaging of P2X7-EGFP fluorescence and ankyrin-G (AnkG) immunofluorescence at an individual node of Ranvier in region denoted by arrow in D. F, A 2-µm line drawn perpendicularly across individual nodes in E (shown in yellow) measures relative P2X7-EGFP and AnkG signal pixel intensities (averaged signal across 10 nodes). The P2X7-EGFP signal appears as twin peaks at either side of the node. G Airyscan imaging of P2X7-EGFP fluorescence and anti-Caspr immunofluorescence at the same region shown in E. H, P2X7-EGFP and Caspr intensity profiles averaged perpendicularly across 10 paranodes (yellow line in G), demonstrating a distinct spatial separation of the signals at the outer edges. Scale bars: 20 µm (A, B, D) and 2 µm (E, G).
Figure 10.
Figure 10.
Nanobody labeling of endogenous P2X7Rs in the mouse auditory nerve. A, A P2X7-specific nanobody-rbIgG fusion construct (7E2-rbIgG; green) detects endogenous P2X7Rs in the mid cochlear turn of a P38 wild-type (wt) mouse. Cell nuclei are labeled using DAPI (blue). B, In the spiral ganglion, the nanobody construct labels SGC membranes and internodal membranes of SCs. Discrete paired densities of nanobody-associated fluorescence are apparent within the nerve tracts exiting the ganglion (arrows). C, P2X7-specific nanobody labeling of SCs located within the afferent nerve tract, but there is no labeling of hair cells or supporting cells within the organ of Corti (oC). Scale bars: 20 µm (A–C).

Similar articles

Cited by

References

    1. Adriouch S, Dox C, Welge V, Seman M, Koch-Nolte F, Haag F (2002) Cutting edge: a natural P451L mutation in the cytoplasmic domain impairs the function of the mouse P2X7 receptor. J Immunol 169:4108–4112. 10.4049/jimmunol.169.8.4108 - DOI - PubMed
    1. Bartlett R, Stokes L, Sluyter R (2014) The P2X7 receptor channel: recent developments and the use of P2X7 antagonists in models of disease. Pharmacol Rev 66:638–675. 10.1124/pr.113.008003 - DOI - PubMed
    1. Bhattacharya A, Wang Q, Ao H, Shoblock JR, Lord B, Aluisio L, Fraser I, Nepomuceno D, Neff RA, Welty N, Lovenberg TW, Bonaventure P, Wickenden AD, Letavic MA (2013) Pharmacological characterization of a novel centrally permeable P2X7 receptor antagonist: JNJ-47965567. Br J Pharmacol 170:624–640. 10.1111/bph.12314 - DOI - PMC - PubMed
    1. Bianchi BR, Lynch KJ, Touma E, Niforatos W, Burgard EC, Alexander KM, Park HS, Yu H, Metzger R, Kowaluk E, Jarvis MF, van Biesen T (1999) Pharmacological characterization of recombinant human and rat P2X receptor subtypes. Eur J Pharmacol 376:127–138. 10.1016/s0014-2999(99)00350-7 - DOI - PubMed
    1. Brändle U, Zenner HP, Ruppersberg JP (1999) Gene expression of P2X-receptors in the developing inner ear of the rat. Neurosci Lett 273:105–108. 10.1016/s0304-3940(99)00648-5 - DOI - PubMed

Publication types

Substances

LinkOut - more resources