. 2021 Mar 8;6(5):e140267.
doi: 10.1172/jci.insight.140267.

TLR2-mediated activation of innate responses in the upper airways confers antiviral protection of the lungs

Affiliations

TLR2-mediated activation of innate responses in the upper airways confers antiviral protection of the lungs

Georgia Deliyannis et al. JCI Insight. .

Abstract

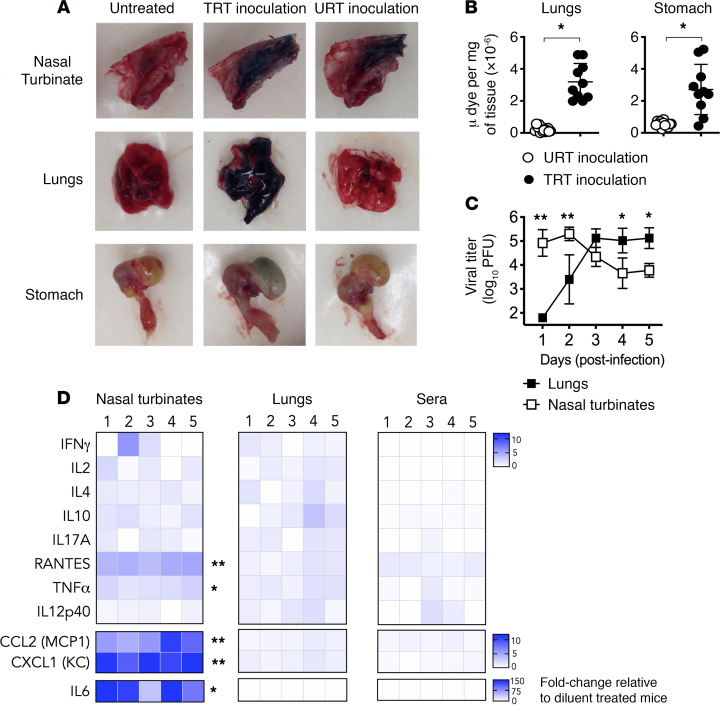
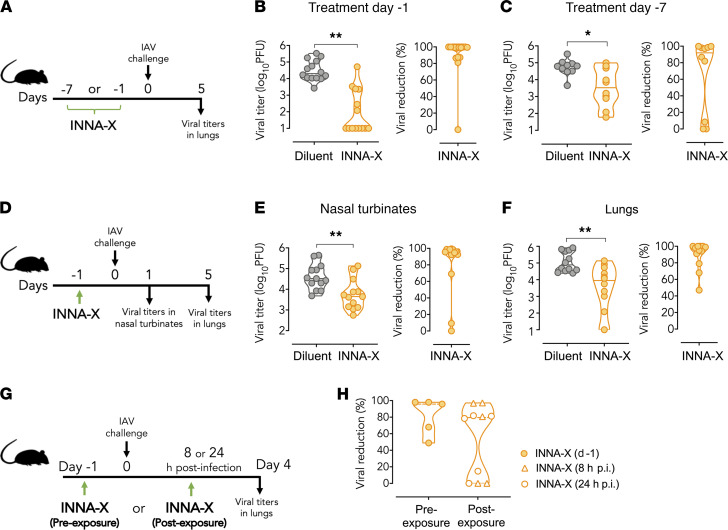
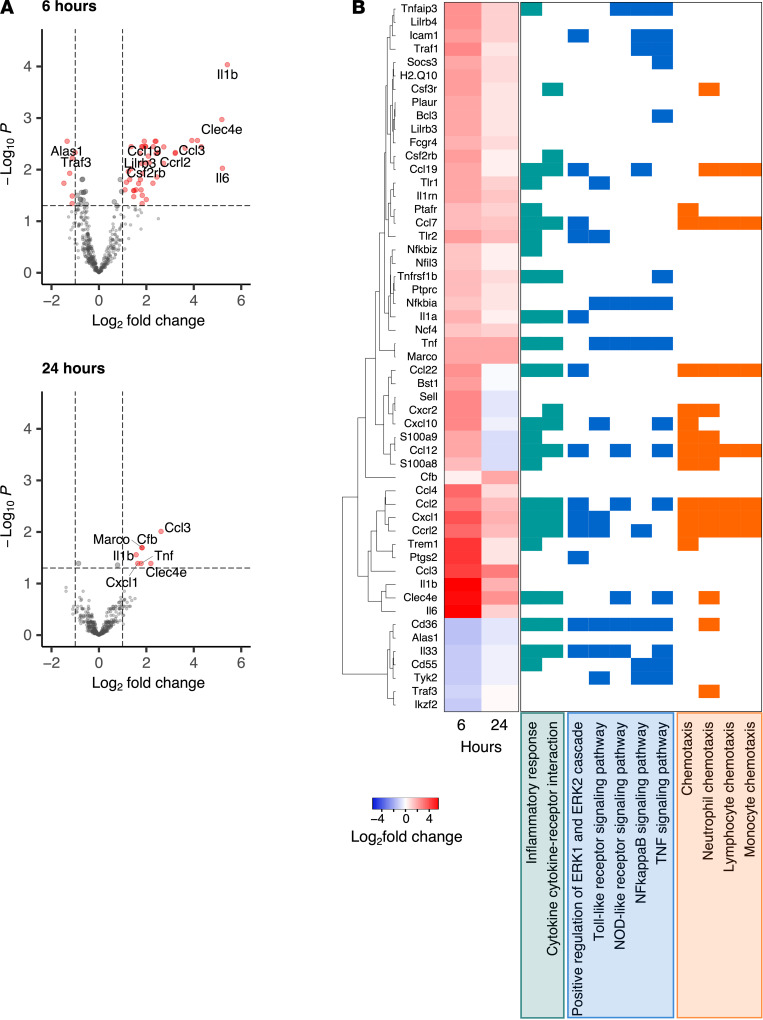
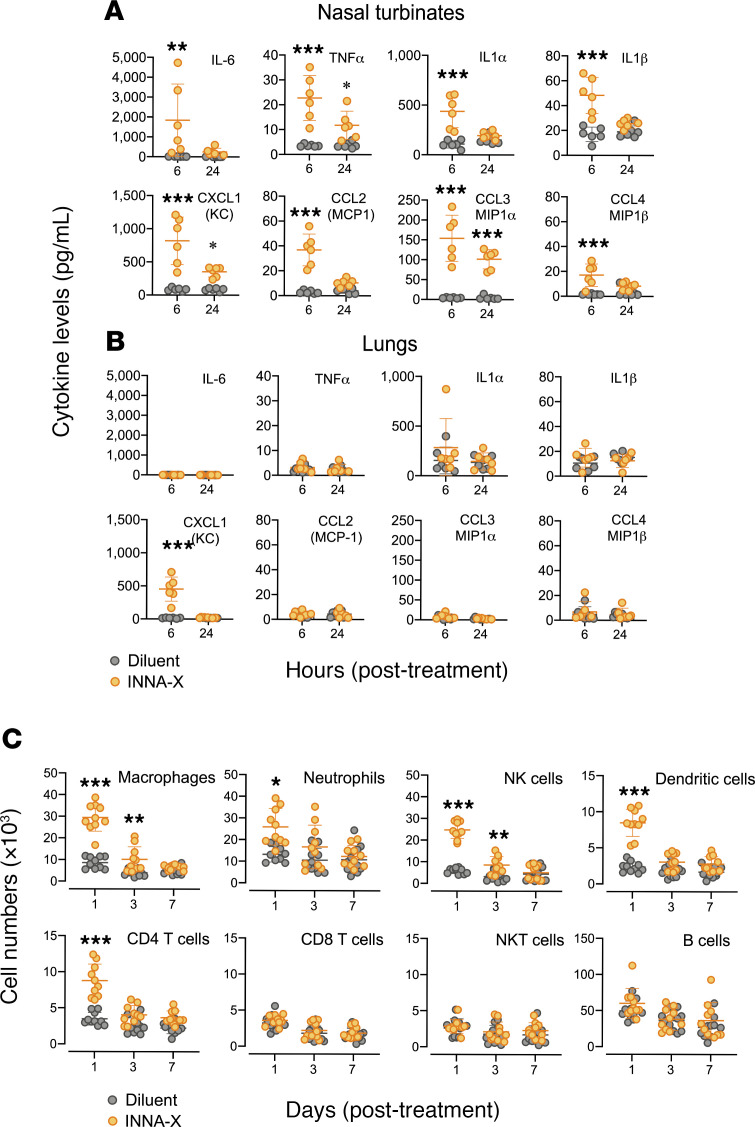
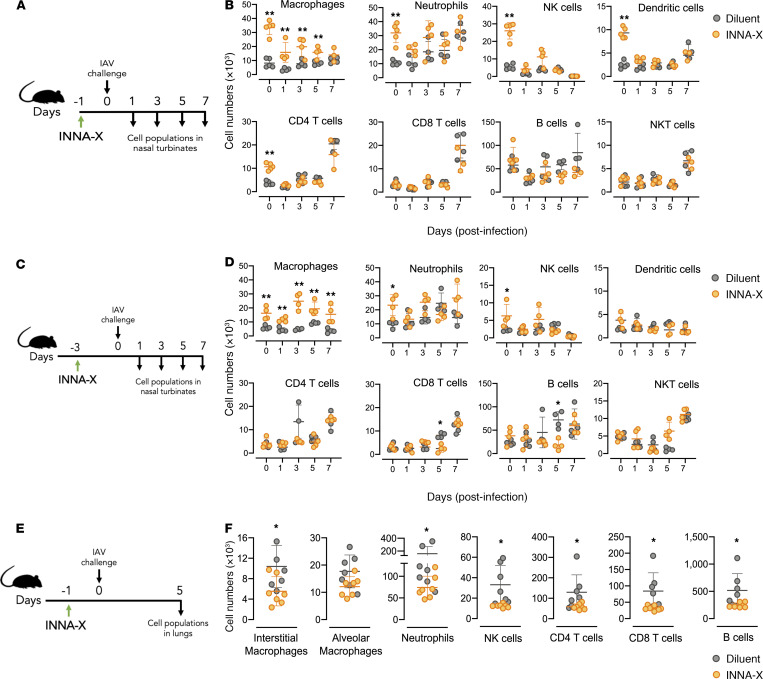
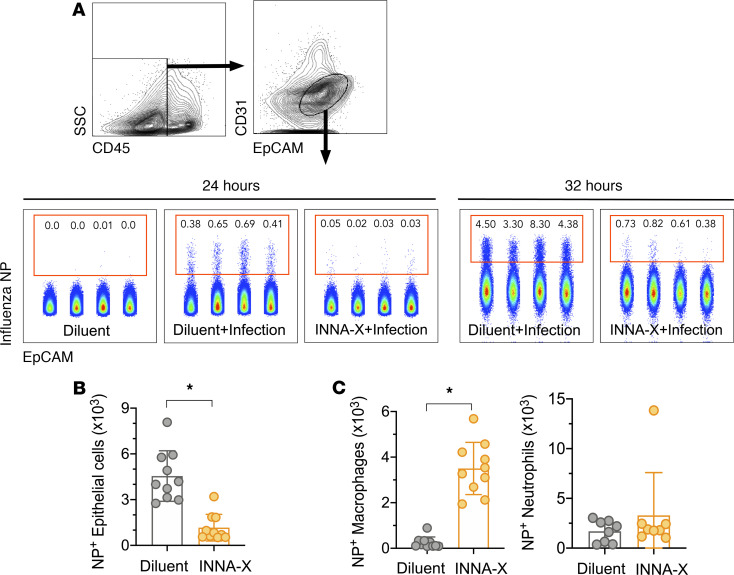
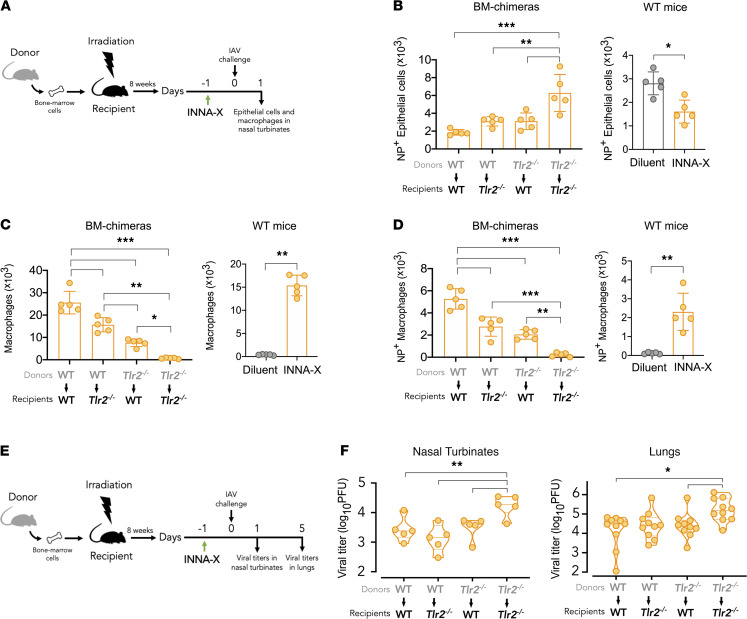
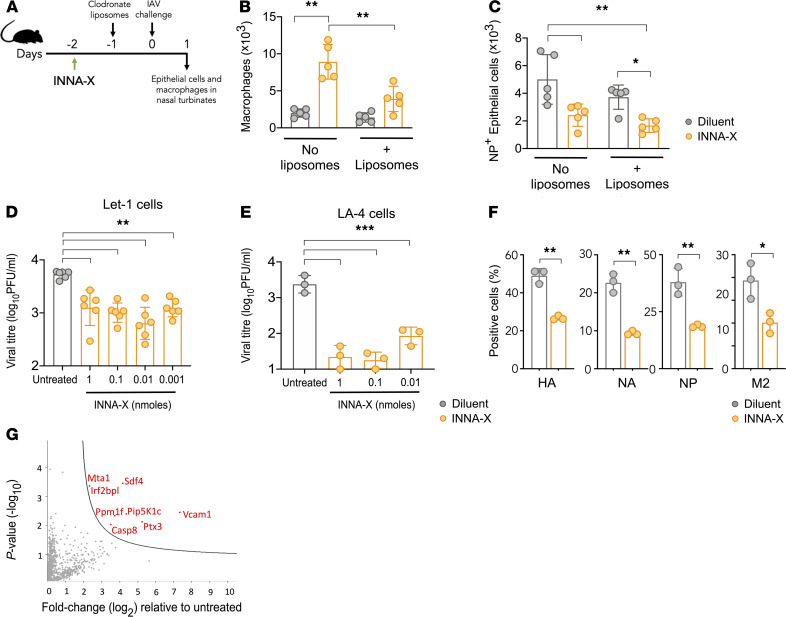
The impact of respiratory virus infections on global health is felt not just during a pandemic, but endemic seasonal infections pose an equal and ongoing risk of severe disease. Moreover, vaccines and antiviral drugs are not always effective or available for many respiratory viruses. We investigated how induction of effective and appropriate antigen-independent innate immunity in the upper airways can prevent the spread of respiratory virus infection to the vulnerable lower airways. Activation of TLR2, when restricted to the nasal turbinates, resulted in prompt induction of innate immune-driven antiviral responses through action of cytokines, chemokines, and cellular activity in the upper but not the lower airways. We have defined how nasal epithelial cells and recruitment of macrophages work in concert and play pivotal roles to limit progression of influenza virus to the lungs and sustain protection for up to 7 days. These results reveal underlying mechanisms of how control of viral infection in the upper airways can occur and support the implementation of strategies that can activate TLR2 in nasal passages to provide rapid protection, especially for at-risk populations, against severe respiratory infection when vaccines and antiviral drugs are not always effective or available.

Keywords: Infectious disease; Influenza; Innate immunity; Therapeutics.


Conflict of interest statement

Conflict of interest: BYC, DCJ, and NWB are consultants for Ena Respiratory. FM and CD are employees of Ena Therapeutics. FM, CD, and NWB have received income per annum from Ena Therapeutics or Ena Respiratory. The research subject of this publication was funded by Ena Therapeutics or Ena Respiratory. Compounds used for the research in this publication are the subject of the following patent applications owned by Ena Therapeutics: PCT/AU2011/001225 (DCJ), PCT/AU2018/051397 (DCJ, WZ, and CD), PCT/AU2018/051401 (DJ, FM, GD, CW, and CD), and PCT/AU2020/050660 (WZ, DCJ, and CD).

Figures

Figure 1
Figure 1. Distribution of inocula after administration to the URT or TRT.
(A) Mice (n = 10/group) were i.n. inoculated with 0.125% Evans blue dye in PBS (10 μL URT inoculation or 50 μL TRT inoculation). Representative images of nasal turbinates (NT), lungs, and stomach dissected 2 minutes later are shown in comparison with an untreated control. (B) Supernatants from homogenized lungs and stomach were treated with trichloroacetic acid with absorbance measured at 620 nm. Concentrations of dye were interpolated from a standard curve. (C) Mice (n = 5/group) were infected with 500 PFU of Udorn IAV in 10 μL. Viral titers in NT and lungs were determined in an MDCK plaque assay. (D) The immunostimulatory activity of URT-inoculated INNA-X (5 nmol) was determined in mice (n = 5/group) by measuring cytokine levels by multiplex bead array 1 day after treatment. Statistical analysis was performed using a (B) Welch t test, (C) 2-way ANOVA with a Bonferroni post hoc test (relative to diluent-treated mice) and (D) multiple-comparison Holm-Sidak t test.*P < 0.01, **P < 0.001.
Figure 2
Figure 2. Inhibition of viral replication in the respiratory tract after administration of INNA-X to the URT.
(A) Mice (n = 5 or 7/group) were inoculated with 5 nmol of INNA-X prior to challenge with 500 PFU of Udorn IAV. Efficacy of treatment (B) 1 day or (C) 7 days prior to viral challenge was determined by measuring lung viral titers 5 days after infection. The percentage reduction in viral load in each mouse is shown relative to the average viral titer in similarly challenged diluent-treated mice. Results (B and C) are pooled from 2 separate experiments. (D) Mice were inoculated with 1 nmol of INNA-X and challenged 1 day later. Viral titers in (E) nasal turbinates or (F) lungs (n = 7/group) were measured at 1 or 5 days, respectively, after infection. (G) Therapeutic efficacy of treatment with INNA-X was examined by inoculating mice with INNA-X 8 or 24 hours after IAV challenge (postexposure) in comparison to treatment 1 day prior to challenge (preexposure). (H) Reduction in lung viral titers is relative to similarly infected mice treated with diluent at each time point. Statistical analysis was performed using a (B, E, and F) Mann-Whitney or (C) Welch t test. *P < 0.05, **P < 0.01.
Figure 3
Figure 3. Gene expression changes induced by treatment with INNA-X.
RNA was isolated from nasal turbinates 6 hours and 24 hours after administration of 1 nmol of INNA-X or diluent to the URT (n = 5/group). RNA was analyzed by NanoString nCounter assay against a panel of 547 immune genes. (A) Volcano plots showing log2 fold change and –log10 FDR. (B) Heatmap showing log2 fold change of differentially expressed genes (log2 fold change ≥ 1 or ≤ –1 and FDR < 0.05 at each time point) and clustered by expression. Genes with related functions, categorized by gene ontology terms, are highlighted in green (inflammatory processes), blue (danger sensing/signal transduction), and orange (chemotaxis).
Figure 4
Figure 4. Cytokine levels and cell populations in the respiratory tract of mice after treatment with INNA-X.
Mice (n = 3/group) were inoculated with 1 nmol of INNA-X or diluent only and 1 day later cytokine levels in (A) nasal turbinates and (B) lungs were analyzed in a multiplex bead array assay. (C) Nasal turbinates were harvested 1, 3, and 7 days after treatment (n = 5/group) and single-cell suspensions stained with fluorochrome-conjugated antibodies of various specificities and analyzed by flow cytometry. All results are pooled from 2 separate experiments. Statistical analysis was performed by 2-way ANOVA with a Bonferroni post hoc test. *P < 0.05, **P < 0.01, ***P < 0.001.
Figure 5
Figure 5. Different cell populations present in the nasal turbinates and lungs after treatment with INNA-X and challenge with influenza virus.
(A and B) Mice (n = 3–5/group) were inoculated with 1 nmol of INNA-X or diluent and 1 day later challenged with 500 PFU of Udorn IAV. (B) Frequencies of cell populations in the nasal turbinates on 1, 3, 5, and 7 days after challenge were analyzed. (C and D) Mice (n = 4/group) were treated with 1 nmol of INNA-X and 3 days later challenged with virus to examine cell populations present 1, 3, 5, and 7 days after challenge. Cell populations present 24 hours (B) or 3 days (D) after treatment but prior to challenge with virus are shown in each panel as the day 0 time point. (E and F) Cell populations in the lungs of inoculated mice (n = 7/group) challenged 1 day later were also analyzed at 5 days after infection. Statistical analysis was performed by (B and D) 2-way ANOVA with a Bonferroni post hoc test or (F) a Welch t test. *P < 0.01. **P < 0.001.
Figure 6
Figure 6. In vivo protection of nasal epithelial cells after viral challenge of mice treated with INNA-X.
Mice were inoculated with 1 nmol of INNA-X or diluent and 1 day later challenged with 500 PFU of Udorn IAV. Nasal turbinates were harvested 24 or 32 hours after infection and cell populations analyzed for intracellular influenza virus nucleoprotein (NP) expression. (A) Epithelial cells were distinguished by CD45CD31EpCAM+ expression. Center panels depict NP+-expressing cell populations from individual animals in a representative experiment. (B) Bar graphs indicate the total number of NP+ epithelial cells, (C) NP+ macrophages, or NP+ neutrophils obtained from 8–10 animals (data pooled from 2 independent experiments). All statistical analysis was performed using a Mann-Whitney t test. *P < 0.001.
Figure 7
Figure 7. Contribution of immune and nonimmune cells in mediating protection.
(A) Bone marrow chimeras were established by adoptive transfer of donor bone marrow cells from WT C57BL/6 or Tlr2–/– mice into irradiated recipient mice (n = 5/group). After 8 weeks, animals were inoculated with 1 nmol of INNA-X prior to viral challenge with 500 PFU of Udorn IAV. Separate groups of WT mice were similarly treated with INNA-X and diluent prior to viral challenge. Nasal turbinates were harvested 1 day after challenge and the frequencies of (B) NP+-expressing CD45CD31EpCAM+ epithelial cells, (C) total macrophages, and (D) NP+-expressing macrophages determined. Results representative of 2 experiments conducted independently. (E and F) Viral titers in the nasal turbinates and lungs were also determined 1 and 5 days after infection, respectively. Statistical analysis of data from bone marrow chimeras (BD and F) were performed by 1-way ANOVA with Tukey’s post hoc test and data from WT mice analyzed by a Welch t test. Comparison of lung viral titers (F) analyzed by a Kruskal-Wallis multiple-comparison test. *P < 0.05, **P < 0.01, ***P < 0.001.
Figure 8
Figure 8. Epithelial cell protection in macrophage-depleted mice and in Let1 and LA-4 cells.
(A) Mice (n = 5/group) were inoculated with 1 nmol of INNA-X or diluent and 1 day later received clodronate liposomes via the i.v. (200 μL) and i.n. route (50 μL) or were left untreated. All mice were challenged the next day with 500 PFU of Udorn IAV and 1 day after viral challenge the numbers of (B) macrophages and (C) NP+ CD45CD31EpCAM+ epithelial cells in nasal turbinates were analyzed. (D and E) 5 × 10⁵ Let1 or 2 × 10⁵ LA-4 cells were incubated in the presence or absence of INNA-X for 24 hours (D) or 18 hours (E) (n = 3–6/group). Cell monolayers were washed prior to challenge with Udorn IAV (MOI of 0.01). Culture supernatants were harvested 24 hours later and assayed to quantitate viral titers. (F) LA-4 cells were treated with 1 nmol of INNA-X prior to infection. Cells were harvested 8 hours after infection and stained for surface expression of HA, neuraminidase (NA), matrix-2 (M2) influenza viral proteins, and intracellular expression of NP. (G) INNA-X–treated LA-4 cells were lysed and proteins analyzed by reverse-phase liquid chromatography with tandem mass spectrometry (LC-MS/MS) after proteolytic digestion. Sample comparisons were performed using the MaxQuant proteomics platform to determine differentially expressed proteins (red) in INNA-X–treated cells relative to those treated with diluent. Statistical analysis was performed using (BD and E) 1-way ANOVA with Tukey’s post hoc test and (F) Welch t test. *P < 0.05, **P < 0.01, ***P < 0.001.

Similar articles

Cited by

References

    1. Centers for Disease Control and Prevention. Past Seasons Vaccine Effectiveness Estimates. https://www.cdc.gov/flu/vaccines-work/past-seasons-estimates.html Updated January 29, 2020. Accessed February 5, 2021.
    1. Hurt AC. Antiviral therapy for the next influenza pandemic. Trop Med Infect Dis. 2019;4(2):67. doi: 10.3390/tropicalmed4020067. - DOI - PMC - PubMed
    1. Hurt AC. The epidemiology and spread of drug resistant human influenza viruses. Curr Opin Virol. 2014;8:22–29. doi: 10.1016/j.coviro.2014.04.009. - DOI - PubMed
    1. O’Neill LAJ, et al. The history of Toll-like receptors - redefining innate immunity. Nat Rev Immunol. 2013;13(6):453–460. doi: 10.1038/nri3446. - DOI - PubMed
    1. Mifsud EJ, et al. TLR agonists as modulators of the innate immune response and their potential as agents against infectious disease. Front Immunol. 2014;5:79. - PMC - PubMed

Publication types

MeSH terms