

Bioinformatics analyses of significant genes, related pathways, and candidate diagnostic biomarkers and molecular targets in SARS-CoV-2/COVID-19
- PMID: 33553808
- PMCID: PMC7854084
- DOI: 10.1016/j.genrep.2020.100956
Bioinformatics analyses of significant genes, related pathways, and candidate diagnostic biomarkers and molecular targets in SARS-CoV-2/COVID-19
Abstract
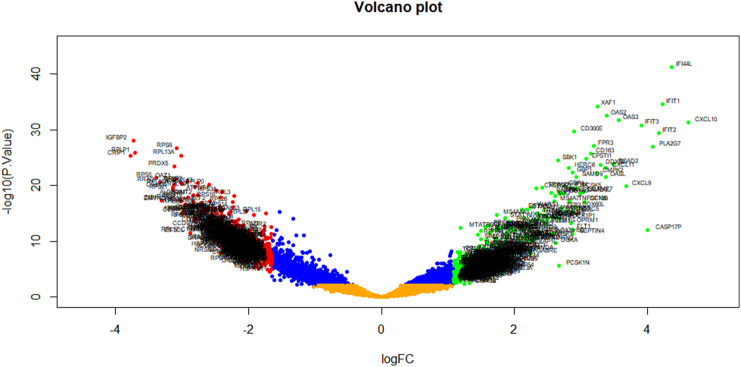
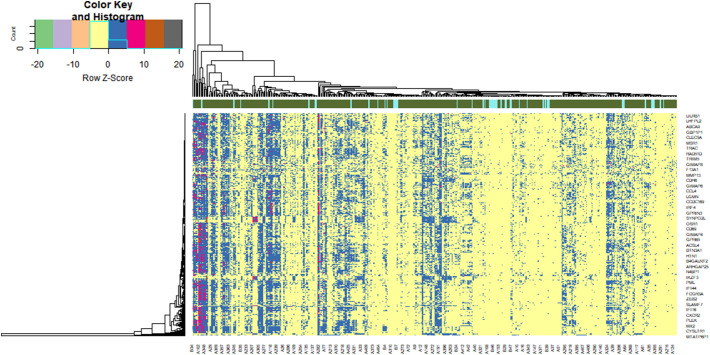
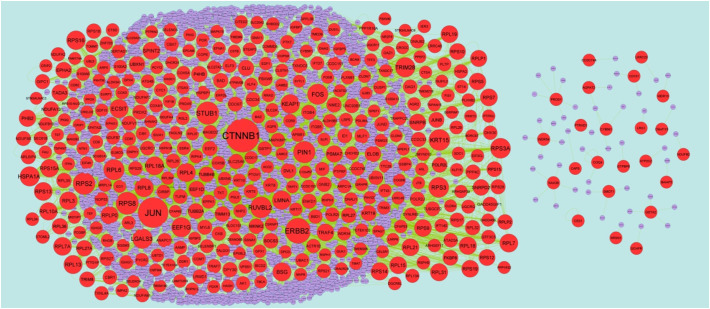
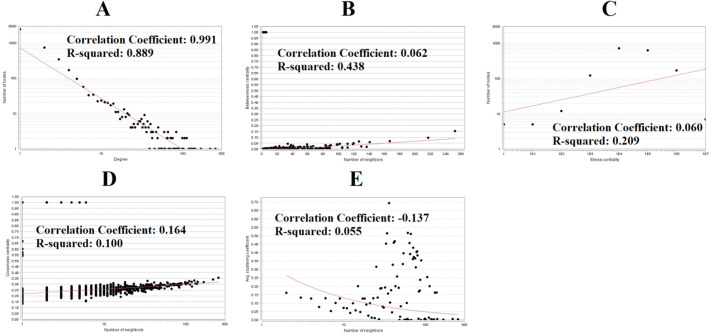
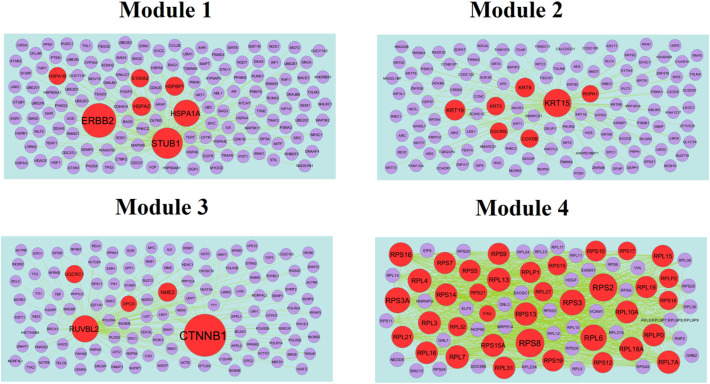
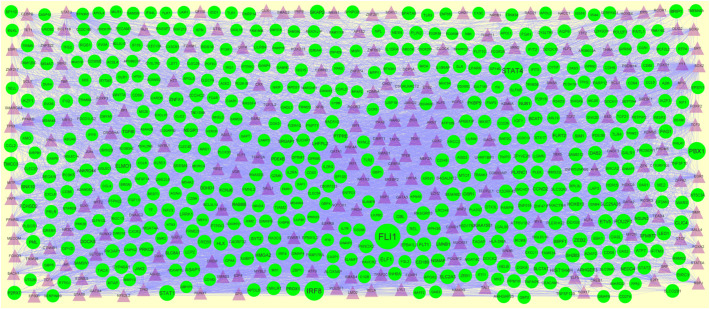
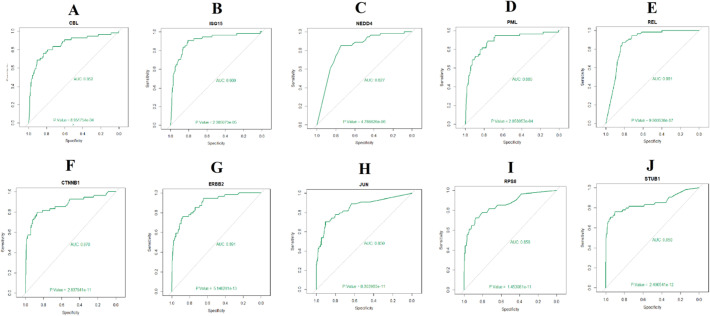
Severe acute respiratory syndrome corona virus 2 (SARS-CoV-2) infection is a leading cause of pneumonia and death. The aim of this investigation is to identify the key genes in SARS-CoV-2 infection and uncover their potential functions. We downloaded the expression profiling by high throughput sequencing of GSE152075 from the Gene Expression Omnibus database. Normalization of the data from primary SARS-CoV-2 infected samples and negative control samples in the database was conducted using R software. Then, joint analysis of the data was performed. Pathway and Gene ontology (GO) enrichment analyses were performed, and the protein-protein interaction (PPI) network, target gene - miRNA regulatory network, target gene - TF regulatory network of the differentially expressed genes (DEGs) were constructed using Cytoscape software. Identification of diagnostic biomarkers was conducted using receiver operating characteristic (ROC) curve analysis. 994 DEGs (496 up regulated and 498 down regulated genes) were identified. Pathway and GO enrichment analysis showed up and down regulated genes mainly enriched in the NOD-like receptor signaling pathway, Ribosome, response to external biotic stimulus and viral transcription in SARS-CoV-2 infection. Down and up regulated genes were selected to establish the PPI network, modules, target gene - miRNA regulatory network, target gene - TF regulatory network revealed that these genes were involved in adaptive immune system, fluid shear stress and atherosclerosis, influenza A and protein processing in endoplasmic reticulum. In total, ten genes (CBL, ISG15, NEDD4, PML, REL, CTNNB1, ERBB2, JUN, RPS8 and STUB1) were identified as good diagnostic biomarkers. In conclusion, the identified DEGs, hub genes and target genes contribute to the understanding of the molecular mechanisms underlying the advancement of SARS-CoV-2 infection and they may be used as diagnostic and molecular targets for the treatment of patients with SARS-CoV-2 infection in the future.
Keywords: Bioinformatics; CBL, Cbl proto-oncogene; DEGs, differentially expressed genes; Diagnosis; GO, Gene ontology; ISG15, ISG15 ubiquitin like modifier; Key genes; NEDD4, NEDD4 E3 ubiquitin protein ligase; PML, promyelocyticleukemia; PPI, protein-protein interaction; Pathways; REL, REL proto-oncogene, NF-kB subunit; ROC, receiver operating characteristic; SARS-CoV-2 infection; SARS-CoV-2, Severe acute respiratory syndrome corona virus 2.
© 2020 Elsevier Inc. All rights reserved.
Conflict of interest statement
The authors declare that they have no competing interests.
Figures


Similar articles
-
Identification of potential mRNA panels for severe acute respiratory syndrome coronavirus 2 (COVID-19) diagnosis and treatment using microarray dataset and bioinformatics methods.3 Biotech. 2020 Oct;10(10):422. doi: 10.1007/s13205-020-02406-y. Epub 2020 Sep 11. 3 Biotech. 2020. PMID: 33251083 Free PMC article.
-
Potential Molecular Mechanisms and Remdesivir Treatment for Acute Respiratory Syndrome Corona Virus 2 Infection/COVID 19 Through RNA Sequencing and Bioinformatics Analysis.Bioinform Biol Insights. 2021 Dec 23;15:11779322211067365. doi: 10.1177/11779322211067365. eCollection 2021. Bioinform Biol Insights. 2021. PMID: 34992355 Free PMC article.
-
The identification of key genes and pathways in hepatocellular carcinoma by bioinformatics analysis of high-throughput data.Med Oncol. 2017 Jun;34(6):101. doi: 10.1007/s12032-017-0963-9. Epub 2017 Apr 21. Med Oncol. 2017. PMID: 28432618 Free PMC article.
-
Identification of candidate biomarkers and therapeutic agents for heart failure by bioinformatics analysis.BMC Cardiovasc Disord. 2021 Jul 4;21(1):329. doi: 10.1186/s12872-021-02146-8. BMC Cardiovasc Disord. 2021. PMID: 34218797 Free PMC article.
-
Viral and Host Genetic and Epigenetic Biomarkers Related to SARS-CoV-2 Cell Entry, Infection Rate, and Disease Severity.Biology (Basel). 2022 Jan 23;11(2):178. doi: 10.3390/biology11020178. Biology (Basel). 2022. PMID: 35205046 Free PMC article. Review.
Cited by
-
Databases, Knowledgebases, and Software Tools for Virus Informatics.Adv Exp Med Biol. 2022;1368:1-19. doi: 10.1007/978-981-16-8969-7_1. Adv Exp Med Biol. 2022. PMID: 35594018
-
Generic model to unravel the deeper insights of viral infections: an empirical application of evolutionary graph coloring in computational network biology.BMC Bioinformatics. 2024 Feb 16;25(1):74. doi: 10.1186/s12859-024-05690-0. BMC Bioinformatics. 2024. PMID: 38365632 Free PMC article.
-
In-silico discovery of common molecular signatures for which SARS-CoV-2 infections and lung diseases stimulate each other, and drug repurposing.PLoS One. 2024 Jul 18;19(7):e0304425. doi: 10.1371/journal.pone.0304425. eCollection 2024. PLoS One. 2024. PMID: 39024368 Free PMC article.
-
HIMA2: high-dimensional mediation analysis and its application in epigenome-wide DNA methylation data.BMC Bioinformatics. 2022 Jul 25;23(1):296. doi: 10.1186/s12859-022-04748-1. BMC Bioinformatics. 2022. PMID: 35879655 Free PMC article.
-
Deciphering the role of precursor miR-12136 and miR-8485 in the progression of intellectual disability (ID).IBRO Neurosci Rep. 2022 Oct 21;13:393-401. doi: 10.1016/j.ibneur.2022.10.005. eCollection 2022 Dec. IBRO Neurosci Rep. 2022. PMID: 36345471 Free PMC article.
References
-
- Al-Afif A., Alyazidi R., Oldford S.A., Huang Y.Y., King C.A., Marr N., Haidl I.D., Anderson R., Marshall J.S. Respiratory syncytial virus infection of primary human mast cells induces the selective production of type I interferons, CXCL10, and CCL4. J. Allergy Clin. Immunol. 2015;136(5):1346–1354. doi: 10.1016/j.jaci.2015.01.042. e1. - DOI - PubMed
-
- Alaoui L., Palomino G., Zurawski S., Zurawski G., Coindre S., Dereuddre-Bosquet N., Lecuroux C., Goujard C., Vaslin B., Bourgeois C. Early SIV and HIV infection promotes the LILRB2/MHC-I inhibitory axis in cDCs. Cell. Mol. Life Sci. 2018;75(10):1871–1887. doi: 10.1007/s00018-017-2712-9. - DOI - PMC - PubMed
-
- Amraei R., Napoleon M., Yin W., Berrigan J., Suder E., Zhao G., Olejnik J., Gummuluru S., Muhlberger E., Chitalia V. 2020. CD209L/L-SIGN and CD209/DC-SIGN Act as Receptors for SARS-CoV-2 and Are Differentially Expressed in Lung and Kidney Epithelial and Endothelial Cells. Preprint. bioRxiv. - DOI
LinkOut - more resources
Full Text Sources
Research Materials
Miscellaneous