. 2021 Feb 4;19(1):20.
doi: 10.1186/s12915-021-00954-0.

Evolutionary dynamics and structural consequences of de novo beneficial mutations and mutant lineages arising in a constant environment

Affiliations

Evolutionary dynamics and structural consequences of de novo beneficial mutations and mutant lineages arising in a constant environment

Margie Kinnersley et al. BMC Biol. .

Abstract

Background: Microbial evolution experiments can be used to study the tempo and dynamics of evolutionary change in asexual populations, founded from single clones and growing into large populations with multiple clonal lineages. High-throughput sequencing can be used to catalog de novo mutations as potential targets of selection, determine in which lineages they arise, and track the fates of those lineages. Here, we describe a long-term experimental evolution study to identify targets of selection and to determine when, where, and how often those targets are hit.

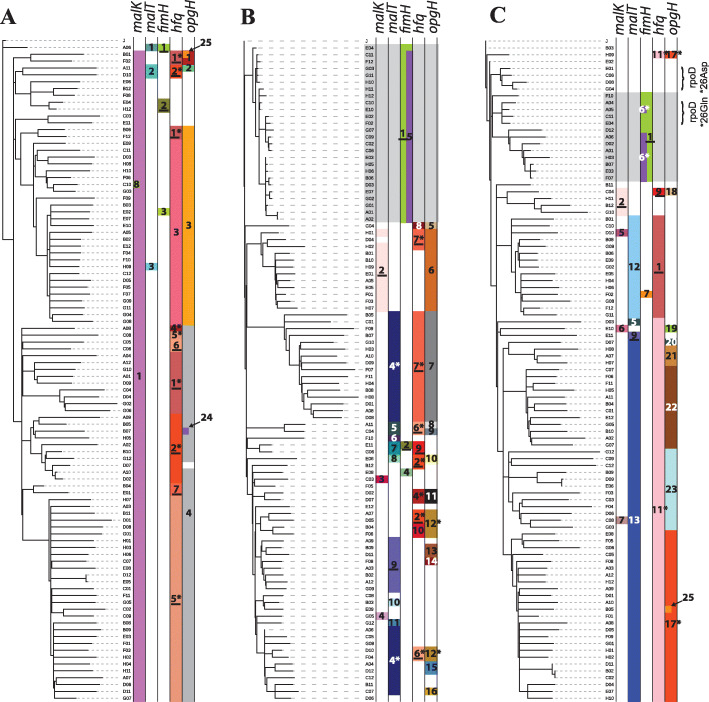
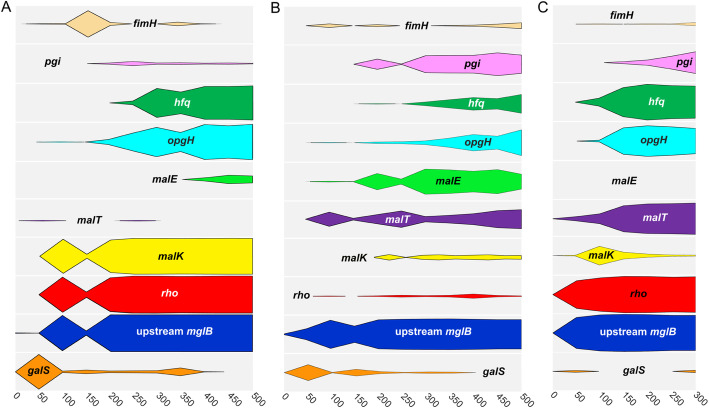
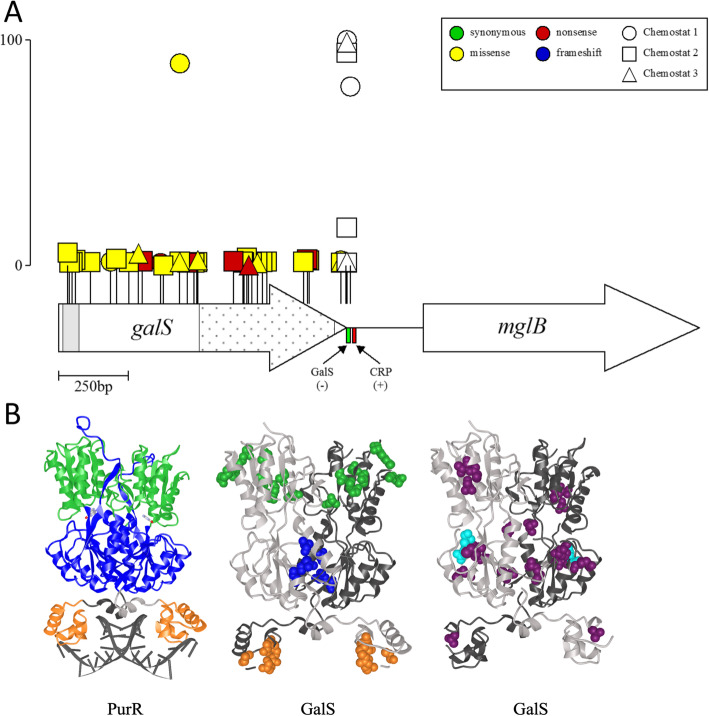
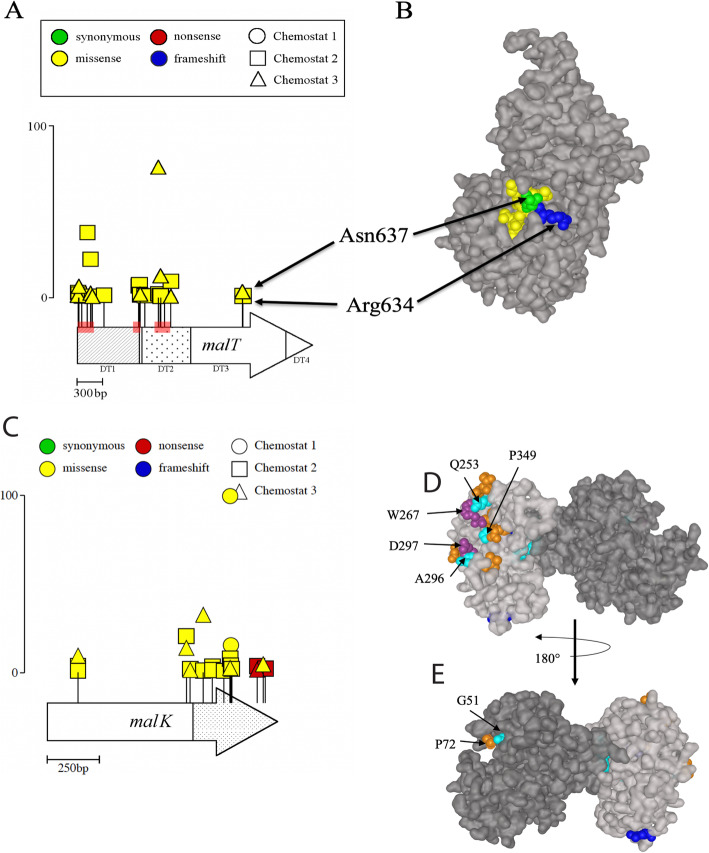
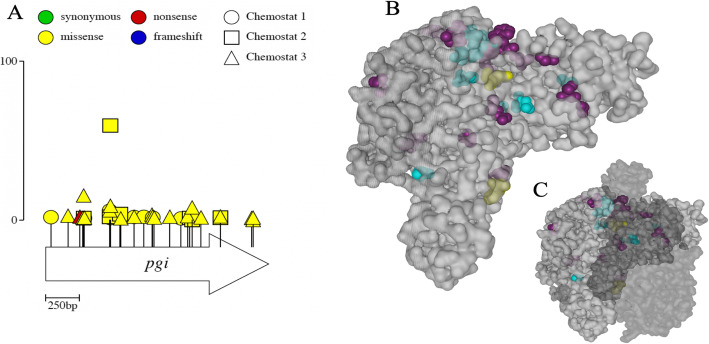
Results: We experimentally evolved replicate Escherichia coli populations that originated from a mutator/nonsense suppressor ancestor under glucose limitation for between 300 and 500 generations. Whole-genome, whole-population sequencing enabled us to catalog 3346 de novo mutations that reached > 1% frequency. We sequenced the genomes of 96 clones from each population when allelic diversity was greatest in order to establish whether mutations were in the same or different lineages and to depict lineage dynamics. Operon-specific mutations that enhance glucose uptake were the first to rise to high frequency, followed by global regulatory mutations. Mutations related to energy conservation, membrane biogenesis, and mitigating the impact of nonsense mutations, both ancestral and derived, arose later. New alleles were confined to relatively few loci, with many instances of identical mutations arising independently in multiple lineages, among and within replicate populations. However, most never exceeded 10% in frequency and were at a lower frequency at the end of the experiment than at their maxima, indicating clonal interference. Many alleles mapped to key structures within the proteins that they mutated, providing insight into their functional consequences.

Conclusions: Overall, we find that when mutational input is increased by an ancestral defect in DNA repair, the spectrum of high-frequency beneficial mutations in a simple, constant resource-limited environment is narrow, resulting in extreme parallelism where many adaptive mutations arise but few ever go to fixation.

Keywords: Adaptation; Clonal interference; E. coli; Experimental evolution; Parallelism; Resource limitation.


Conflict of interest statement

The authors declare that they have no competing interests.

Figures

Fig. 1
Fig. 1
Clone phylogenies. Phylogenies depicting relationships among sequenced clones isolated from chemostats when allelic diversity attained its maximum; a chemostat 1, b chemostat 2, c chemostat 3. Distributions of different malK, malT, fimH, hfq, and opgH alleles are indicated by colored bars. For each gene, all alleles observed in the dataset are numbered (see Additional file 3: Table S6 for details of which number corresponds to which allele for each gene). Underlined numbers denote alleles independently observed in more than one chemostat, while numbers marked with an asterisk appear to have arisen more than once within the same vessel. Gray shading delineates clades comprised of clones that have not acquired the standard mutations related to enhanced glucose uptake and instead carry variant fimH alleles that contribute to biofilm formation. Bracketed clones in chemostat 3 exhibited mutations expected to revert the ancestral nonsense mutations in the housekeeping gene encoding sigma factor RpoD
Fig. 2
Fig. 2
Muller diagrams. Evolutionary dynamics of adaptive lineages, deduced from combining whole-population whole-genome sequence data and whole-genome sequence data of individual clones isolated from each chemostat at the time point where allelic diversity reached its maximum value. Select genes are indicated in the plots. See Fig. 4 for further details. Also note, most mutations that went extinct by the sampling time point are not shown. See Additional file 3: Table S6 for their relative frequencies. Additional file 5: Fig. S9, Additional file 6: Fig. S10, and Additional file 7: Fig. S11 each contain a PDF with scrollable panels that depict evolutionary dynamics for > 50 individual genes in chemostats 1, 2, and 3, respectively
Fig. 3
Fig. 3
Population-level dynamics of mutations in 10 frequently hit genes show consistent patterns. For each panel, a chemostat 1, b chemostat 2, and c chemostat 3, the elapsed number of generations is depicted on the x-axis; the height of each gray box within each panel represents a frequency of 100%. Cumulative frequencies for all alleles of a given gene present in the population at each time point were calculated and are represented as colored plots
Fig. 4
Fig. 4
Overview of pathways relating some of the most frequently mutated genes to glucose transport and metabolism. Numbers in parentheses next to protein/gene names denote the number of mutant alleles found in each chemostat population over the course of 300–500 generations (also see Additional file 1: Table S3)
Fig. 5
Fig. 5
Recurrent mutations at galS and CRP-binding sites upstream of mglB. a Location and frequency of galS mutations on the primary structure. Circles represent alleles from chemostat 1, triangles represent alleles from chemostat 2, and squares represent alleles from chemostat 3. Synonymous mutations are colored green, missense mutations yellow, nonsense mutations red, and frameshift mutations blue. Scale bar (0–100) indicates frequency attained by a particular mutant in an experimental population. Gray shading indicates the GalS helix-turn-helix DNA-binding motif and stipple indicates the GalS ligand-binding domain. CRP-binding site mutations are not colored as they only alter DNA sequences. b Left: Ribbon diagram of dimeric E. coli purine repressor PurR bound to dsDNA. Three main functional regions of the protein are indicated: the N-terminal DNA-binding domain (orange), the C-terminal sub-domain involved in intramolecular signaling (blue), and the C-terminal sub-domain involved in dimer stabilization (green). The PurR ligand guanine is shown in gray cartoon style (PDBID 1WET) [67]. Middle: SWISSMODEL representation of the GalS repressor based on the structure of PurR (PDBID 1JFS, 32.53% sequence identity). Mutations grouped in the N-terminal DNA-binding domain are shown as orange spheres, while the two groups of C-terminal mutations indicated in a are shown in green and blue. Right: GalS model with conserved and repeatedly mutated residue Arg146 colored cyan and the remaining mutations that occurred in the middle portion of the protein colored purple
Fig. 6
Fig. 6
Recurrent mutations in lamB regulators malT and malK. a Location and frequency of malT mutations on the primary structure. Circles represent alleles from chemostat 1, triangles represent alleles from chemostat 2, and squares represent alleles from chemostat 3. Scale bar (0–100) indicates frequency attained by a particular mutant in an experimental population. The MalT protein consists of four structural domains (DT1–4) that function in nucleotide binding, effector sensing, and interaction with MalK (see text for details). b Crystal structure of MalT DT3 with residues identified by Richet et al. [71] as important for MalT/MalK interaction are colored. Asn637 and Arg634 were mutated in our data set and are colored green and blue, respectively. Residues that are part of the MalK contact site but were not mutated are colored yellow. c Location and frequency of malK mutations on the primary structure. The N-terminal nucleotide-binding domain is colored white, and the C-terminal regulatory domain is shown in stipple. d Location of mutations on the 3D structure of a single MalK monomer. The C-terminal regulatory domain is colored light gray, and the N-terminal nucleotide-binding domain is colored dark gray. Observed nonsense mutations (blue, aa 339, 352), missense mutations observed here and reported to cause constitutive mal expression (purple, aa 267 and 297), missense mutations observed here but not reported elsewhere (cyan, aa 51, 225, 231, 253, 286, 296, 298, 349), and missense mutations reported to cause increased mal expression but not seen in this study (orange, aa 72, 248, 250, 251, 262, 268, 291, 346, 350) all occur in the same region of the C-terminal regulatory domain. e View of a MalK monomer with domains and mutations as in b rotated 180° along the y-axis
Fig. 7
Fig. 7
Recurrent mutations in global regulator rho. a Location and frequency of mutations along the primary structure. Circles represent alleles from chemostat 1, triangles represent alleles from chemostat 2, and squares represent alleles from chemostat 3. Scale bar (0–100) indicates frequency attained by a particular mutant in an experimental population. The N-terminal primary RNA-binding domain (aa 22-116) is shown in stipple. P-loop (aa 179-183), Q-loop (aa 278-290), and R-loop (aa 322-326) residues are indicated with corresponding letters. b Rho allele frequencies over time for chemostats 1, 2, and 3. c Crystal structure of E. coli Rho (PDB ID 1PVO) showing the location of high-frequency mutations in panel b. Subunits A–F are depicted counterclockwise from the upper right. Val278 is shown in green, Ala293 in cyan, Arg87 in red, and Q-loop residues in yellow stick representation. d Detail view ribbon representation of a single Rho subunit (PDB ID 2HT1) with Val278, Ala293, Arg87, and Q-loop residues colored as in panel c
Fig. 8
Fig. 8
Recurrent missense mutations in pgi. a Location and frequency of mutations along the primary structure. Circles represent alleles from chemostat 1, triangles represent alleles from chemostat 2, and squares represent alleles from chemostat 3. Scale bar (0–100) indicates frequency attained by a particular mutant in an experimental population. b Surface representation of a single Pgi monomer with mutations observed in two or more chemostats colored cyan, those that occurred in only one chemostat colored purple, and active site residues Glu355, His386, and Lys514 colored yellow. c Crystal structure of the Pgi dimer. Colors are as in b with the second subunit shown in translucent dark gray to highlight mutations that occur at the interface between the two subunits

Similar articles

Cited by

References

    1. Lang GI, Desai MM. The spectrum of adaptive mutations in experimental evolution. Genomics. 2014;104:412–416. doi: 10.1016/j.ygeno.2014.09.011. - DOI - PMC - PubMed
    1. Cvijovic I, Nguyen Ba AN, Desai MM. Experimental studies of evolutionary dynamics in microbes. Trends Genet. 2018;34:693–703. doi: 10.1016/j.tig.2018.06.004. - DOI - PMC - PubMed
    1. Cooper VS: Experimental evolution as a high-throughput screen for genetic adaptations. mSphere 2018;3(3):e00121-18. - PMC - PubMed
    1. Garay E, Campos SE, Gonzalez de la Cruz J, Gaspar AP, Jinich A, Deluna A: High-resolution profiling of stationary-phase survival reveals yeast longevity factors and their genetic interactions. Plos Genet 2014, 10:e1004168. - PMC - PubMed
    1. Paradis-Bleau C, Kritikos G, Orlova K, Typas A, Bernhardt TG. A genome-wide screen for bacterial envelope biogenesis mutants identifies a novel factor involved in cell wall precursor metabolism. PLoS Genet. 2014;10:e1004056. doi: 10.1371/journal.pgen.1004056. - DOI - PMC - PubMed

Publication types

MeSH terms

LinkOut - more resources