. 2021 Feb 2;13(2):231.
doi: 10.3390/v13020231.

Human Respiratory Syncytial Virus Infection in a Human T Cell Line Is Hampered at Multiple Steps

Affiliations

Human Respiratory Syncytial Virus Infection in a Human T Cell Line Is Hampered at Multiple Steps

Ricardo de Souza Cardoso et al. Viruses. .

Abstract

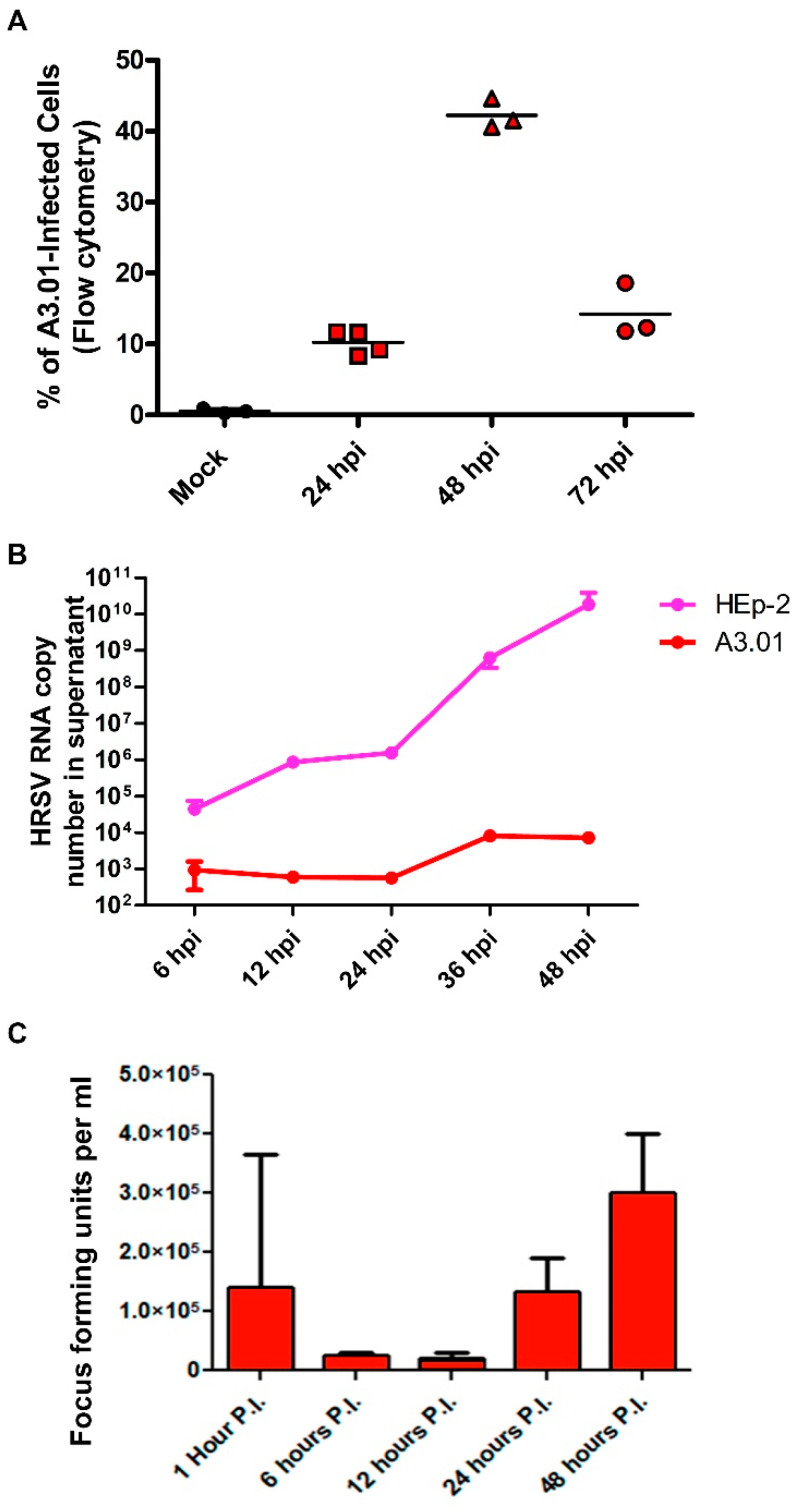
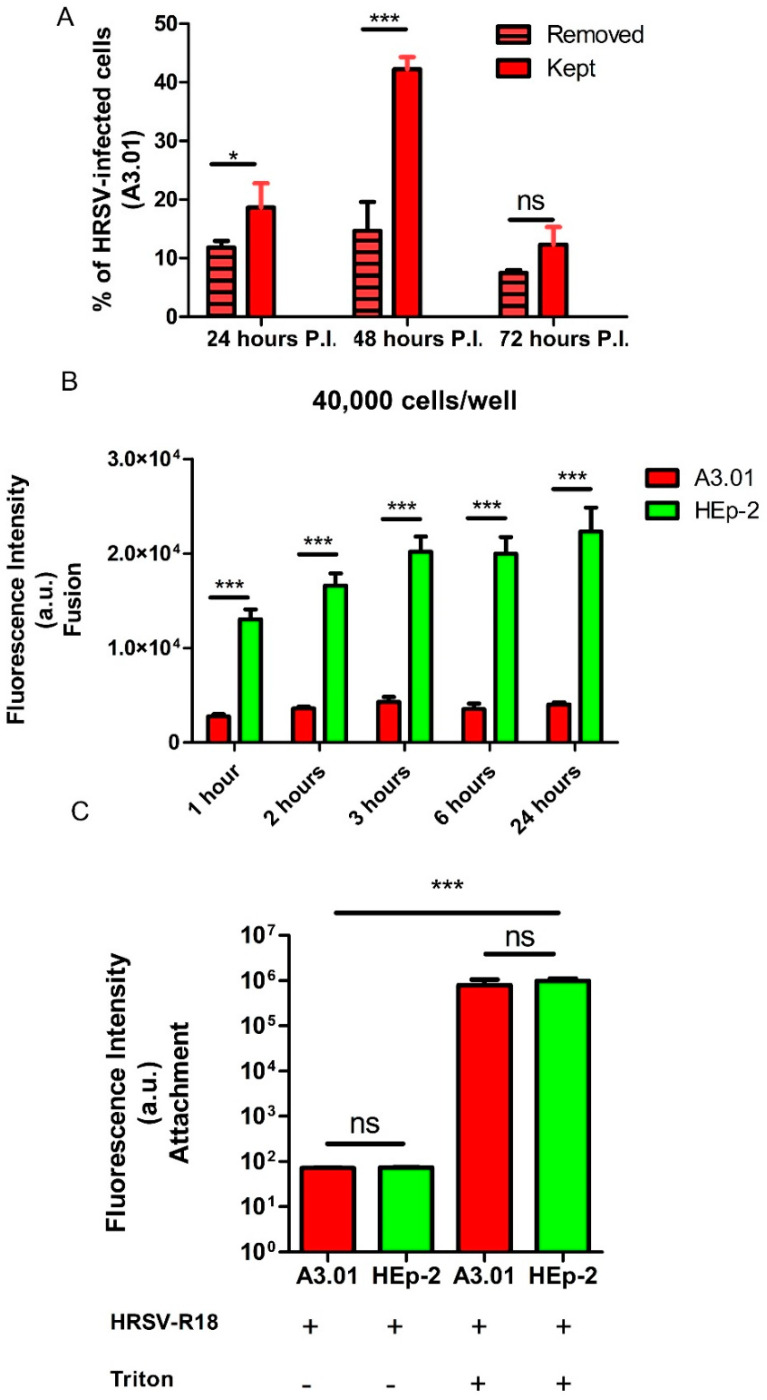
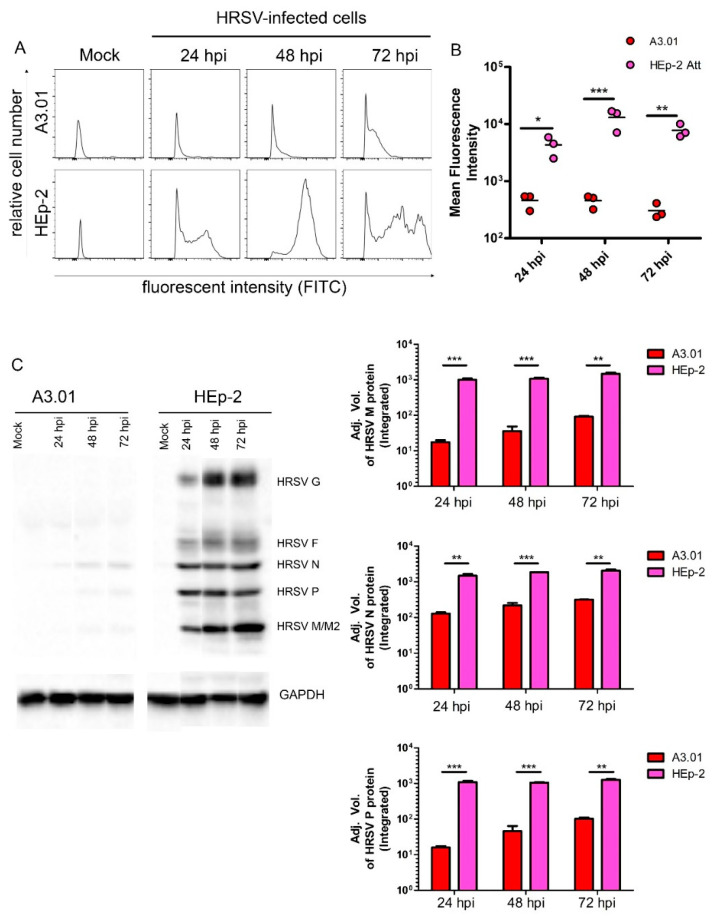
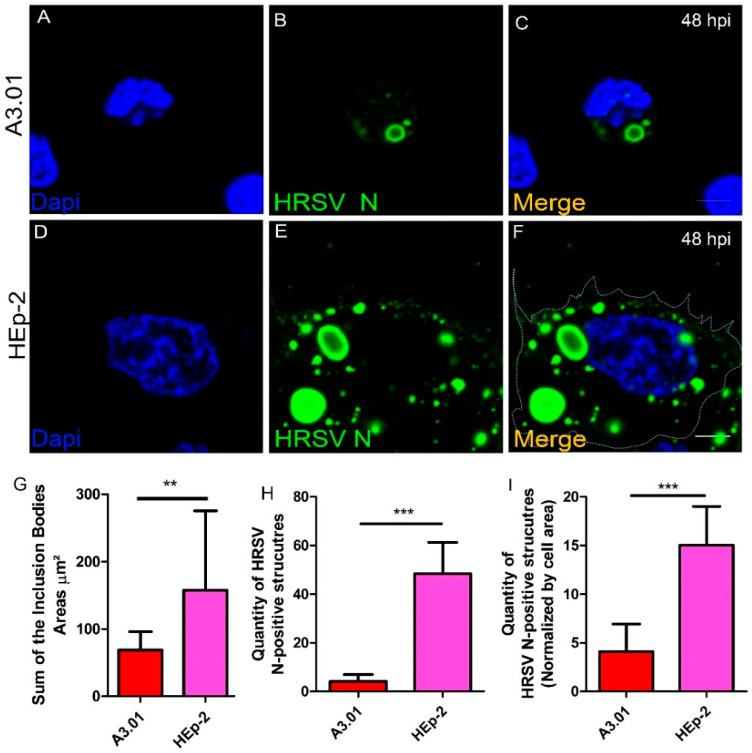
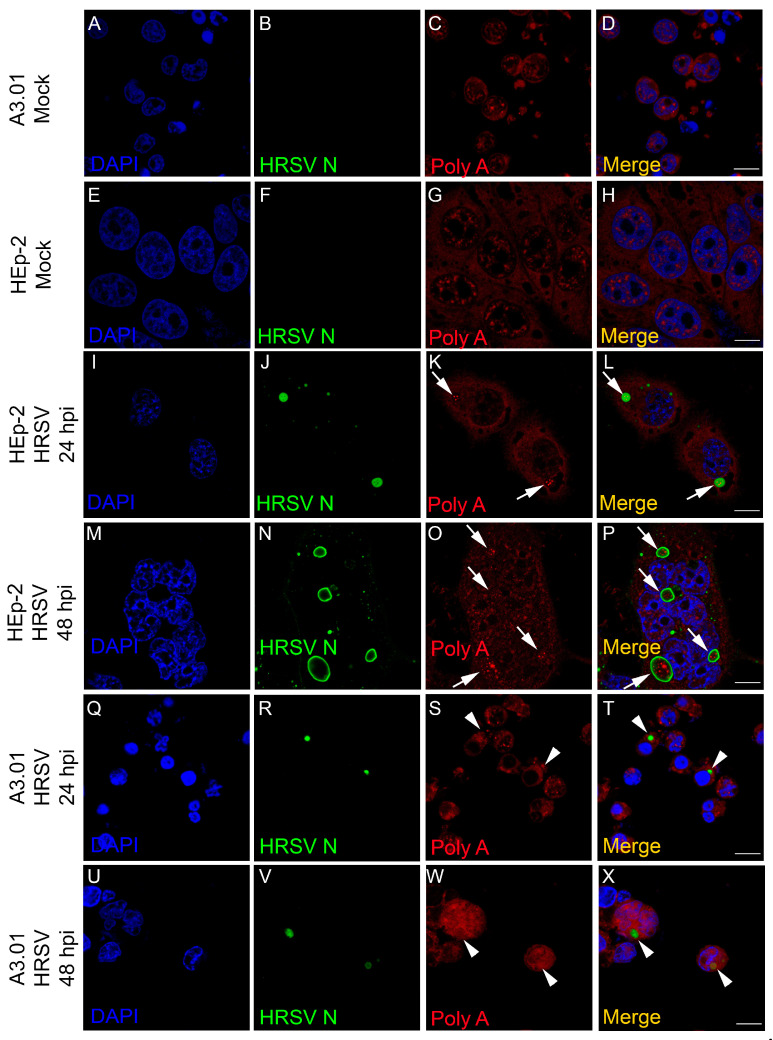
Human respiratory syncytial virus (HRSV) is the most frequent cause of severe respiratory disease in children. The main targets of HRSV infection are epithelial cells of the respiratory tract, and the great majority of the studies regarding HRSV infection are done in respiratory cells. Recently, the interest on respiratory virus infection of lymphoid cells has been growing, but details of the interaction of HRSV with lymphoid cells remain unknown. Therefore, this study was done to assess the relationship of HRSV with A3.01 cells, a human CD4+ T cell line. Using flow cytometry and fluorescent focus assay, we found that A3.01 cells are susceptible but virtually not permissive to HRSV infection. Dequenching experiments revealed that the fusion process of HRSV in A3.01 cells was nearly abolished in comparison to HEp-2 cells, an epithelial cell lineage. Quantification of viral RNA by RT-qPCR showed that the replication of HRSV in A3.01 cells was considerably reduced. Western blot and quantitative flow cytometry analyses demonstrated that the production of HRSV proteins in A3.01 was significantly lower than in HEp-2 cells. Additionally, using fluorescence in situ hybridization, we found that the inclusion body-associated granules (IBAGs) were almost absent in HRSV inclusion bodies in A3.01 cells. We also assessed the intracellular trafficking of HRSV proteins and found that HRSV proteins colocalized partially with the secretory pathway in A3.01 cells, but these HRSV proteins and viral filaments were present only scarcely at the plasma membrane. HRSV infection of A3.01 CD4+ T cells is virtually unproductive as compared to HEp-2 cells, as a result of defects at several steps of the viral cycle: Fusion, genome replication, formation of inclusion bodies, recruitment of cellular proteins, virus assembly, and budding.

Keywords: HRSV R18 fusion assay; HRSV entry; HRSV filament formation; HRSV inclusion body-associated granules (IBAG′s); HRSV intracellular trafficking; HRSV low protein production; human respiratory syncytial virus (HRSV) infection in T-cell line; inefficient HRSV replication A3.01.


Conflict of interest statement

The authors declare no conflict of interest. The funders had no role in the design of the study; in the collection, analyses, or interpretation of data; in the writing of the manuscript, or in the decision to publish the results.

Figures

Figure 1
Figure 1
Infection of human respiratory syncytial virus (HRSV) in A3.01 cells. (A) Flow cytometry analysis of mock and HRSV-infected cells showing the percentage of the infected cells by detection of HRSV N protein. (B) RT-qPCR of HRSV genome in supernatant of infected HEp-2 and A3.01 cells over time post-infection. (C) HRSV progeny production in A3.01 cells determined by fluorescent focus assay. All results are from at least three independent experiments.
Figure 2
Figure 2
Intracellular accumulation of HRSV genome in A3.01 and HEp-2 cells. A3.01 and HEp-2 cells attached (Att) or in suspension (Sus) were inoculated with HRSV or mock-inoculated and kept at 4 °C for 1 h for attachment. Then, cells were centrifuged and collected for qPCR analysis at time zero and at different times thereafter. Genome quantification was plotted in the Y axis. The “virus-only” well received only virus in the absence of cells. This graph is a representation of three independent experiments.
Figure 3
Figure 3
The fusion process in A3.01 is inefficient. (A) Differences between HRSV-infected cells with and without inoculum removal at different times post-infection. (B) Comparison of the fusion process in A3.01 and HEp-2 cells over time with 40,000 cells per well. (C) Comparison of the HRSV attachment in A3.01 and HEp-2 cells. The graphs in (A), (B), and (C) represent at least three independent experiments. The statistical method used was student’s t-test, * p < 0.05 and *** p < 0.001. The intensity of fluorescence emitted by R18 was measured by a SynergyTM Multi-Mode Microplate Reader.
Figure 4
Figure 4
HRSV protein production in A3.01 cells is discrete. (A) Histogram of mean intensities of fluorescence of cells by a flow cytometry. (B) Graph plotted from three different experiments comparing the production of HRSV N protein in A3.01 and HEp-2 attached (Att) cells at 24 h, 48 h, and 72 h post-infection. (C) Western blot of HEp-2 and A3.01 cells infected or not (MOCK) by HRSV. GAPDH was used as housekeeping loading control, and the graphs represent the analysis of the protein bands of three independent experiments. The statistical method used in (B) was two-way ANOVA, and the statistical method used in (C) was student’s t-test, * p < 0.05, ** p < 0.01, and *** p < 0.001.
Figure 5
Figure 5
HRSV inclusion bodies in HRSV-infected A3.01 and HEp-2 cells. (AC) A3.01 cells stained for HRSV N protein at 48 hpi (green fluorescence). (DF) staining for HRSV N protein in HEp-2 cells at 48 hpi. (G) Comparative analysis of the sum of the inclusion body area in A3.01 and HEp-2 cells. (H) Comparative analysis of numbers of vesicular structures stained for HRSV N in A3.01 and HEp-2 cells. (I) Comparative analysis of the structures stained for HRSV N in A3.01 and HEp-2 cells normalized by cell area. The immunofluorescence images shown in figures (AF) represent a single focal plane of at least three independent experiments. The images were taken in a Zeiss 780 confocal microscope. Magnification 63x. The scale bars represent = 10µm. The graphs in (G) and (H) represent at least three independent experiments. The statistical method used was student’s t-test, ** p < 0.01 and *** p < 0.001.
Figure 6
Figure 6
HRSV inclusion bodies in A3.01 in the absence of IBAGs. (AD) and (EH) A3.01 and HEp-2 mock-infected cells. (IP) HRSV infected HEp-2 cells at 24 and 48 hpi, as shown by inclusion bodies (IBs) in (J,N), respectively. Within the IBs in (J,N), it is possible to see a fluorescent in situ hybridization (FISH) signal for the IBAGs, as shown in (K,L,O,P) (arrows). (QX) represent A3.01-infected cells at 24 and 48 hpi. No inclusion body-associated granules (IBAGs) were seen within HRSV inclusion bodies (R,V) in these cells, as shown in (S,T,W,X). This set of figures represents a single focal plane of three independent experiments taken in a Zeiss 780 Confocal. Magnification 63x. Scale bars = 10 µm.
Figure 7
Figure 7
Colocalization analysis of HRSV proteins at the Golgi in A3.01 and HEp-2 cells. (AD) A3.01 mock-infected cells stained for cis and medial-Golgi (Giantin) in red (B), trans-Golgi (TGN46) (magenta) (C), merge (D). (EH) HRSV-infected A3.01 cells at 48 hpi stained for HRSV F (green) (E), giantin (F), and TGN46 (G). The merge is depicted in (H). (IL) HRSV-infected A3.01 cells at 48 hpi stained for HRSV N (I), giantin (J), and TGN46 (K). The merge of the figure is in (L). (MO) HRSV-infected HEp-2 cells at 48 hpi stained for HRSV F (green) (M), giantin (red) (N), and merge (O). The arrow points to co-localization. (PR) HRSV-infected HEp-2 cells at 48 hpi stained for HRSV F (P), TGN46 (magenta) (Q), and merge (R). The arrow points to colocalization. (SU) HRSV-infected HEp-2 cells at 48 hpi stained for HRSV N (S), giantin (T), and merge (U). The arrows point to colocalization. (VX) HRSV-infected HEp-2 cells at 48 hpi stained for HRSV N (V), TGN46 (X), and the merge (X). The arrows point to colocalization. All the figures represent a single focal plane of at least three independent experiments and Z-stack taken in a Zeiss 780 Confocal or Leica Sp5 Confocal microscope. Magnification 63×. Scale bars = 10 µm.
Figure 8
Figure 8
Colocalization of EEA1 and Lamp-1 with HRSV proteins in A3.01 cells. (AD) A3.01 mock-infected cells. (B) Lamp-1 (red), (C) EEA1 (magenta), and (D) the merge of the set of the figures. (EH) HRSV-infected A3.01 cells at 48 hpi, stained by HRSV F (green) (E), Lamp-1 (F), and EEA1 (G). The merge to this set of figures is depicted in (H). (IL) HRSV-infected A3.01 cells at 48 hpi, stained by HRSV N (green) (I), Lamp-1 (J), and EEA1 (K). The merge of this figure set is depicted in (L). All the images were taken in a Zeiss 780 Confocal and are a representation of a single focal plane. Magnification 63×. Scale bars = 10 µm.
Figure 9
Figure 9
Colocalization of CD63 and SNX2 with HRSV proteins in A3.01 and HEp-2 cells. (AD) A3.01 mock-infected cells at 48 hpi. (B) CD63 (red), (C) SNX2 (magenta), and (D) the merge. (EH) HRSV-infected A3.01 cells at 48 hpi, stained by HRSV F (green) (E), CD63 (F), and SNX2 (G). In (F), the arrowheads point to the places where the HRSV F protein was found and the CD63 was accumulated. The arrows point to the places where the cells were not infected and there was not CD63 accumulation. The merge to this set of figures is depicted in (H). (I) Graph of colocalization between CD63 and SNX2 with HRSV proteins in A3.01 cells, showing significant colocalization of CD63. (JM) HRSV-infected, A3.01-infected cells at 48 hpi, stained by HRSV N (green) (J), CD63 (K) and SNX2 (L). In (K), the arrowhead points to the place where the HRSV N protein was found and the CD63 was accumulated. The arrows point to the places where the cells were not infected and there was not CD63 accumulation. The merge to this set of figures is depicted in (M). (N) Graph comparing the colocalization of HRSV F and N proteins with CD63. (OQ) HRSV-infected HEp-2 cells at 48 hpi, stained by HRSV F (green) (O), SNX2 (magenta) (P), and the merge (Q). (RT) HRSV-infected HEp-2 cells, stained by HRSV F (R), CD63 (red) (S), and the merge (T). (UW) HRSV-infected HEp-2 cells at 48 hpi, stained by HRSV N (green) (U), SNX2 (V) and the merge (W), where the arrows point to colocalization. (XZ) HRSV-infected HEp-2 cells at 48 hpi, stained by HRSV N (X), CD63 (Y), and the merge (Z). All the images were taken in a Zeiss 780 Confocal or Leica SP5 Confocal and are a representation of a single focal plane of Z-stack or not experiments. Magnification 63×. Scale bars = 10 µm. The graphs shown in figures I and N represent the Mander’s Coefficient analysis based on three or more independent experiments and were done in at least five cells per field. The statistical method used was student’s t-test, * p < 0.05 and *** p < 0.001.
Figure 10
Figure 10
Filament formation of HRSV in A3.01 is rare. (AC) Immunofluorescence for HRSV N and M in A3.01-infected cells at 48 hpi, depicting some filaments pointed out by arrowheads. (DF) Immunofluorescence for HRSV N and M in HEp-2-infected cells at 48 hpi, depicting filaments pointed out by arrowheads. (AF) A single focal plane of at least three independent experiments taken in a Leica SP5 Confocal. Magnification 63×. This experiment was repeated at least three independent times. The scale bar of figure (C) = 10 µm. (G) Graph of the percentage of A3.01 and HEp-2-infected cells displaying at least one filament emerging from the plasma membrane per field. (H) Graph of the quantity of the filaments in A3.01 and HEp-2-infected cells. (I) Graph of the quantity of the filaments in A3.01 and HEp-2-infected cells normalized by the cell area. The graphs depicted in (G), (H), and (I) are representative of more than five independent experiments. Each dot in the graphs (G), (H), and (I) corresponds to one microscopic field. The statistical method used was student’s t-test, *** p < 0.001. All the images were taken in a Zeiss 780 or Leica SP5 Confocal and are a representation of a single focal plane. Magnification 63×. Scale bars = 10 µm.

Similar articles

Cited by

References

    1. Collins P.L., Karron R.A. Respiratory Syncytial Virus and Metapneumovirus. In: Knipe M.D., Howley M.P., editors. Fields Virology. 6th ed. Wolters Kluwer, Lippincott Williams & Wilkins; Philadelphia, PA, USA: 2013. pp. 1086–1123.
    1. Rezaee F., Gibson L.F., Piktel D., Othumpangat S., Piedimonte G. Respiratory syncytial virus infection in human bone marrow stromal cells. Am. J. Respir Cell Mol. Biol. 2011;45:277–286. doi: 10.1165/rcmb.2010-0121OC. - DOI - PMC - PubMed
    1. Mills B.G., Singer F.R., Weiner L.P., Holst P.A. Immunohistological demonstration of respiratory syncytial virus antigens in Paget disease of bone. Proc. Natl. Acad. Sci. USA. 1981;78:1209–1213. doi: 10.1073/pnas.78.2.1209. - DOI - PMC - PubMed
    1. Modena J.L., Valera F.C., Jacob M.G., Buzatto G.P., Saturno T.H., Lopes L., Souza J.M., Paula F.E., Silva M.L., Carenzi L.R., et al. High rates of detection of respiratory viruses in tonsillar tissues from children with chronic adenotonsillar disease. PLoS ONE. 2012;7:e42136. doi: 10.1371/journal.pone.0042136. - DOI - PMC - PubMed
    1. Raiden S., Sananez I., Remes-Lenicov F., Pandolfi J., Romero C., De Lillo L., Ceballos A., Geffner J., Arruvito L. Respiratory syncytial virus (RSV) infects CD4+ T cells: Frequency of circulating CD4+ RSV+ T cells as a marker of disease severity in young children. J. Infect. Dis. 2017;215:1049–1058. doi: 10.1093/infdis/jix070. - DOI - PMC - PubMed

Publication types

MeSH terms

Substances