

A novel diphtheria toxin-based bivalent human EGF fusion toxin for treatment of head and neck squamous cell carcinoma
- PMID: 33540470
- PMCID: PMC8024719
- DOI: 10.1002/1878-0261.12919
A novel diphtheria toxin-based bivalent human EGF fusion toxin for treatment of head and neck squamous cell carcinoma
Abstract
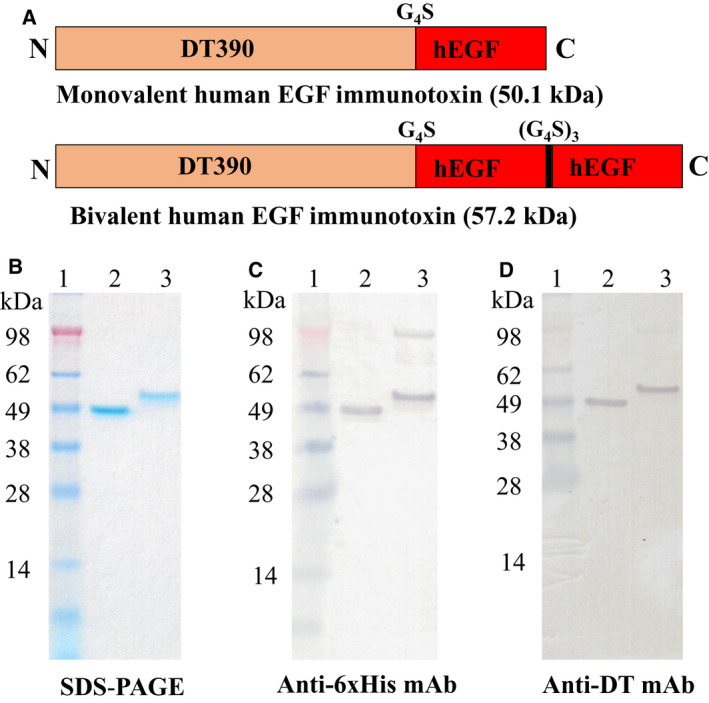
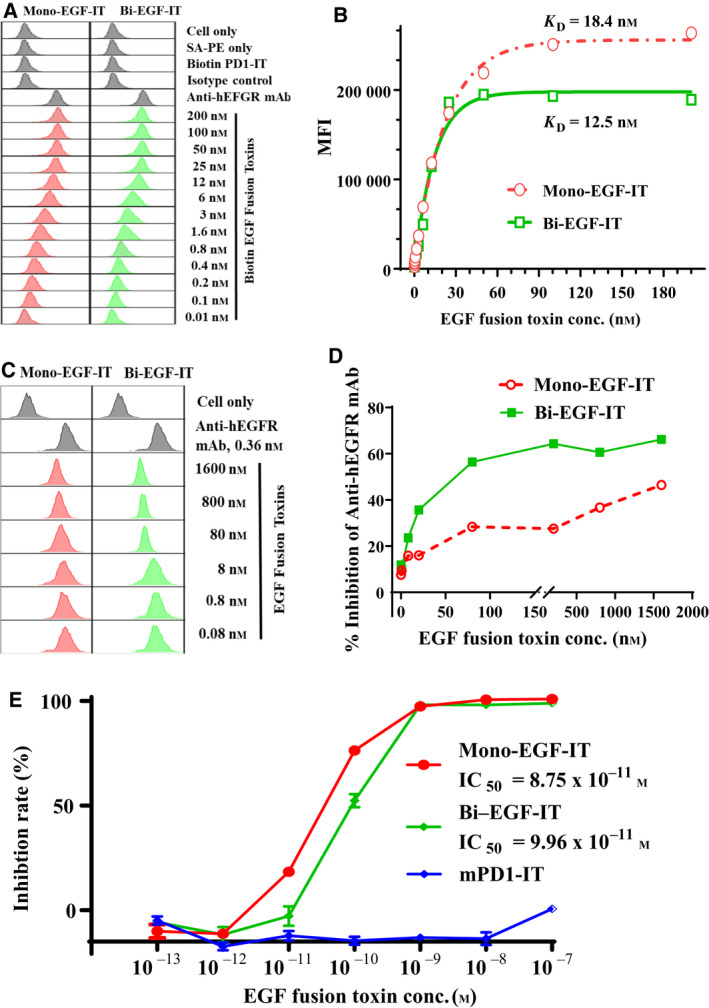
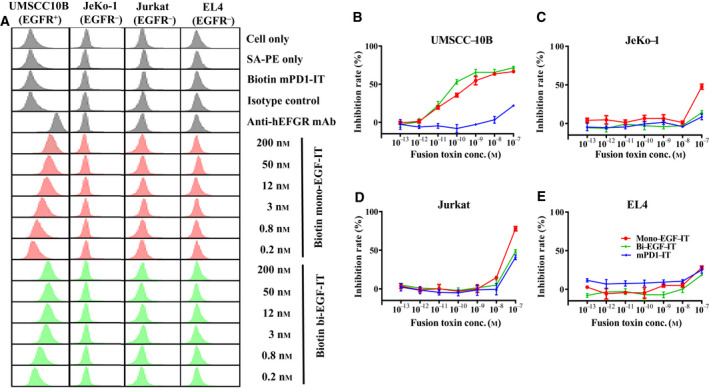
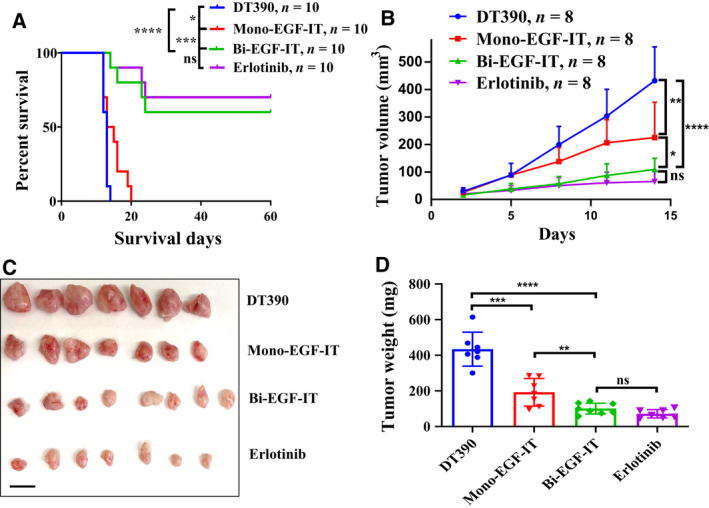
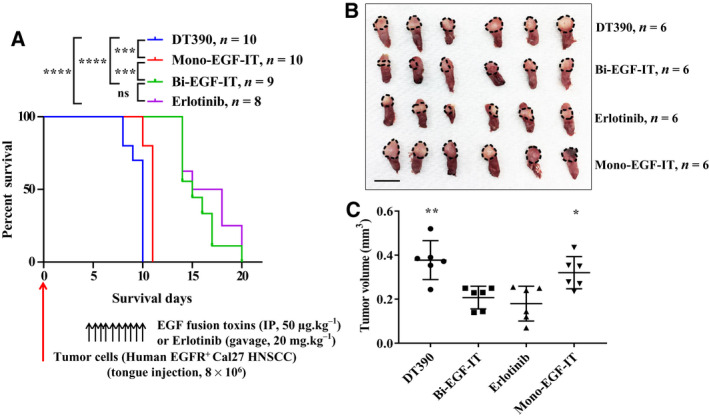
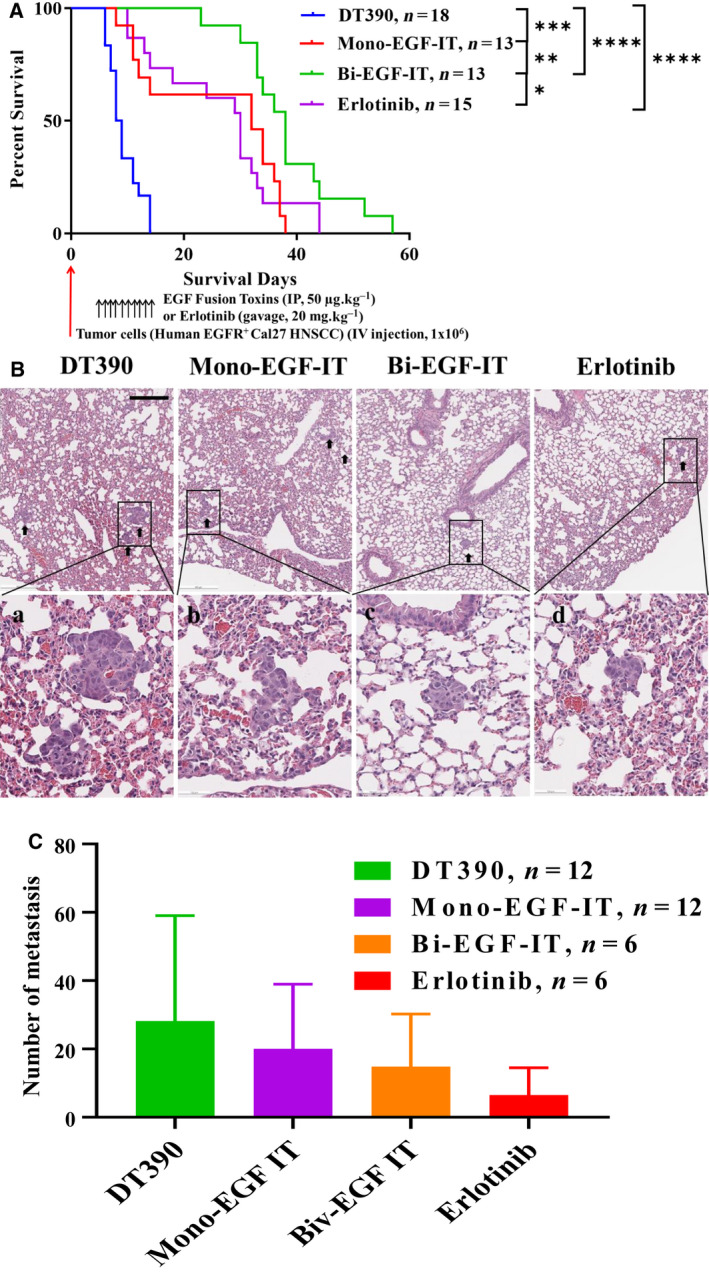
Epidermal growth factor receptor (EGFR) is often overexpressed in head and neck squamous cell carcinoma (HNSCC) and represents a top candidate for targeted HNSCC therapy. However, the clinical effectiveness of current Food and Drug Administration (FDA)-approved drugs targeting EGFR is moderate, and the overall survival rate for HNSCC patients remains low. Therefore, more effective treatments are urgently needed. In this study, we generated a novel diphtheria toxin-based bivalent human epidermal growth factor fusion toxin (bi-EGF-IT) to treat EGFR-expressing HNSCC. Bi-EGF-IT was tested for in vitro binding affinity, cytotoxicity, and specificity using 14 human EGFR-expressing HNSCC cell lines and three human EGFR-negative cancer cell lines. Bi-EGF-IT had increased binding affinity for EGFR-expressing HNSCC compared with the monovalent version (mono-EGF-IT), and both versions specifically depleted EGFR-positive HNSCC, but not EGFR-negative cell lines, in vitro. Bi-EGF-IT exhibited a comparable potency to that of the FDA-approved EGFR inhibitor, erlotinib, for inhibiting HNSCC tumor growth in vivo using both subcutaneous and orthotopic HNSCC xenograft mouse models. When tested in an experimental metastasis model, survival was significantly longer in the bi-EGF-IT treatment group than the erlotinib treatment group, with a significantly reduced number of metastases compared with mono-EGF-IT. In addition, in vivo off-target toxicities were significantly reduced in the bi-EGF-IT treatment group compared with the mono-EGF-IT group. These results demonstrate that bi-EGF-IT is more effective and markedly less toxic at inhibiting primary HNSCC tumor growth and metastasis than mono-EGF-IT and erlotinib. Thus, the novel bi-EGF-IT is a promising drug candidate for further development.
Keywords: EGF; EGFR; HNSCC; diphtheria toxin; fusion toxin; head and neck cancer.
© 2021 The Authors. Molecular Oncology published by John Wiley & Sons Ltd on behalf of Federation of European Biochemical Societies.
Conflict of interest statement
The authors declare no conflict of interest.
Figures
Similar articles
-
EGF‑IL2 bispecific and bivalent EGF fusion toxin efficacy against syngeneic head and neck cancer mouse models.Oncol Rep. 2023 Feb;49(2):37. doi: 10.3892/or.2022.8474. Epub 2022 Dec 29. Oncol Rep. 2023. PMID: 36579667 Free PMC article.
-
Co-targeting EGFR and IKKβ/NF-κB signalling pathways in head and neck squamous cell carcinoma: a potential novel therapy for head and neck squamous cell cancer.Br J Cancer. 2019 Feb;120(3):306-316. doi: 10.1038/s41416-018-0351-z. Epub 2018 Dec 26. Br J Cancer. 2019. PMID: 30585254 Free PMC article.
-
Design of an EGFR-targeting toxin for photochemical delivery: in vitro and in vivo selectivity and efficacy.Oncogene. 2015 Oct 29;34(44):5582-92. doi: 10.1038/onc.2015.15. Epub 2015 Feb 16. Oncogene. 2015. PMID: 25684137
-
Phytochemicals targeting epidermal growth factor receptor (EGFR) for the prevention and treatment of HNSCC: A review.Medicine (Baltimore). 2023 Oct 6;102(40):e34439. doi: 10.1097/MD.0000000000034439. Medicine (Baltimore). 2023. PMID: 37800790 Free PMC article. Review.
-
Current challenges and clinical investigations of epidermal growth factor receptor (EGFR)- and ErbB family-targeted agents in the treatment of head and neck squamous cell carcinoma (HNSCC).Cancer Treat Rev. 2014 May;40(4):567-77. doi: 10.1016/j.ctrv.2013.10.002. Epub 2013 Oct 12. Cancer Treat Rev. 2014. PMID: 24216225 Review.
Cited by
-
DNMT1-targeting remodeling global DNA hypomethylation for enhanced tumor suppression and circumvented toxicity in oral squamous cell carcinoma.Mol Cancer. 2024 May 16;23(1):104. doi: 10.1186/s12943-024-01993-1. Mol Cancer. 2024. PMID: 38755637 Free PMC article.
-
cMPL-Based Purification and Depletion of Human Hematopoietic Stem Cells: Implications for Pre-Transplant Conditioning.bioRxiv [Preprint]. 2024 Feb 28:2024.02.24.581887. doi: 10.1101/2024.02.24.581887. bioRxiv. 2024. PMID: 38464076 Free PMC article. Preprint.
-
From Anti-HER-2 to Anti-HER-2-CAR-T Cells: An Evolutionary Immunotherapy Approach for Gastric Cancer.J Inflamm Res. 2022 Jul 17;15:4061-4085. doi: 10.2147/JIR.S368138. eCollection 2022. J Inflamm Res. 2022. PMID: 35873388 Free PMC article. Review.
-
The Agonistic Activity of the Human Epidermal Growth Factor is Reduced by the D46G Substitution.Protein Pept Lett. 2024;31(7):504-518. doi: 10.2174/0109298665297321240708044223. Protein Pept Lett. 2024. PMID: 39041280
-
Identification of a new anoikis-related gene signature for prognostic significance in head and neck squamous carcinomas.Medicine (Baltimore). 2023 Sep 8;102(36):e34790. doi: 10.1097/MD.0000000000034790. Medicine (Baltimore). 2023. PMID: 37682196 Free PMC article.
References
-
- Chow LQM (2020) Head and neck cancer. N Engl J Med 382, 60–72. - PubMed
-
- Cramer JD, Burtness B, Le QT & Ferris RL (2019) The changing therapeutic landscape of head and neck cancer. Nat Rev Clin Oncol 16, 669–683. - PubMed
-
- Siegel RL, Miller KD & Jemal A (2017) Cancer Statistics, 2017. CA Cancer J Clin 67, 7–30. - PubMed
Publication types
MeSH terms
Substances
Grants and funding
LinkOut - more resources
Full Text Sources
Other Literature Sources
Research Materials
Miscellaneous
